| Param | Original file | Final file |
|---|---|---|
| Filename | modeM0/AS1A14_012T01_9000006512_54123cztM0_level2.fits | modeM0/AS1A14_012T01_9000006512_54123cztM0_level2_quad_clean.evt |
| Size (bytes) | 401,976,000 | 92,007,360 |
| Size | 383.4 MB | 87.7 MB |
| Events in quadrant A | 3,214,623 | 604,586 |
| Events in quadrant B | 4,277,304 | 642,236 |
| Events in quadrant C | 2,958,322 | 577,192 |
| Events in quadrant D | 3,947,712 | 529,730 |
| Mode SS | |||
|---|---|---|---|
| Quadrant | BADHDUFLAG | Total packets | Discarded packets |
| A | 0 | 126 | 0 |
| B | 0 | 126 | 0 |
| C | 0 | 126 | 0 |
| D | 0 | 126 | 0 |
| Mode M0 | |||
|---|---|---|---|
| Quadrant | BADHDUFLAG | Total packets | Discarded packets |
| A | 0 | 14084 | 1 |
| B | 0 | 16920 | 1 |
| C | 0 | 13529 | 1 |
| D | 0 | 15950 | 1 |
| Mode M9 | |||
|---|---|---|---|
| Quadrant | BADHDUFLAG | Total packets | Discarded packets |
| A | 0 | 11 | 0 |
| B | 0 | 11 | 0 |
| C | 0 | 11 | 0 |
| D | 0 | 11 | 0 |
| Quadrant | Total seconds | Saturated seconds | Saturation percentage |
|---|---|---|---|
| A | 6193 | 121 | 1.953819% |
| B | 6193 | 191 | 3.084127% |
| C | 6193 | 82 | 1.324076% |
| D | 6194 | 191 | 3.083629% |
Noise dominated data is calculated using 1-second bins in cleaned event files. If a bin has >2000 counts, and if more than 50% of those come from <1% of pixels, then it is considered to be noise-dominated and hence unusable.
| Quadrant | # 1 sec bins | Bins with >0 counts | Bins with >2000 counts | High rate bins dominated by noise | Noise dominated (total time) | Noise dominated (detector-on time) | Marked lightcurve |
|---|---|---|---|---|---|---|---|
| A | 7288 | 6193 | 69 | 69 | 0.95% | 1.11% | 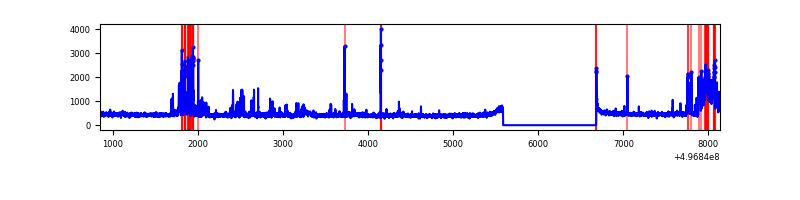 |
| B | 7288 | 6194 | 116 | 116 | 1.59% | 1.87% | 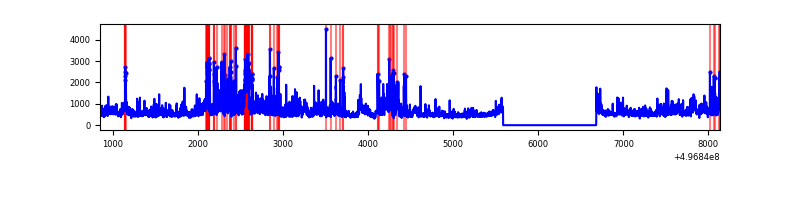 |
| C | 7288 | 6194 | 61 | 61 | 0.84% | 0.98% | 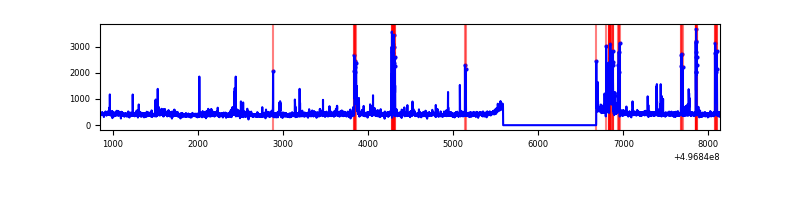 |
| D | 7289 | 6195 | 143 | 143 | 1.96% | 2.31% | 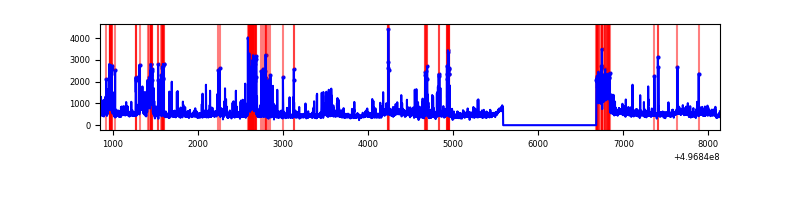 |
Top three noisy pixels from each quadrant. If the there are fewer than three noisy pixels in the level2.evt file, extra rows are filled as -1
| Pixel properties | Quadrant properties | ||||||
|---|---|---|---|---|---|---|---|
| Quadrant | DetID | PixID | Counts | Sigma | Mean | Median | Sigma |
| A | 15 | 174 | 264126 | 1597.97 | 658 | 640 | 164.9 |
| A | 7 | 14 | 221901 | 1341.89 | 658 | 640 | 164.9 |
| A | 8 | 6 | 42975 | 256.75 | 658 | 640 | 164.9 |
| B | 15 | 20 | 425941 | 3147.65 | 644 | 622 | 135.1 |
| B | 0 | 213 | 252572 | 1864.6 | 644 | 622 | 135.1 |
| B | 14 | 167 | 222606 | 1642.83 | 644 | 622 | 135.1 |
| C | 9 | 38 | 98590 | 559.09 | 637 | 630 | 175.2 |
| C | 13 | 3 | 97145 | 550.84 | 637 | 630 | 175.2 |
| C | 14 | 254 | 77431 | 438.33 | 637 | 630 | 175.2 |
| D | 7 | 70 | 277957 | 1543.96 | 633 | 606 | 179.6 |
| D | 2 | 249 | 212247 | 1178.16 | 633 | 606 | 179.6 |
| D | 2 | 120 | 204348 | 1134.19 | 633 | 606 | 179.6 |
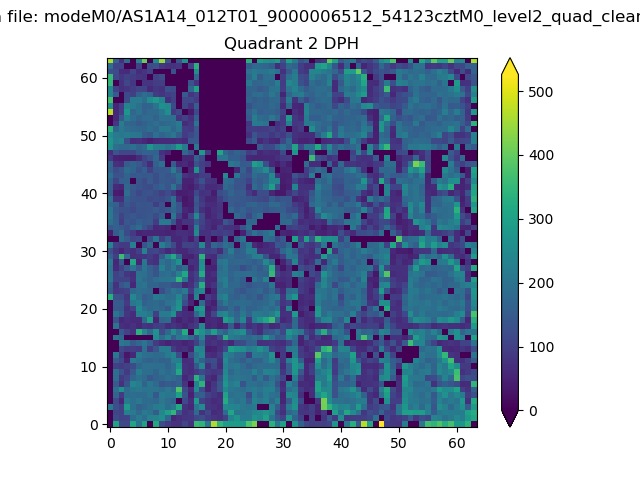
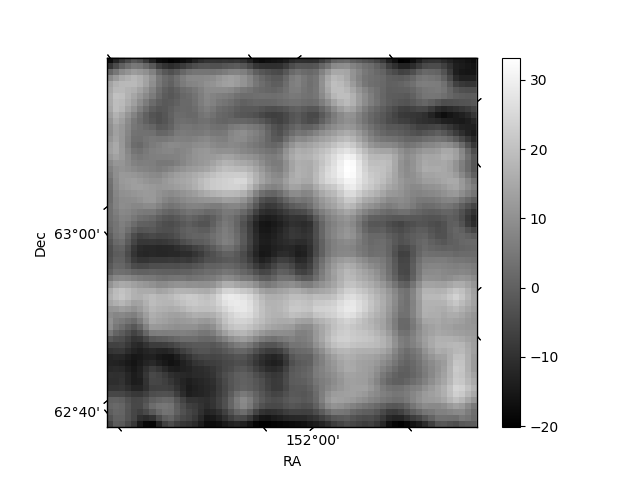
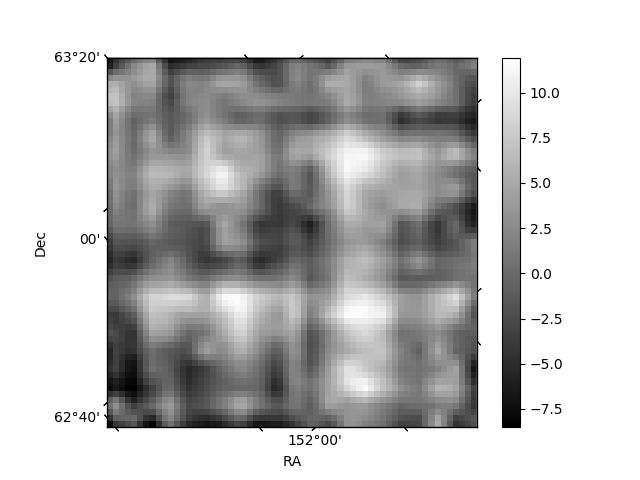
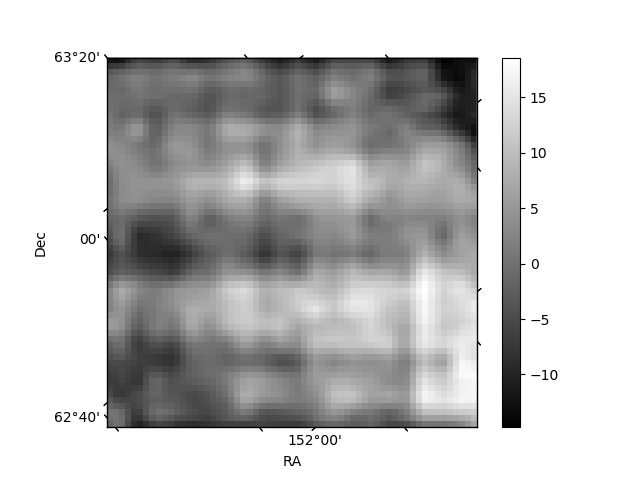
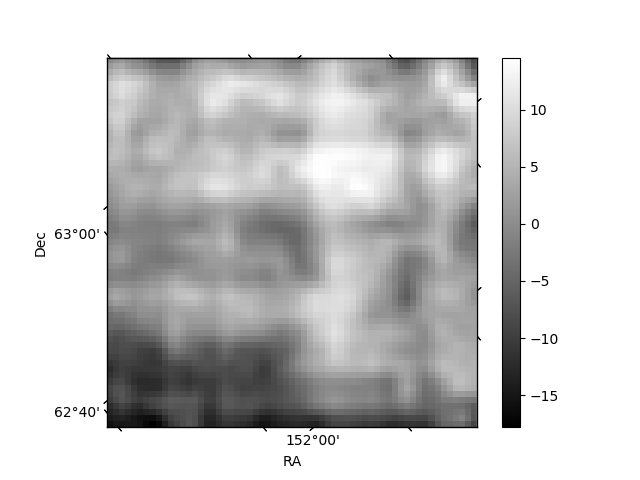
Histogram calculated using DETX and DETY for each event in the final _common_clean file
| Quadrant A | 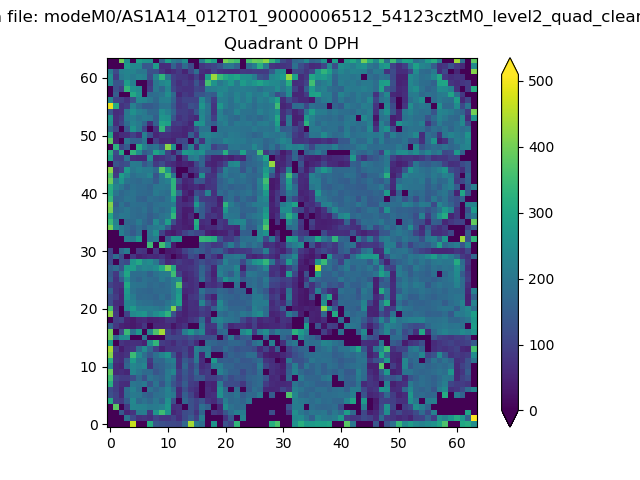 |
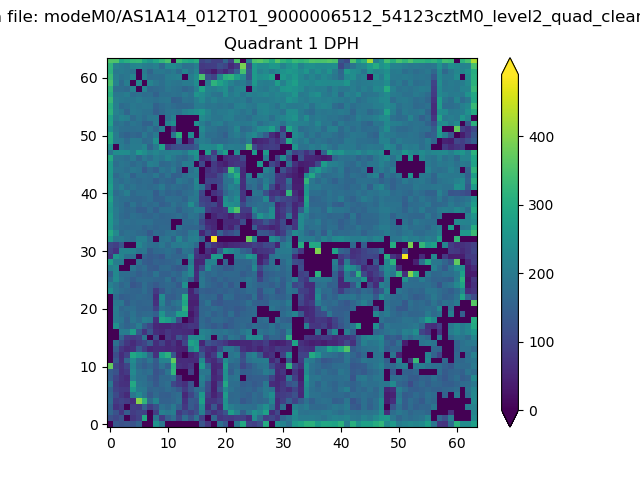 |
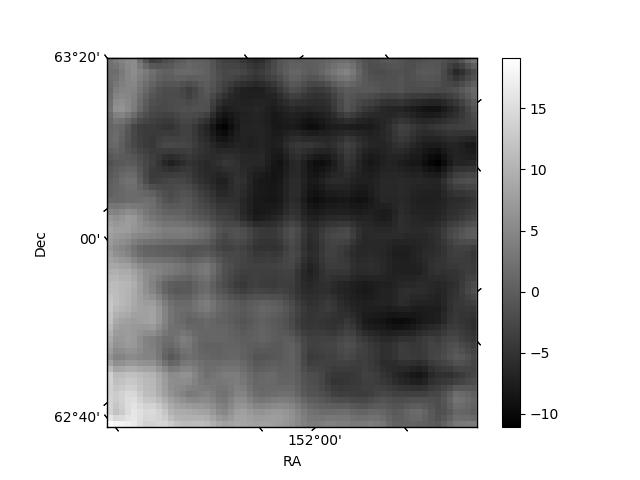
Quadrant B |
|---|---|---|---|
| Quadrant D | 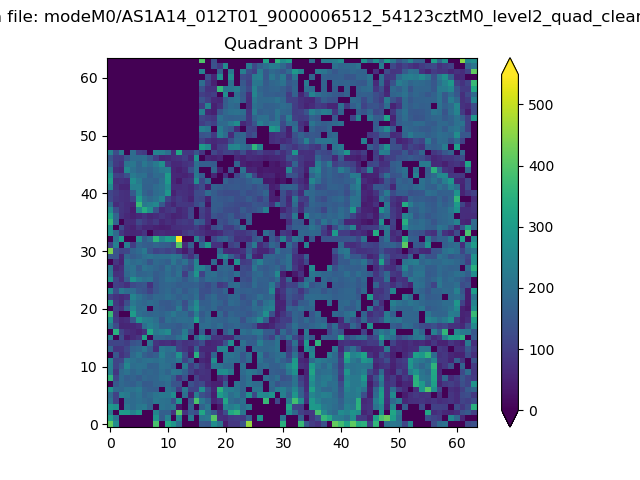 |
 |
Quadrant C |
| Plot type | Count rate plots | Images |
|---|---|---|
| Comparison with Poisson distribution Blue bars denote a histogram of data divided into 1 sec bins. Red curve is a Poisson curve with rate = median count rate of data. |
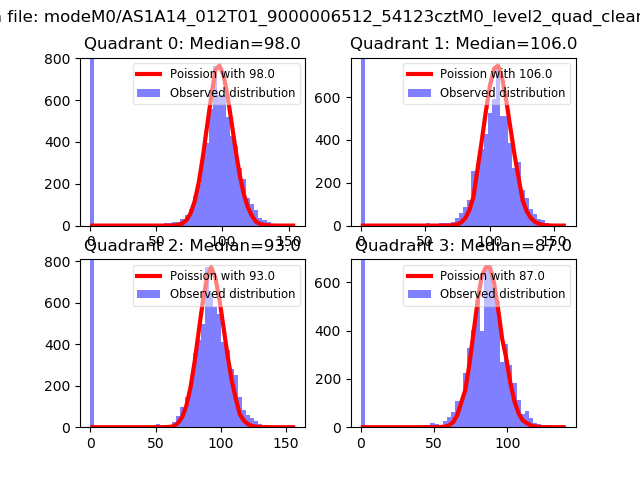 |
 |
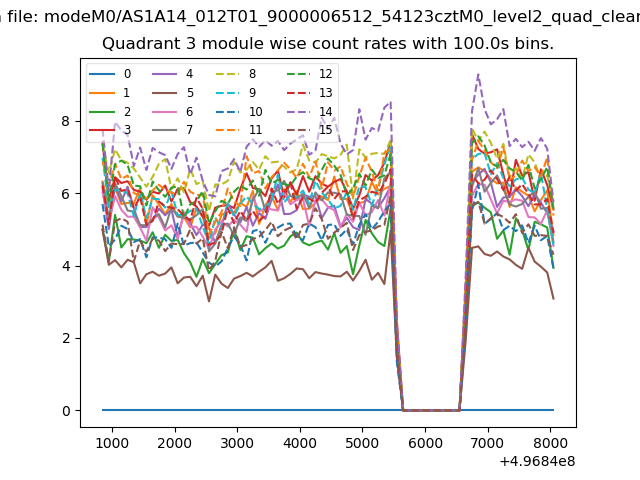
| Quadrant-wise count rates Data is divided into 100 sec bins |
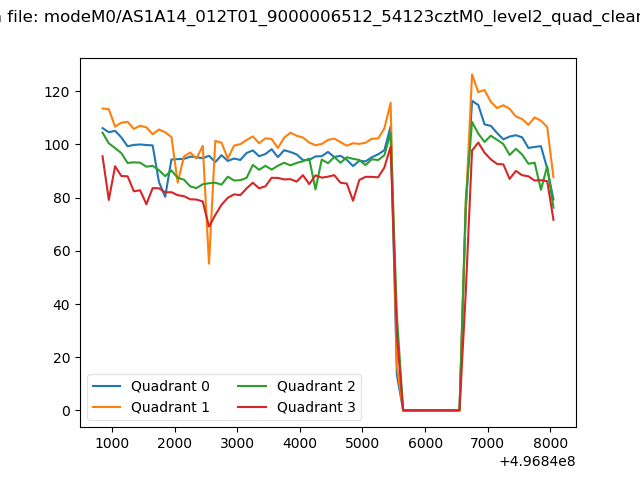 |
|
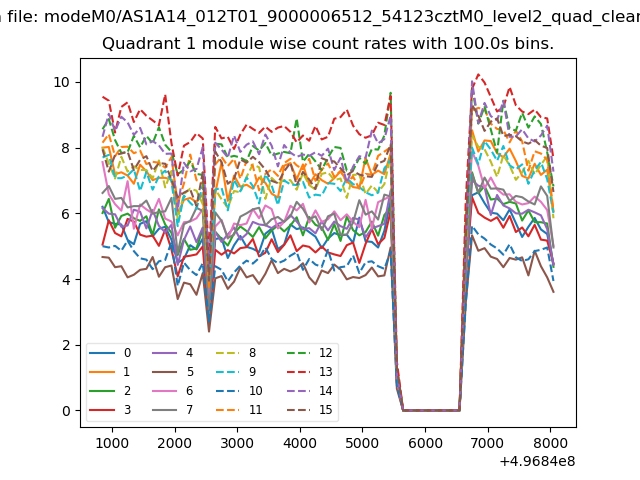
| Module-wise count rates for Quadrant A Data is divided into 100 sec bins |
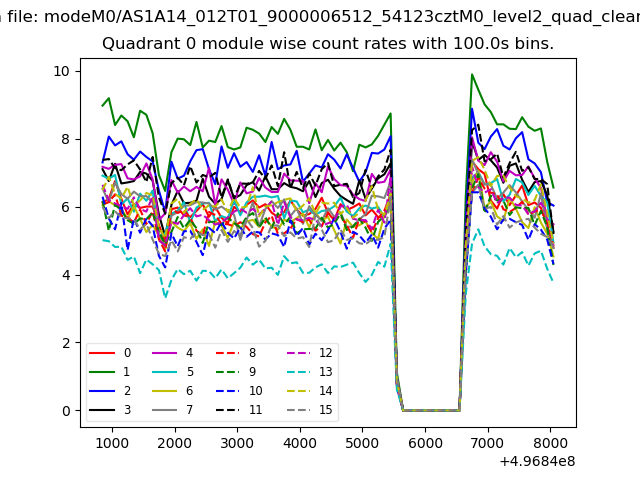 |
 |
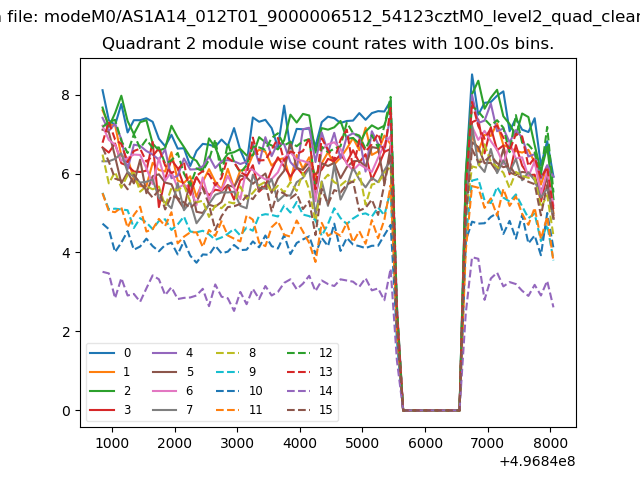
| Module-wise count rates for Quadrant B Data is divided into 100 sec bins |
 |
 |
| Module-wise count rates for Quadrant C Data is divided into 100 sec bins |
 |
 |
| Module-wise count rates for Quadrant D Data is divided into 100 sec bins |
 |
 |
| Parameter | Plot |
|---|---|
| CZT HV Monitor | 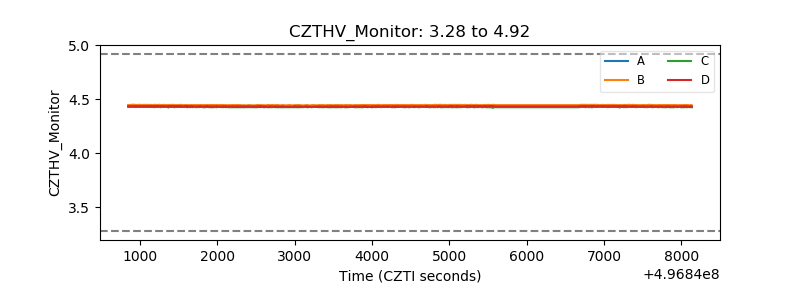 |
| D_VDD | 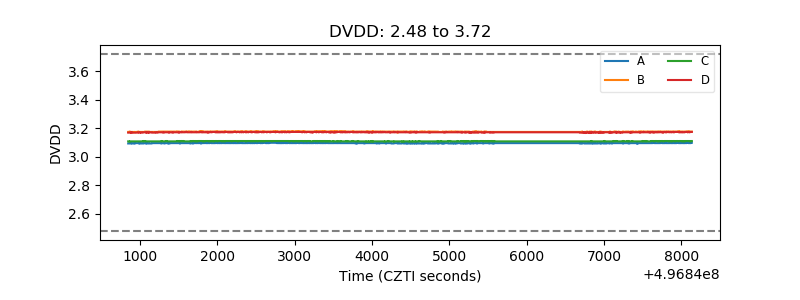 |
| Temperature 1 | 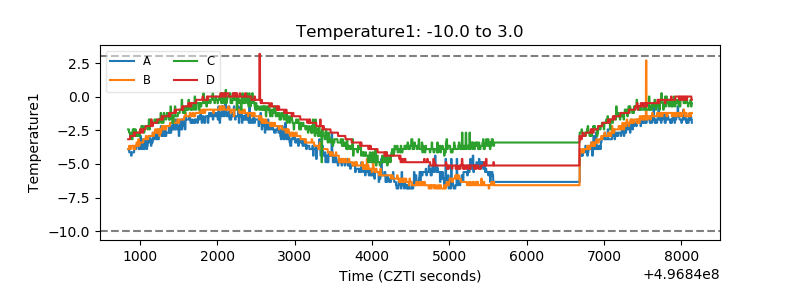 |
| Veto HV Monitor | 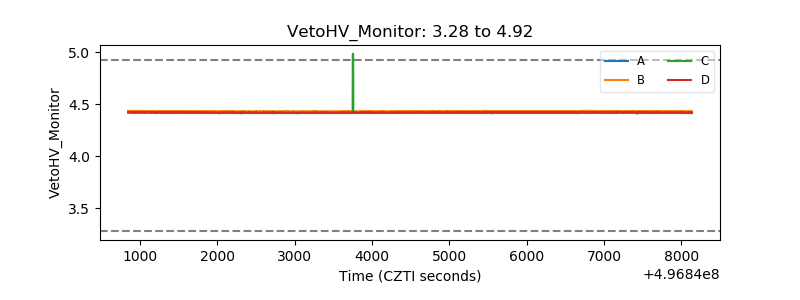 |
| Veto LLD | 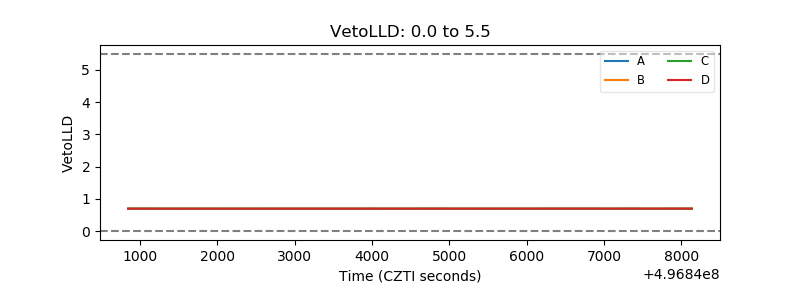 |
| Alpha Counter | 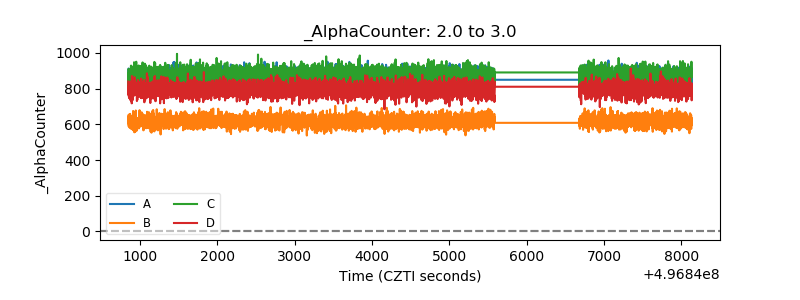 |
| _CPM_Rate | 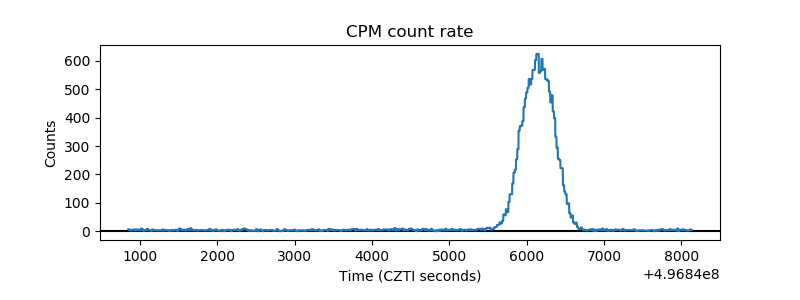 |
| CZT Counter | 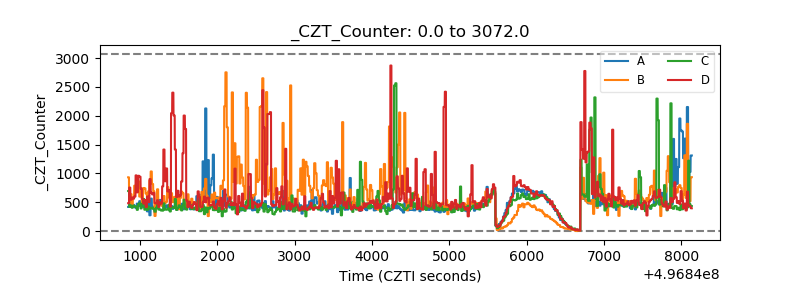 |
| +2.5 Volts monitor | 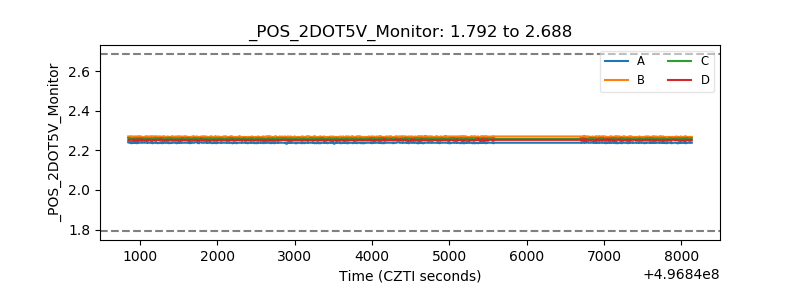 |
| +5 Volts monitor | 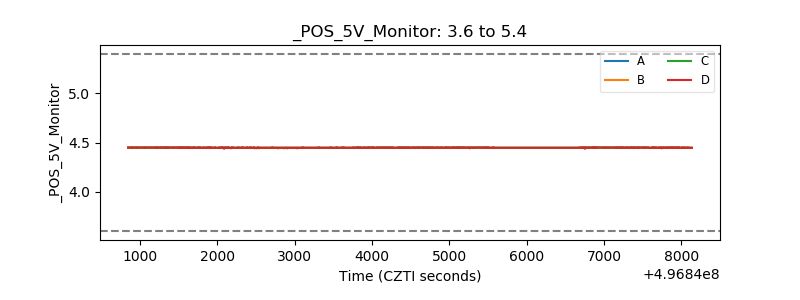 |
| _ROLL_ROT | 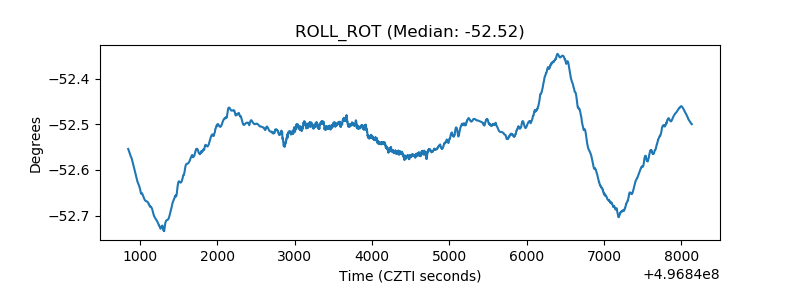 |
| _Roll_DEC | 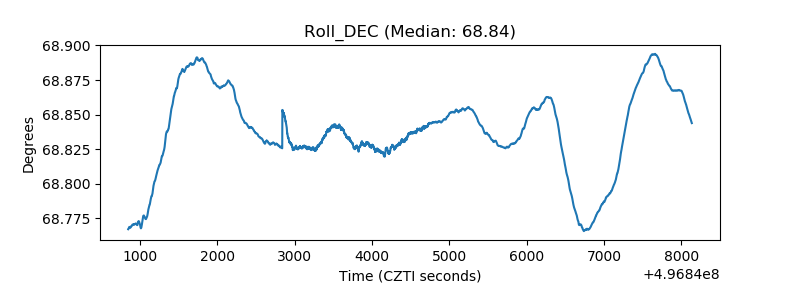 |
| _Roll_RA | 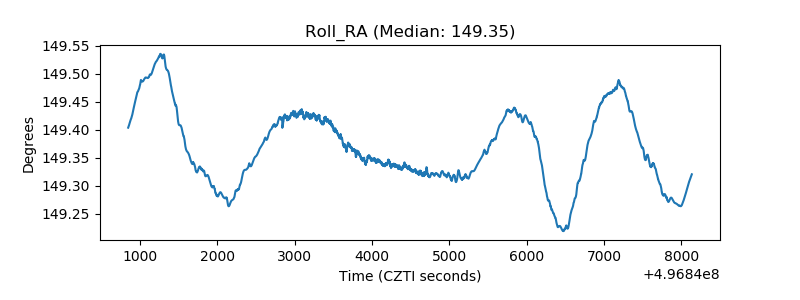 |
| Veto Counter | 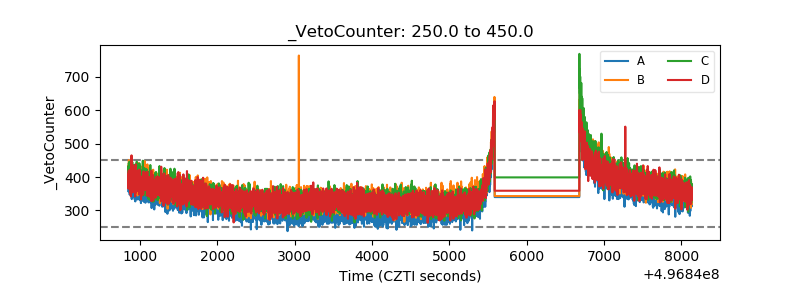 |