| Param | Original file | Final file |
|---|---|---|
| Filename | modeM0/AS1A14_012T01_9000006512_54126cztM0_level2.fits | modeM0/AS1A14_012T01_9000006512_54126cztM0_level2_quad_clean.evt |
| Size (bytes) | 599,518,080 | 86,207,040 |
| Size | 571.7 MB | 82.2 MB |
| Events in quadrant A | 2,860,742 | 619,490 |
| Events in quadrant B | 3,799,315 | 652,855 |
| Events in quadrant C | 3,159,689 | 590,841 |
| Events in quadrant D | 11,864,154 | 290,864 |
| Mode SS | |||
|---|---|---|---|
| Quadrant | BADHDUFLAG | Total packets | Discarded packets |
| A | 0 | 134 | 0 |
| B | 0 | 134 | 0 |
| C | 0 | 134 | 0 |
| D | 0 | 134 | 0 |
| Mode M0 | |||
|---|---|---|---|
| Quadrant | BADHDUFLAG | Total packets | Discarded packets |
| A | 0 | 13557 | 1 |
| B | 0 | 15909 | 2 |
| C | 0 | 14513 | 1 |
| D | 0 | 39685 | 1 |
| Mode M9 | |||
|---|---|---|---|
| Quadrant | BADHDUFLAG | Total packets | Discarded packets |
| A | 0 | 9 | 0 |
| B | 0 | 9 | 0 |
| C | 0 | 9 | 0 |
| D | 0 | 9 | 0 |
| Quadrant | Total seconds | Saturated seconds | Saturation percentage |
|---|---|---|---|
| A | 6535 | 88 | 1.346595% |
| B | 6535 | 299 | 4.575363% |
| C | 6535 | 191 | 2.922724% |
| D | 6535 | 3371 | 51.583780% |
Noise dominated data is calculated using 1-second bins in cleaned event files. If a bin has >2000 counts, and if more than 50% of those come from <1% of pixels, then it is considered to be noise-dominated and hence unusable.
| Quadrant | # 1 sec bins | Bins with >0 counts | Bins with >2000 counts | High rate bins dominated by noise | Noise dominated (total time) | Noise dominated (detector-on time) | Marked lightcurve |
|---|---|---|---|---|---|---|---|
| A | 7425 | 6535 | 12 | 12 | 0.16% | 0.18% | 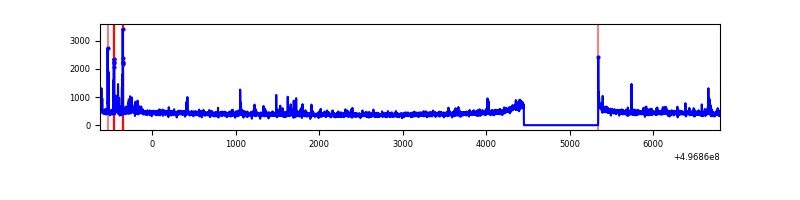 |
| B | 7425 | 6535 | 169 | 169 | 2.28% | 2.59% | 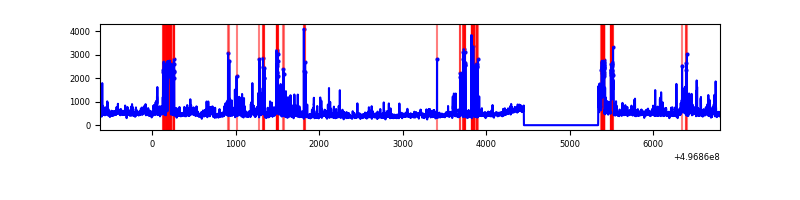 |
| C | 7425 | 6535 | 108 | 108 | 1.45% | 1.65% | 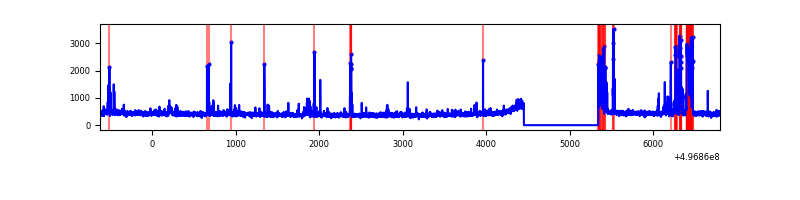 |
| D | 7424 | 6534 | 3284 | 3284 | 44.23% | 50.26% | 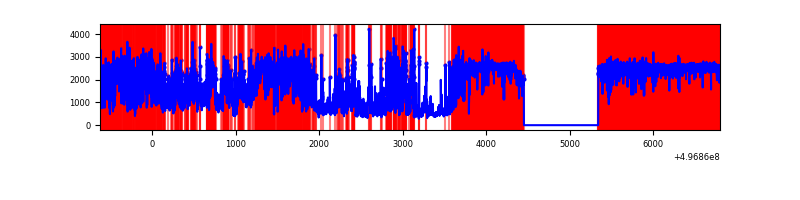 |
Top three noisy pixels from each quadrant. If the there are fewer than three noisy pixels in the level2.evt file, extra rows are filled as -1
| Pixel properties | Quadrant properties | ||||||
|---|---|---|---|---|---|---|---|
| Quadrant | DetID | PixID | Counts | Sigma | Mean | Median | Sigma |
| A | 15 | 174 | 79873 | 462.92 | 692 | 674 | 171.1 |
| A | 3 | 14 | 22179 | 125.69 | 692 | 674 | 171.1 |
| A | 4 | 3 | 21075 | 119.24 | 692 | 674 | 171.1 |
| B | 5 | 236 | 301573 | 2083.69 | 676 | 652 | 144.4 |
| B | 5 | 185 | 196730 | 1357.72 | 676 | 652 | 144.4 |
| B | 15 | 20 | 130851 | 901.55 | 676 | 652 | 144.4 |
| C | 1 | 241 | 378908 | 2058.74 | 674 | 667 | 183.7 |
| C | 12 | 252 | 34119 | 182.08 | 674 | 667 | 183.7 |
| C | 15 | 233 | 33928 | 181.04 | 674 | 667 | 183.7 |
| D | 7 | 70 | 6964099 | 50264.3 | 482 | 458 | 138.5 |
| D | 8 | 176 | 1341800 | 9681.95 | 482 | 458 | 138.5 |
| D | 4 | 7 | 787239 | 5679.07 | 482 | 458 | 138.5 |
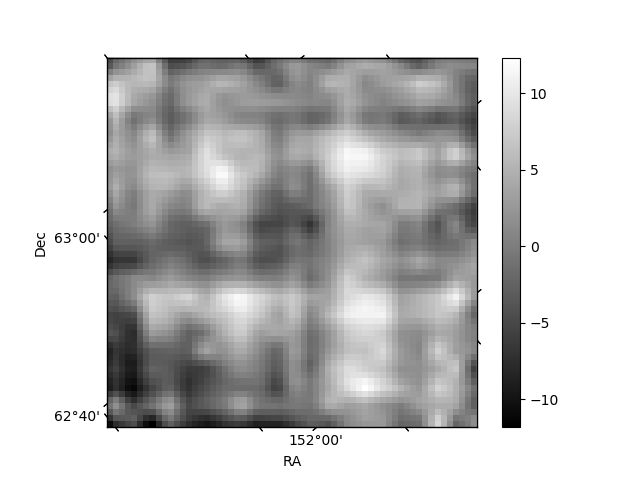
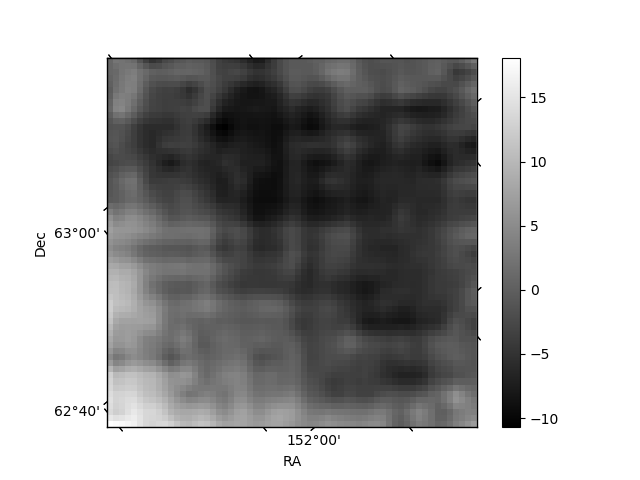
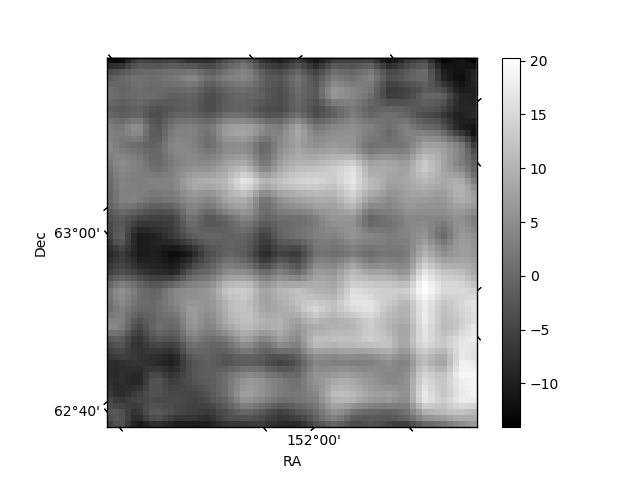
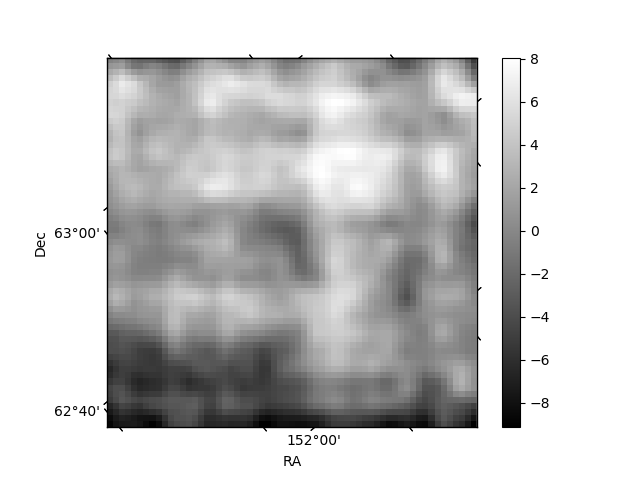
Histogram calculated using DETX and DETY for each event in the final _common_clean file
| Quadrant A | 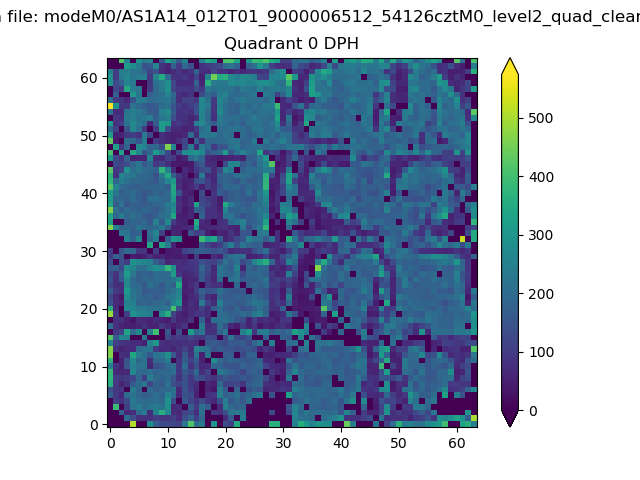 |
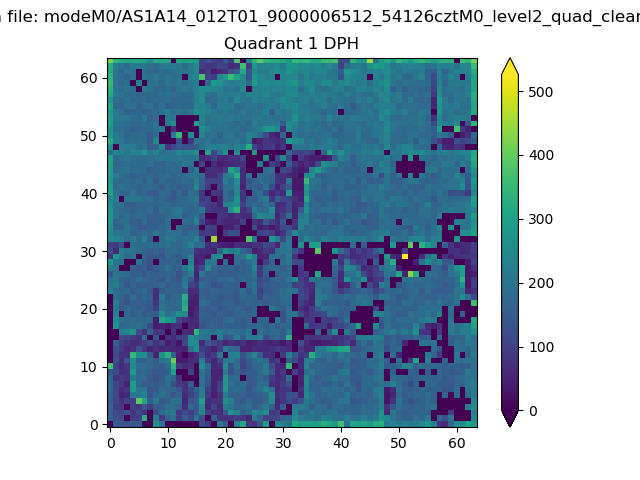 |
Quadrant B |
|---|---|---|---|
| Quadrant D | 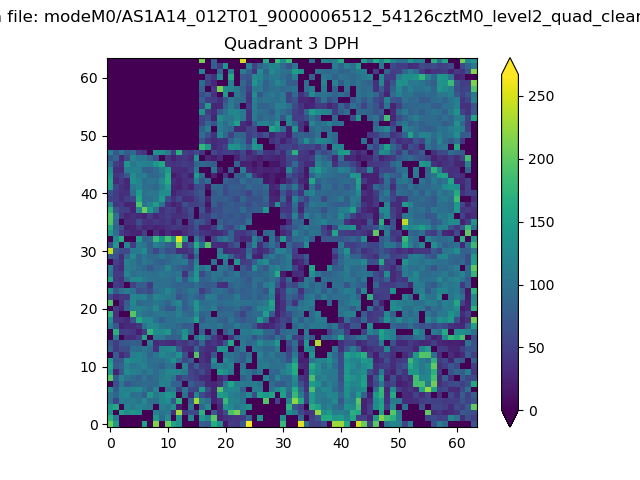 |
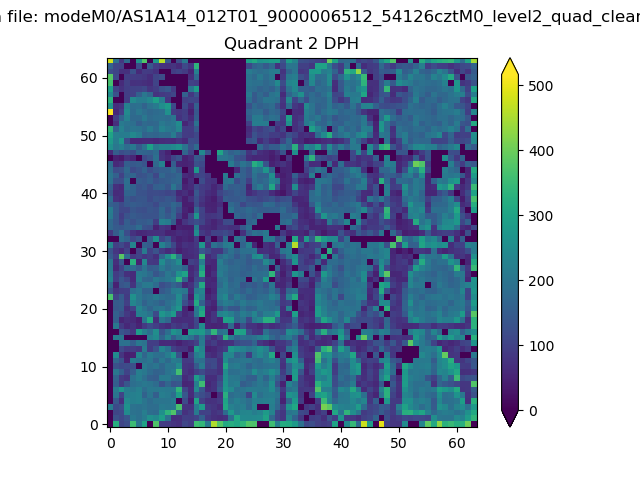 |
Quadrant C |
| Plot type | Count rate plots | Images |
|---|---|---|
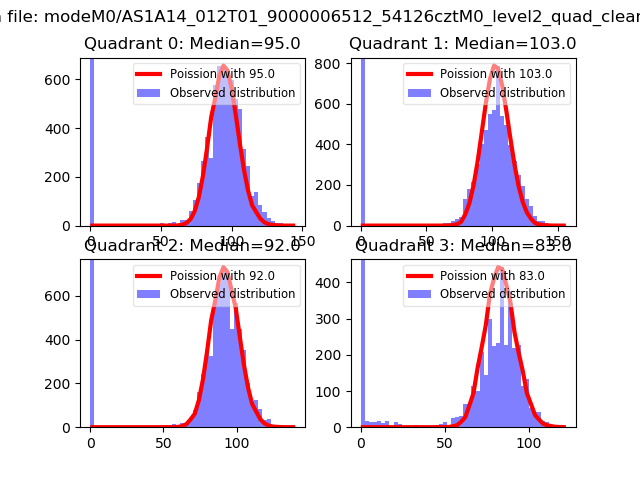
| Comparison with Poisson distribution Blue bars denote a histogram of data divided into 1 sec bins. Red curve is a Poisson curve with rate = median count rate of data. |
 |
 |
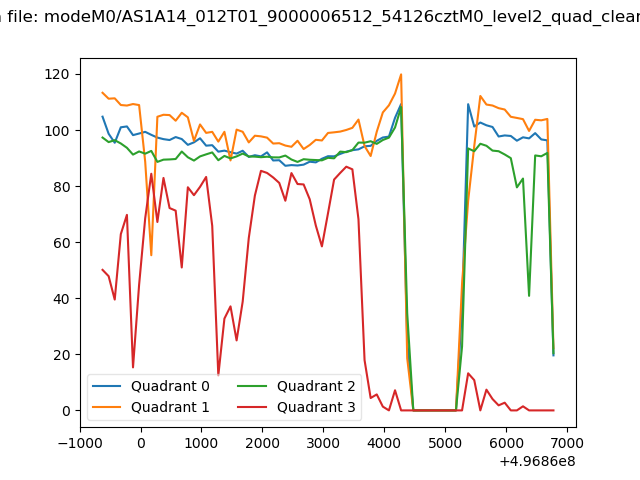
| Quadrant-wise count rates Data is divided into 100 sec bins |
 |
|
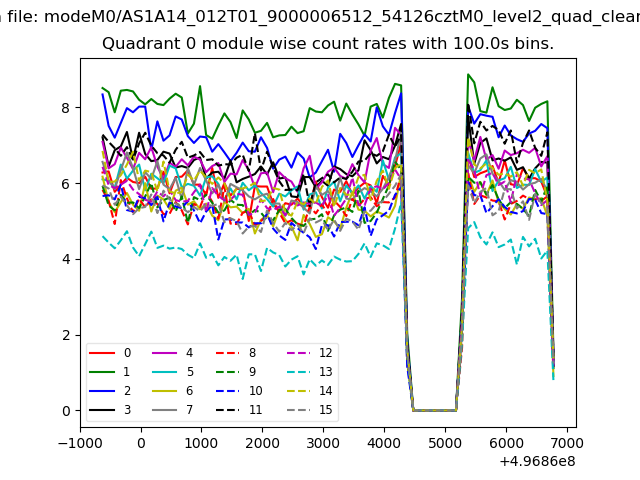
| Module-wise count rates for Quadrant A Data is divided into 100 sec bins |
 |
 |
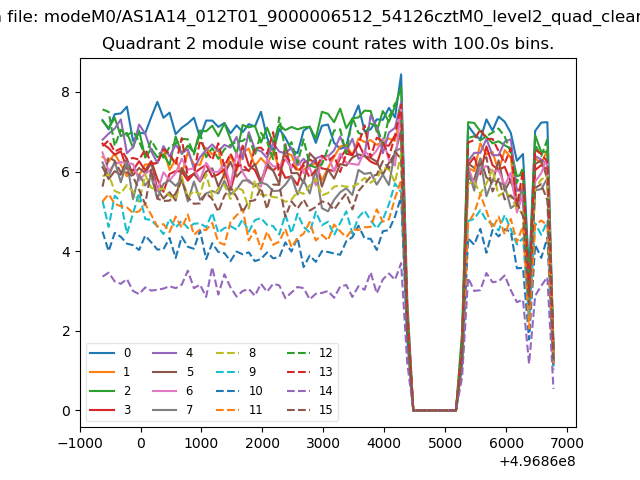
| Module-wise count rates for Quadrant B Data is divided into 100 sec bins |
 |
 |
| Module-wise count rates for Quadrant C Data is divided into 100 sec bins |
 |
 |
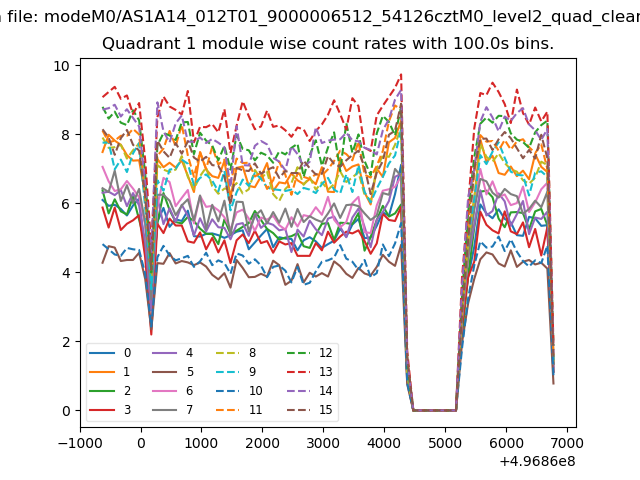
| Module-wise count rates for Quadrant D Data is divided into 100 sec bins |
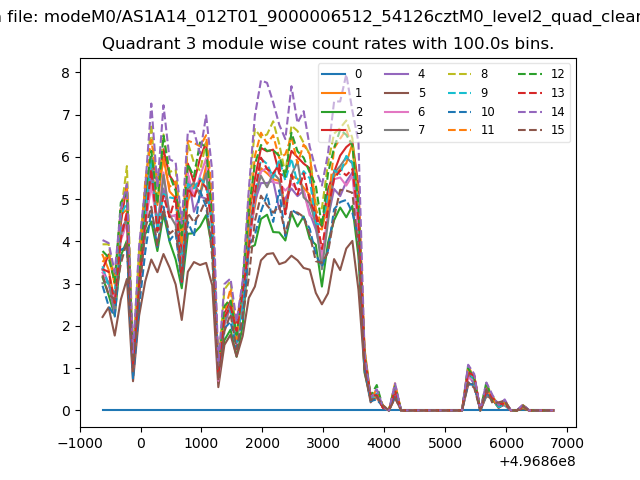 |
 |
| Parameter | Plot |
|---|---|
| CZT HV Monitor | 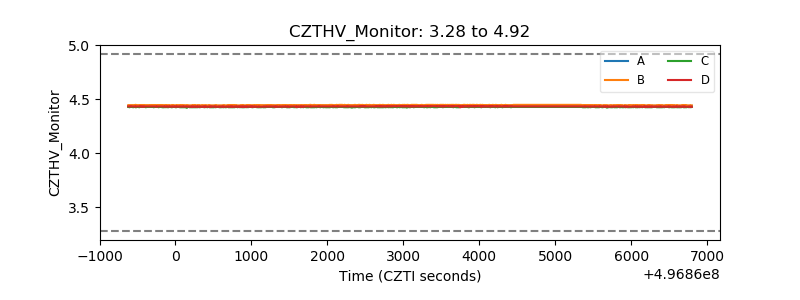 |
| D_VDD | 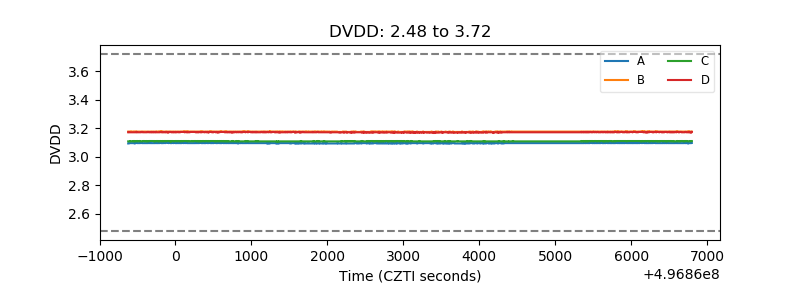 |
| Temperature 1 | 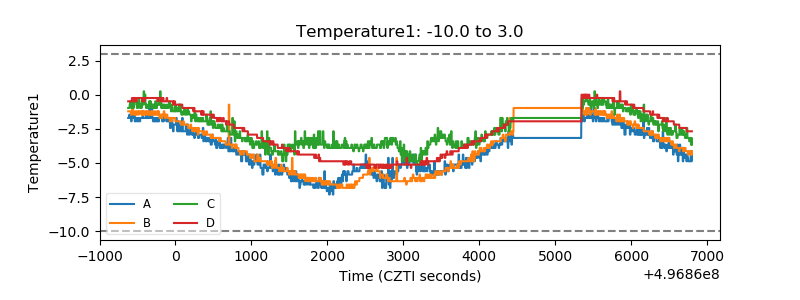 |
| Veto HV Monitor | 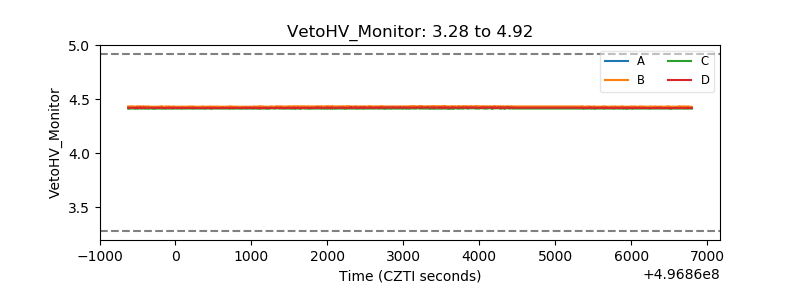 |
| Veto LLD | 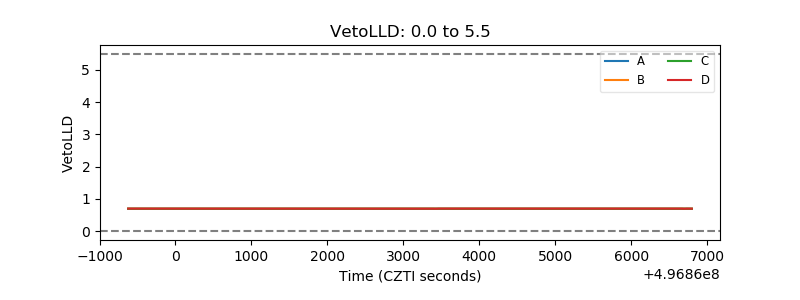 |
| Alpha Counter | 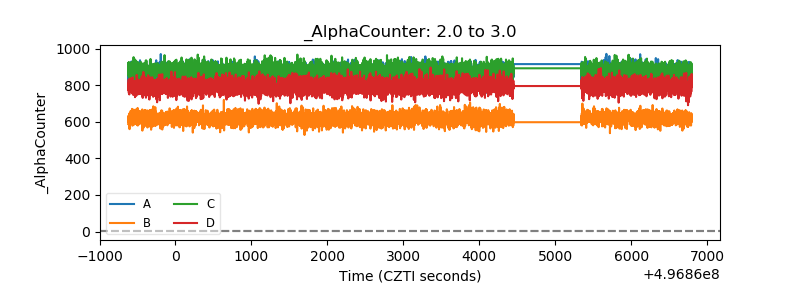 |
| _CPM_Rate | 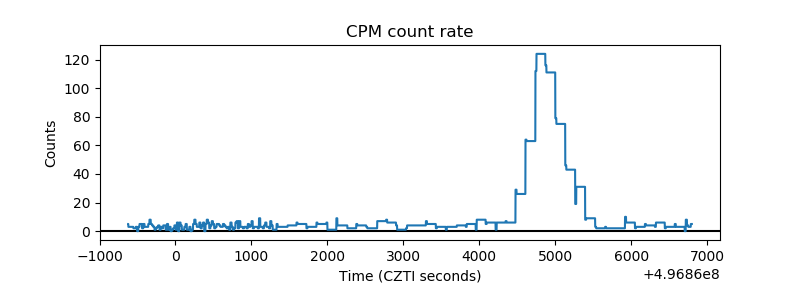 |
| CZT Counter | 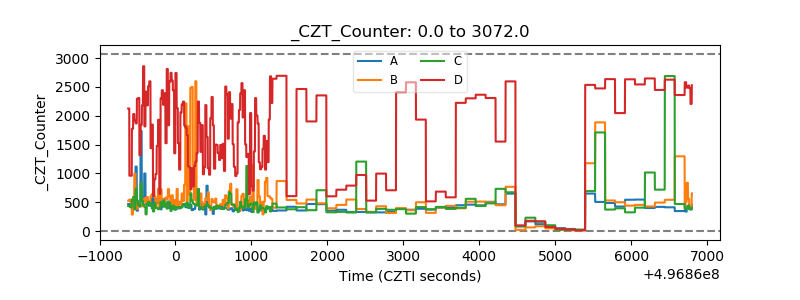 |
| +2.5 Volts monitor |  |
| +5 Volts monitor |  |
| _ROLL_ROT | 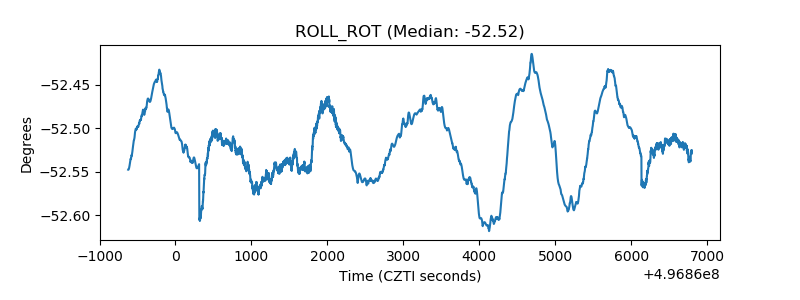 |
| _Roll_DEC | 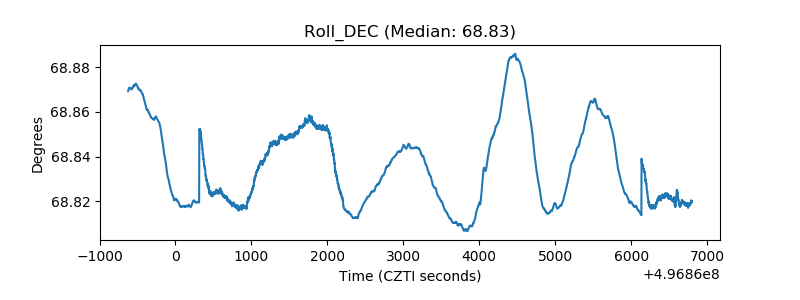 |
| _Roll_RA | 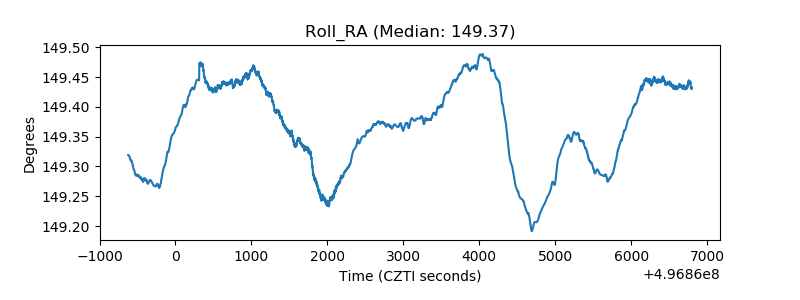 |
| Veto Counter | 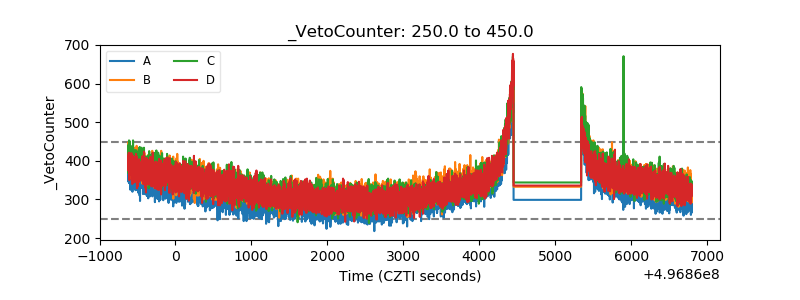 |