| Param | Original file | Final file |
|---|---|---|
| Filename | modeM0/AS1A14_012T01_9000006512_54127cztM0_level2.fits | modeM0/AS1A14_012T01_9000006512_54127cztM0_level2_quad_clean.evt |
| Size (bytes) | 746,003,520 | 91,906,560 |
| Size | 711.4 MB | 87.6 MB |
| Events in quadrant A | 3,484,664 | 692,568 |
| Events in quadrant B | 5,215,337 | 724,906 |
| Events in quadrant C | 3,915,361 | 650,390 |
| Events in quadrant D | 14,432,979 | 207,821 |
| Mode SS | |||
|---|---|---|---|
| Quadrant | BADHDUFLAG | Total packets | Discarded packets |
| A | 0 | 146 | 0 |
| B | 0 | 146 | 0 |
| C | 0 | 146 | 0 |
| D | 0 | 146 | 0 |
| Mode M0 | |||
|---|---|---|---|
| Quadrant | BADHDUFLAG | Total packets | Discarded packets |
| A | 0 | 15995 | 2 |
| B | 0 | 20617 | 2 |
| C | 0 | 17165 | 2 |
| D | 0 | 47845 | 2 |
| Mode M9 | |||
|---|---|---|---|
| Quadrant | BADHDUFLAG | Total packets | Discarded packets |
| A | 0 | 5 | 0 |
| B | 0 | 5 | 0 |
| C | 0 | 6 | 0 |
| D | 0 | 6 | 0 |
| Quadrant | Total seconds | Saturated seconds | Saturation percentage |
|---|---|---|---|
| A | 7287 | 121 | 1.660491% |
| B | 7286 | 393 | 5.393906% |
| C | 7286 | 260 | 3.568488% |
| D | 7286 | 5073 | 69.626681% |
Noise dominated data is calculated using 1-second bins in cleaned event files. If a bin has >2000 counts, and if more than 50% of those come from <1% of pixels, then it is considered to be noise-dominated and hence unusable.
| Quadrant | # 1 sec bins | Bins with >0 counts | Bins with >2000 counts | High rate bins dominated by noise | Noise dominated (total time) | Noise dominated (detector-on time) | Marked lightcurve |
|---|---|---|---|---|---|---|---|
| A | 7747 | 7289 | 37 | 37 | 0.48% | 0.51% | 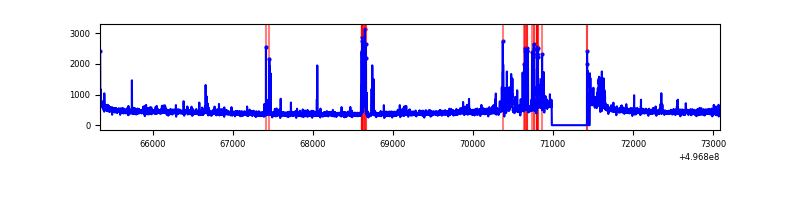 |
| B | 7746 | 7288 | 325 | 325 | 4.20% | 4.46% | 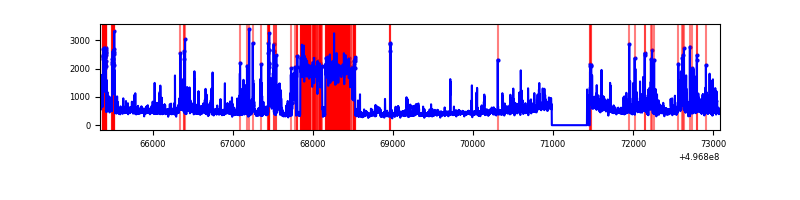 |
| C | 7746 | 7287 | 190 | 190 | 2.45% | 2.61% | 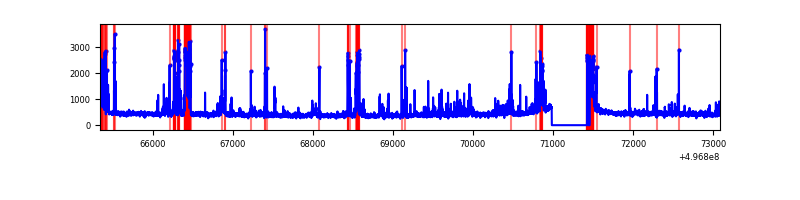 |
| D | 7746 | 7287 | 4819 | 4819 | 62.21% | 66.13% | 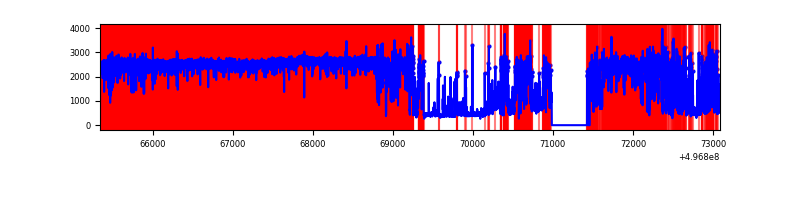 |
Top three noisy pixels from each quadrant. If the there are fewer than three noisy pixels in the level2.evt file, extra rows are filled as -1
| Pixel properties | Quadrant properties | ||||||
|---|---|---|---|---|---|---|---|
| Quadrant | DetID | PixID | Counts | Sigma | Mean | Median | Sigma |
| A | 0 | 8 | 249517 | 1282.44 | 776 | 755 | 194.0 |
| A | 15 | 174 | 108296 | 554.4 | 776 | 755 | 194.0 |
| A | 3 | 14 | 33876 | 170.75 | 776 | 755 | 194.0 |
| B | 5 | 236 | 1390182 | 8573.85 | 761 | 734 | 162.1 |
| B | 14 | 167 | 173371 | 1065.29 | 761 | 734 | 162.1 |
| B | 0 | 213 | 105624 | 647.24 | 761 | 734 | 162.1 |
| C | 1 | 241 | 748159 | 3653.32 | 749 | 741 | 204.6 |
| C | 12 | 252 | 60988 | 294.48 | 749 | 741 | 204.6 |
| C | 9 | 38 | 34337 | 164.21 | 749 | 741 | 204.6 |
| D | 7 | 70 | 8480274 | 68119.7 | 436 | 415 | 124.5 |
| D | 8 | 176 | 2876025 | 23100.11 | 436 | 415 | 124.5 |
| D | 14 | 52 | 304785 | 2445.04 | 436 | 415 | 124.5 |
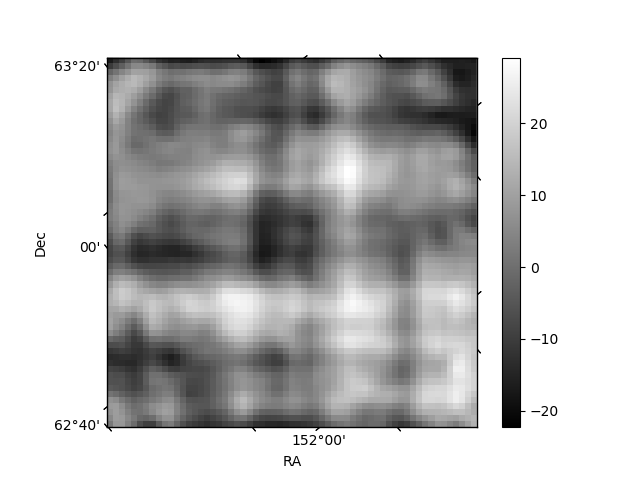
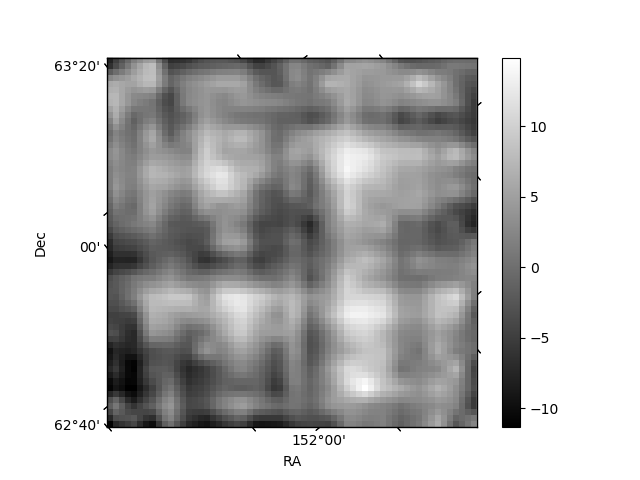
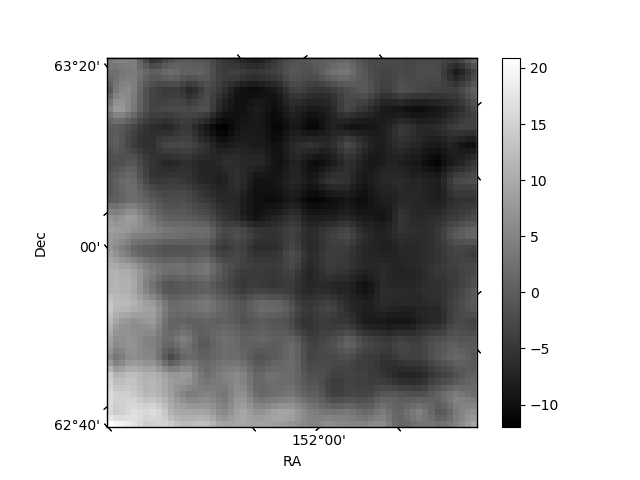
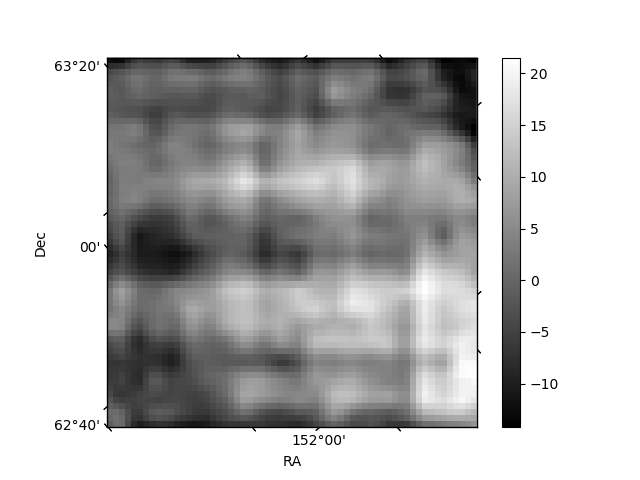
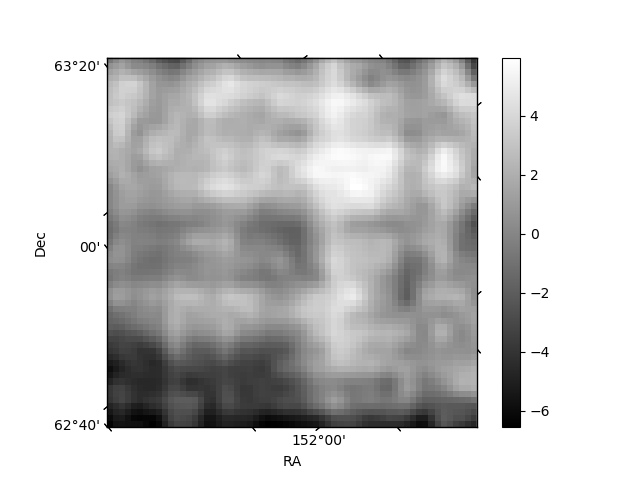
Histogram calculated using DETX and DETY for each event in the final _common_clean file
| Quadrant A | 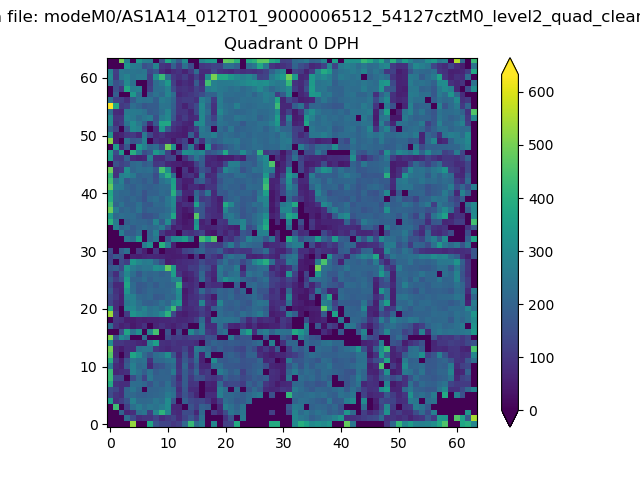 |
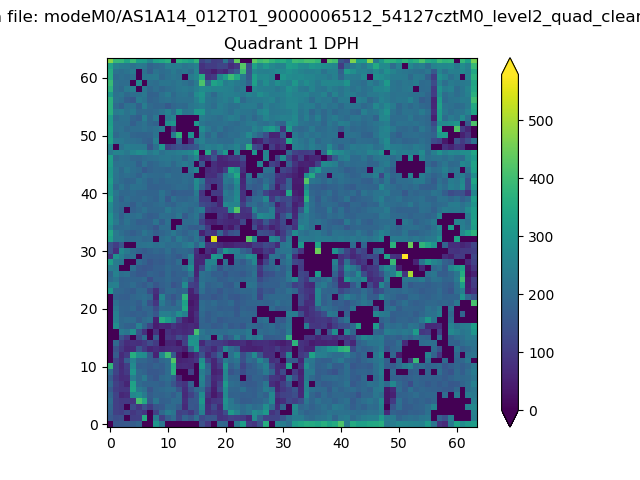 |
Quadrant B |
|---|---|---|---|
| Quadrant D | 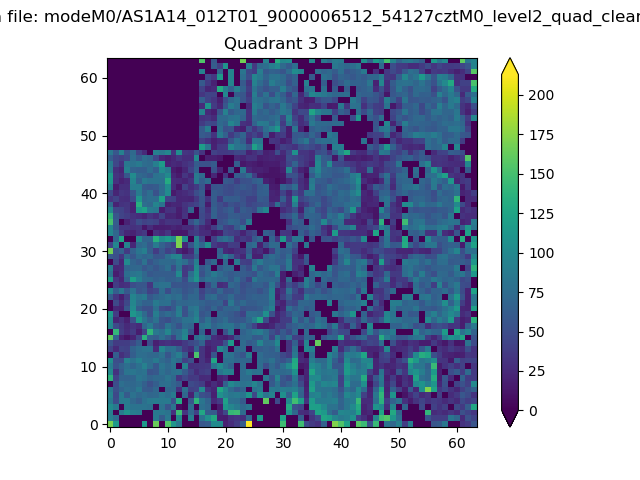 |
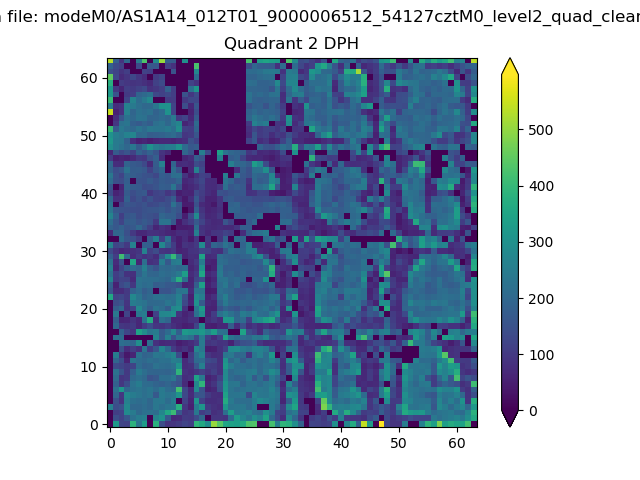 |
Quadrant C |
| Plot type | Count rate plots | Images |
|---|---|---|
| Comparison with Poisson distribution Blue bars denote a histogram of data divided into 1 sec bins. Red curve is a Poisson curve with rate = median count rate of data. |
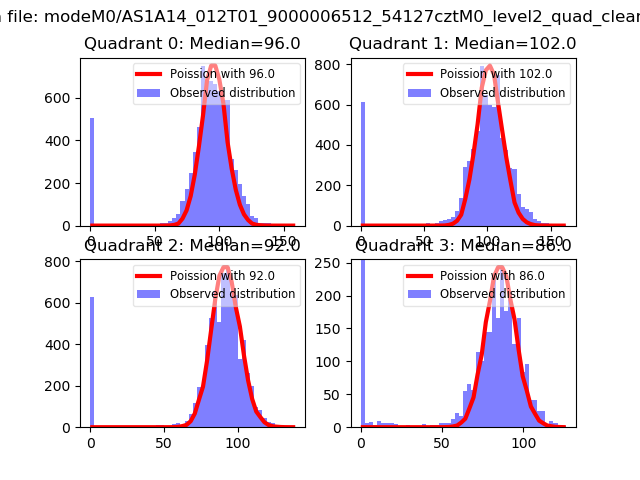 |
 |
| Quadrant-wise count rates Data is divided into 100 sec bins |
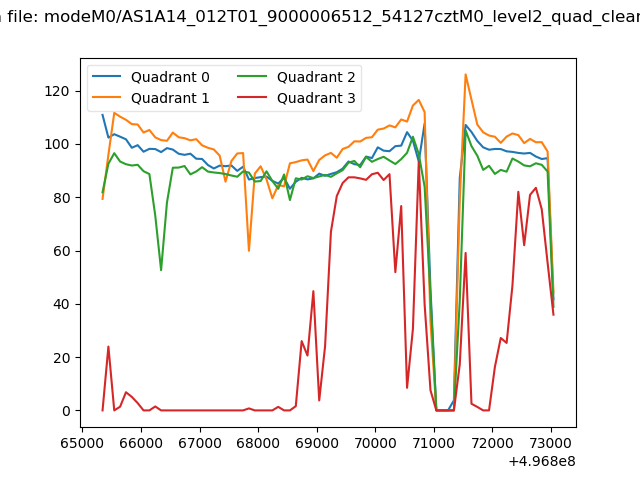 |
|
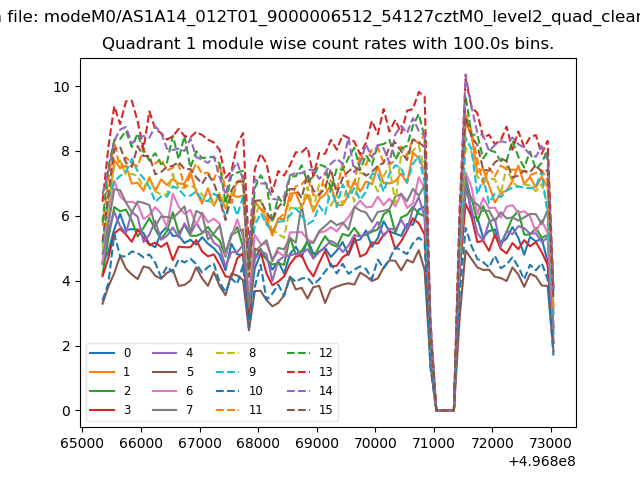
| Module-wise count rates for Quadrant A Data is divided into 100 sec bins |
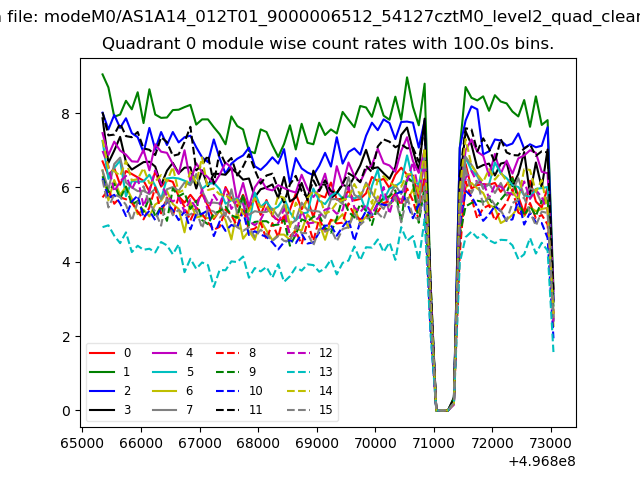 |
 |
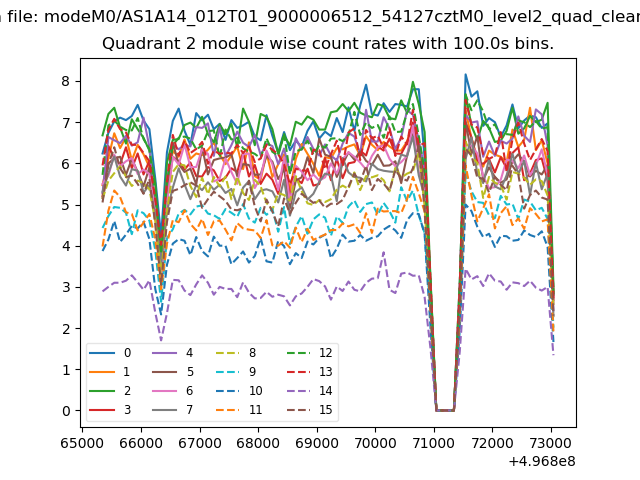
| Module-wise count rates for Quadrant B Data is divided into 100 sec bins |
 |
 |
| Module-wise count rates for Quadrant C Data is divided into 100 sec bins |
 |
 |
| Module-wise count rates for Quadrant D Data is divided into 100 sec bins |
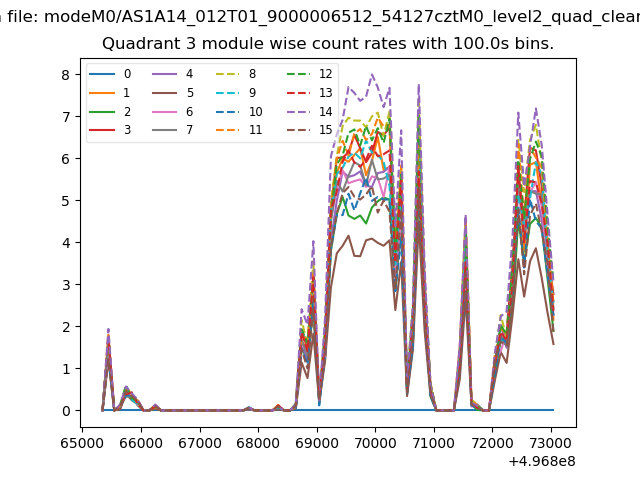 |
 |
| Parameter | Plot |
|---|---|
| CZT HV Monitor | 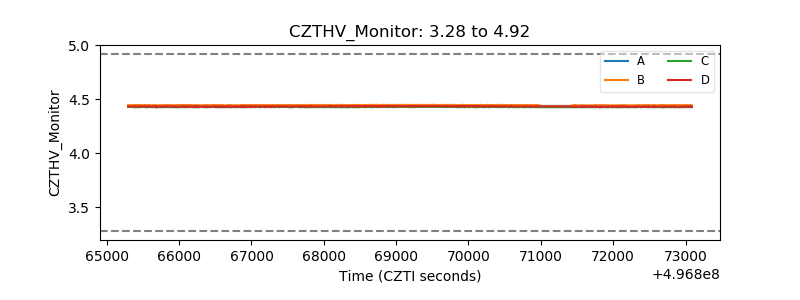 |
| D_VDD | 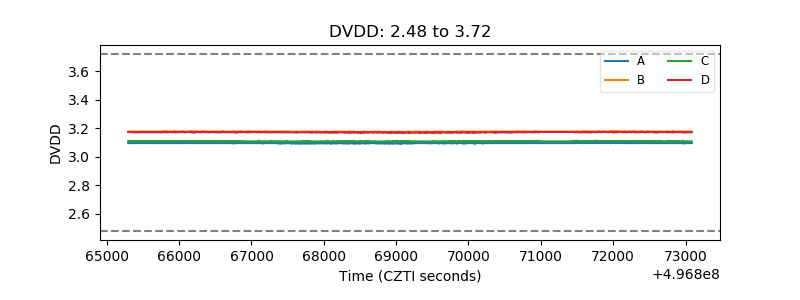 |
| Temperature 1 | 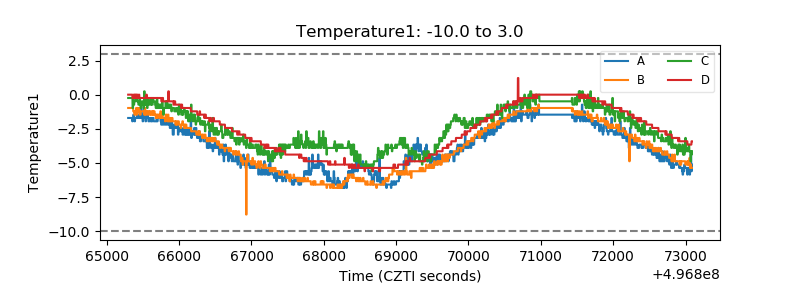 |
| Veto HV Monitor | 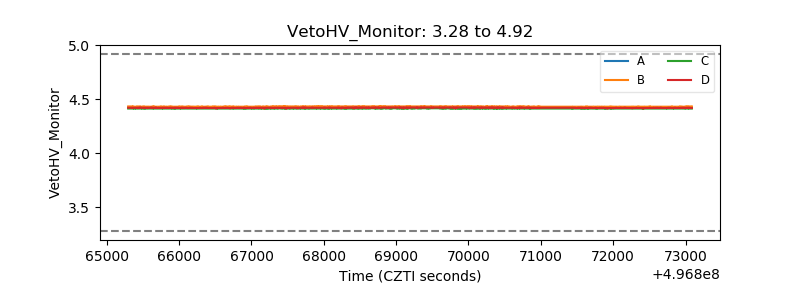 |
| Veto LLD | 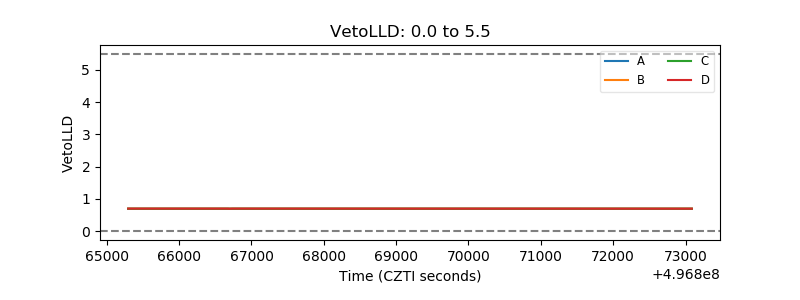 |
| Alpha Counter | 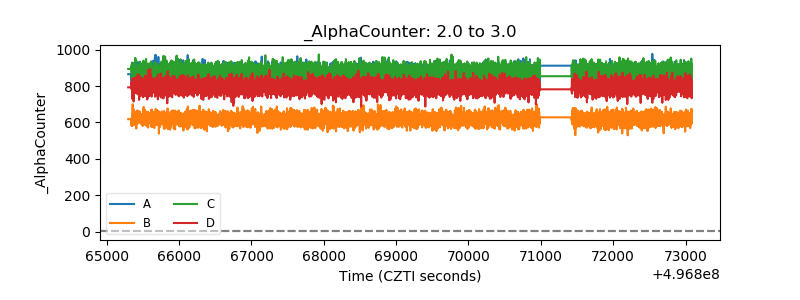 |
| _CPM_Rate | 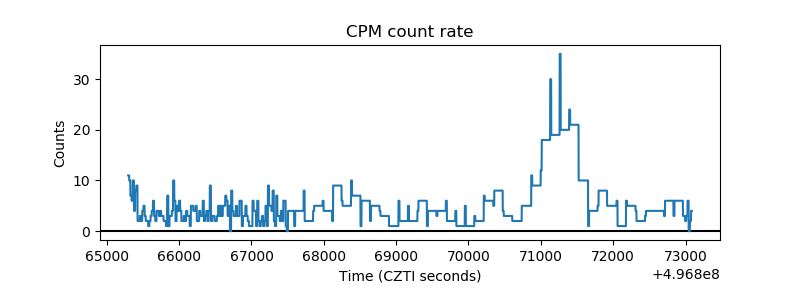 |
| CZT Counter | 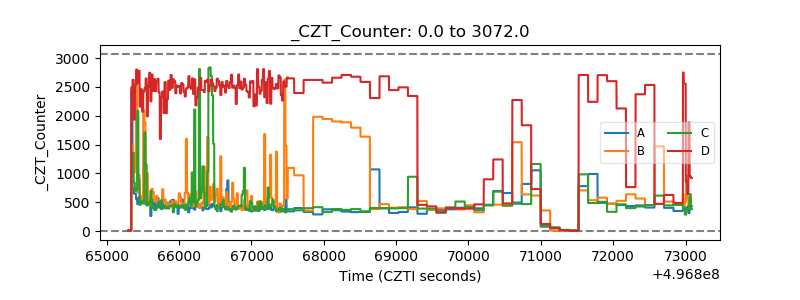 |
| +2.5 Volts monitor |  |
| +5 Volts monitor |  |
| _ROLL_ROT | 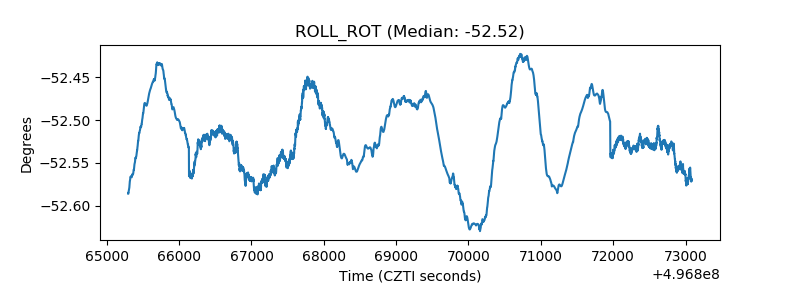 |
| _Roll_DEC | 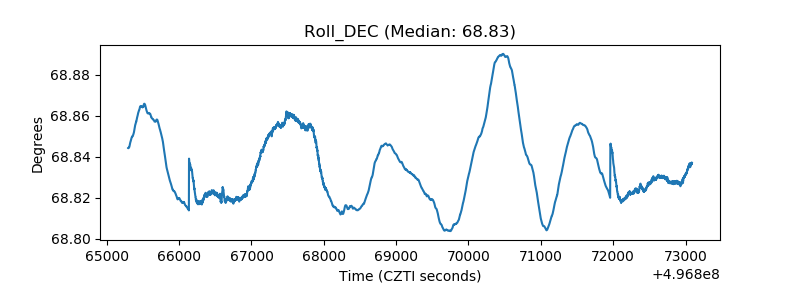 |
| _Roll_RA | 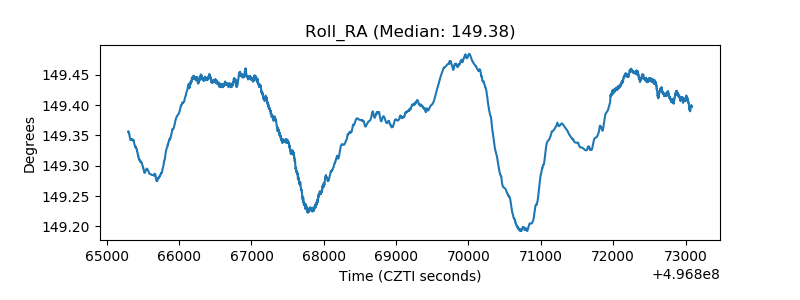 |
| Veto Counter | 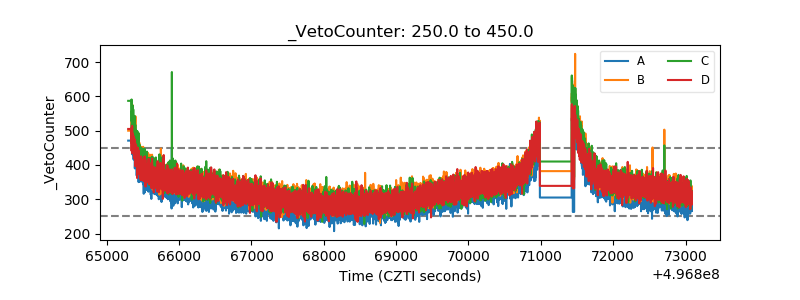 |