| Param | Original file | Final file |
|---|---|---|
| Filename | modeM0/AS1A14_012T01_9000006512_54128cztM0_level2.fits | modeM0/AS1A14_012T01_9000006512_54128cztM0_level2_quad_clean.evt |
| Size (bytes) | 603,777,600 | 97,922,880 |
| Size | 575.8 MB | 93.4 MB |
| Events in quadrant A | 3,698,773 | 670,250 |
| Events in quadrant B | 5,883,586 | 670,296 |
| Events in quadrant C | 3,593,383 | 631,902 |
| Events in quadrant D | 8,577,692 | 457,754 |
| Mode SS | |||
|---|---|---|---|
| Quadrant | BADHDUFLAG | Total packets | Discarded packets |
| A | 0 | 154 | 0 |
| B | 0 | 154 | 0 |
| C | 0 | 154 | 0 |
| D | 0 | 154 | 0 |
| Mode M0 | |||
|---|---|---|---|
| Quadrant | BADHDUFLAG | Total packets | Discarded packets |
| A | 0 | 16808 | 0 |
| B | 0 | 22918 | 0 |
| C | 0 | 16521 | 1 |
| D | 0 | 31145 | 0 |
| Quadrant | Total seconds | Saturated seconds | Saturation percentage |
|---|---|---|---|
| A | 7679 | 115 | 1.497591% |
| B | 7679 | 802 | 10.444068% |
| C | 7679 | 50 | 0.651126% |
| D | 7679 | 1840 | 23.961453% |
Noise dominated data is calculated using 1-second bins in cleaned event files. If a bin has >2000 counts, and if more than 50% of those come from <1% of pixels, then it is considered to be noise-dominated and hence unusable.
| Quadrant | # 1 sec bins | Bins with >0 counts | Bins with >2000 counts | High rate bins dominated by noise | Noise dominated (total time) | Noise dominated (detector-on time) | Marked lightcurve |
|---|---|---|---|---|---|---|---|
| A | 7957 | 7957 | 93 | 93 | 1.17% | 1.17% | 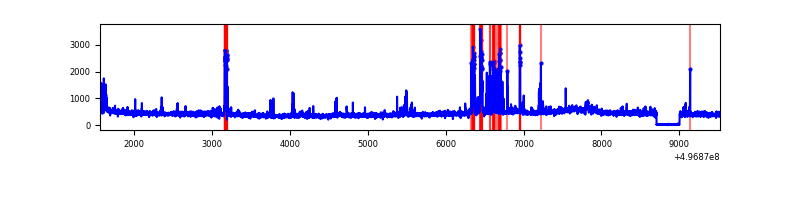 |
| B | 7957 | 7957 | 295 | 295 | 3.71% | 3.71% | 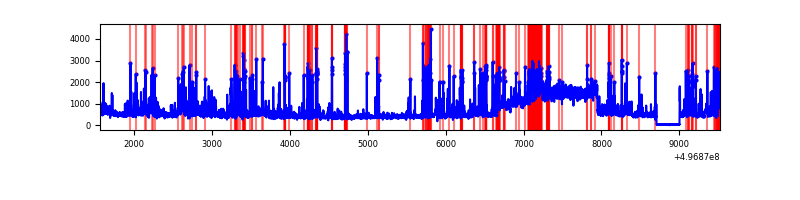 |
| C | 7957 | 7957 | 24 | 24 | 0.30% | 0.30% | 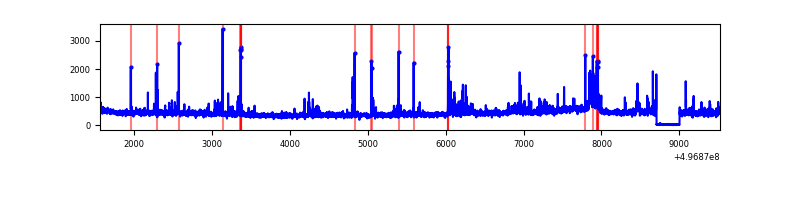 |
| D | 7957 | 7943 | 1696 | 1696 | 21.31% | 21.35% | 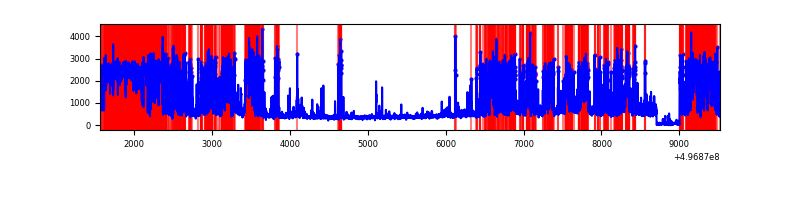 |
Top three noisy pixels from each quadrant. If the there are fewer than three noisy pixels in the level2.evt file, extra rows are filled as -1
| Pixel properties | Quadrant properties | ||||||
|---|---|---|---|---|---|---|---|
| Quadrant | DetID | PixID | Counts | Sigma | Mean | Median | Sigma |
| A | 15 | 174 | 339335 | 1666.36 | 813 | 792 | 203.2 |
| A | 0 | 8 | 64191 | 312.06 | 813 | 792 | 203.2 |
| A | 3 | 130 | 32929 | 158.18 | 813 | 792 | 203.2 |
| B | 5 | 172 | 1302393 | 7778.61 | 788 | 761 | 167.3 |
| B | 5 | 236 | 754544 | 4504.64 | 788 | 761 | 167.3 |
| B | 14 | 167 | 107350 | 636.98 | 788 | 761 | 167.3 |
| C | 1 | 241 | 121172 | 543.01 | 803 | 792 | 221.7 |
| C | 12 | 252 | 70876 | 316.13 | 803 | 792 | 221.7 |
| C | 4 | 5 | 67672 | 301.68 | 803 | 792 | 221.7 |
| D | 8 | 176 | 3999034 | 20023.14 | 702 | 671 | 199.7 |
| D | 14 | 52 | 327700 | 1637.71 | 702 | 671 | 199.7 |
| D | 3 | 224 | 259726 | 1297.3 | 702 | 671 | 199.7 |
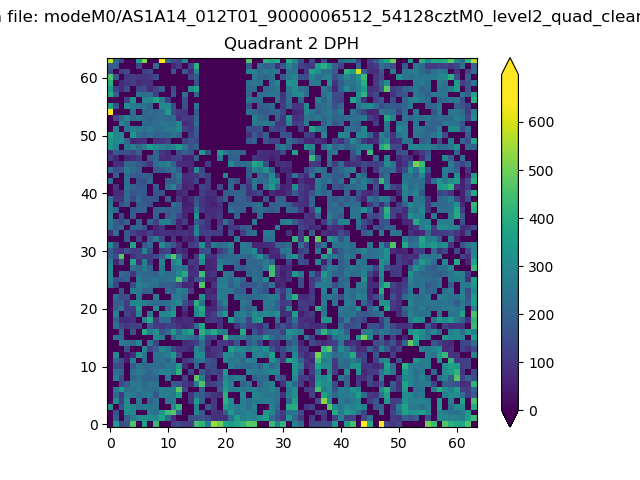
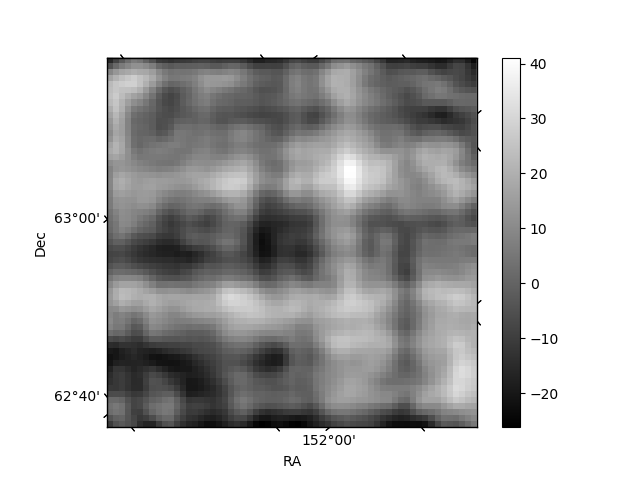
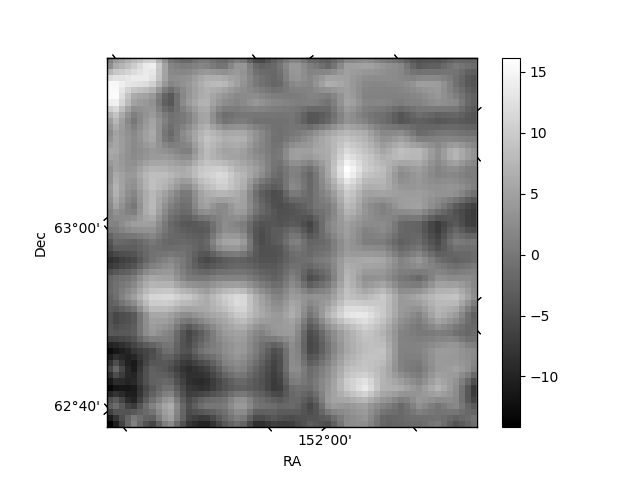
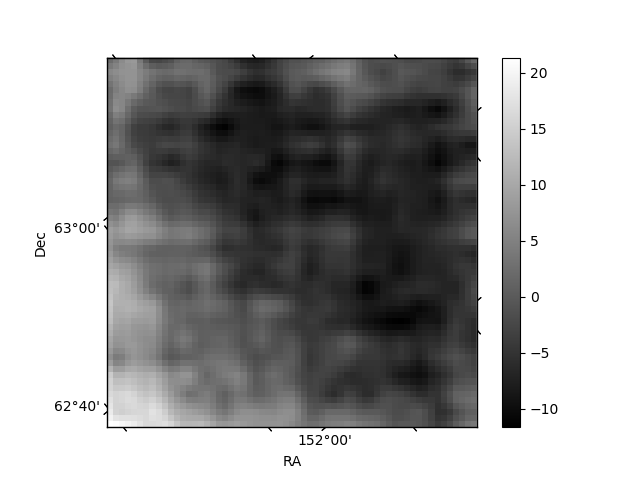
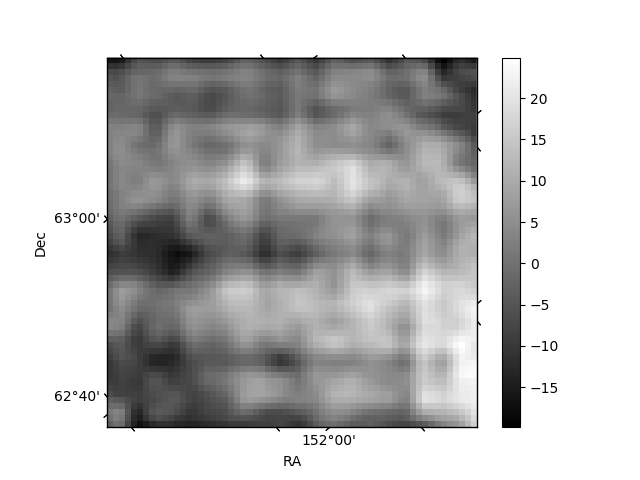
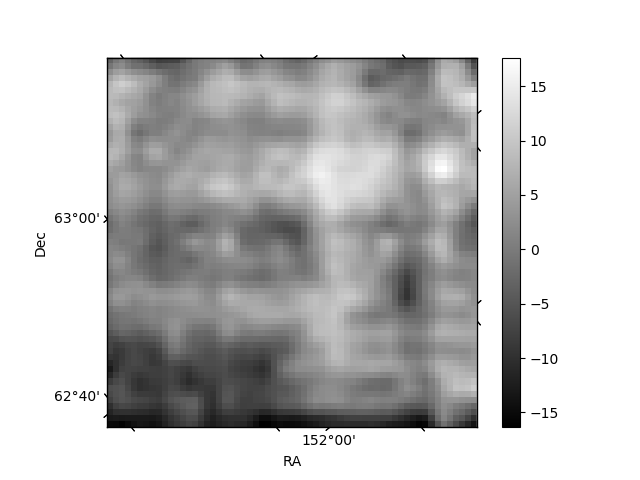
Histogram calculated using DETX and DETY for each event in the final _common_clean file
| Quadrant A | 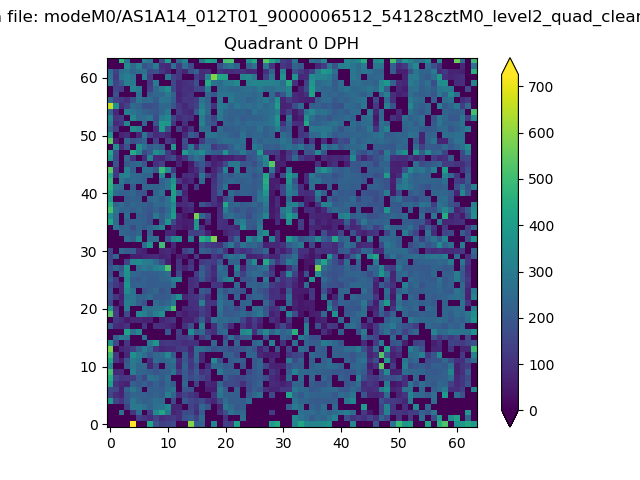 |
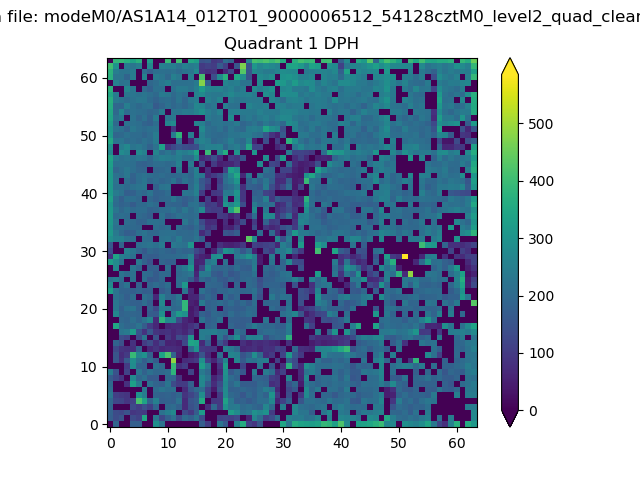 |
Quadrant B |
|---|---|---|---|
| Quadrant D | 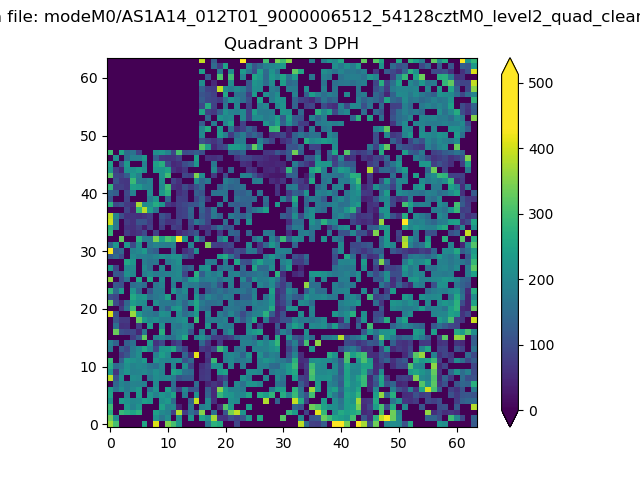 |
 |
Quadrant C |
| Plot type | Count rate plots | Images |
|---|---|---|
| Comparison with Poisson distribution Blue bars denote a histogram of data divided into 1 sec bins. Red curve is a Poisson curve with rate = median count rate of data. |
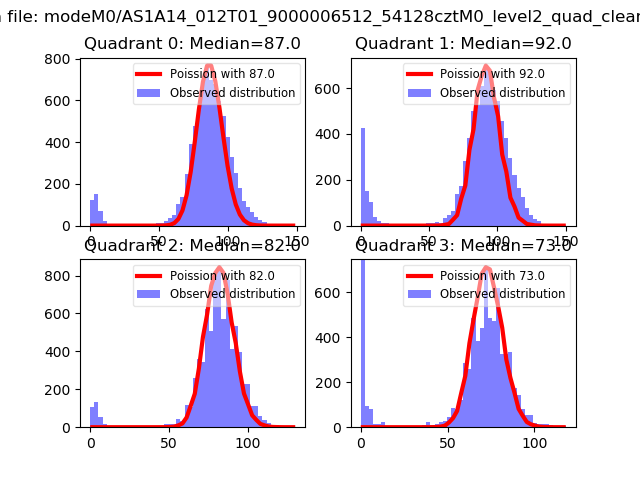 |
 |
| Quadrant-wise count rates Data is divided into 100 sec bins |
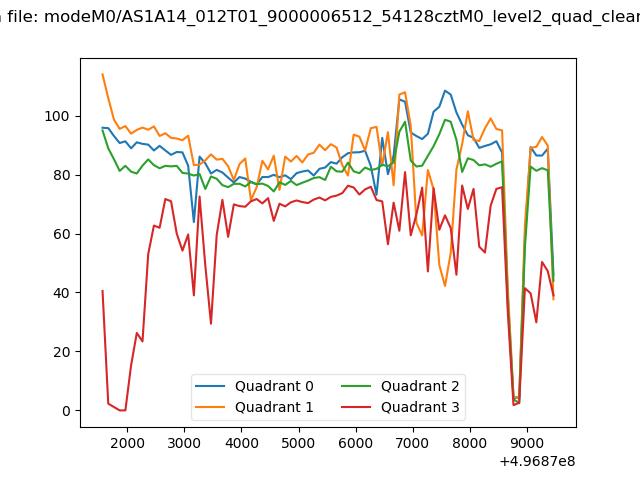 |
|
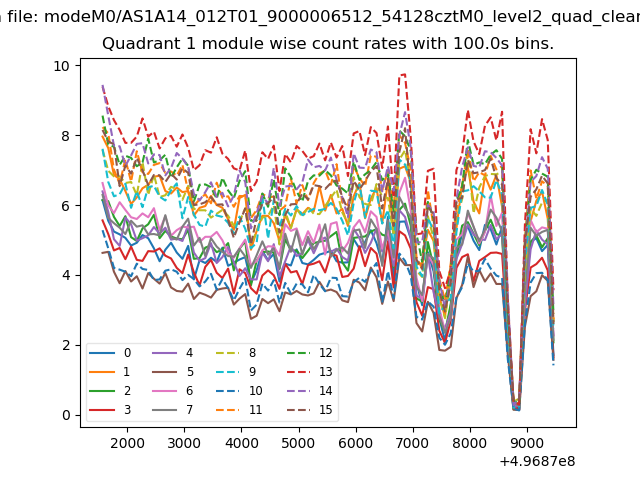
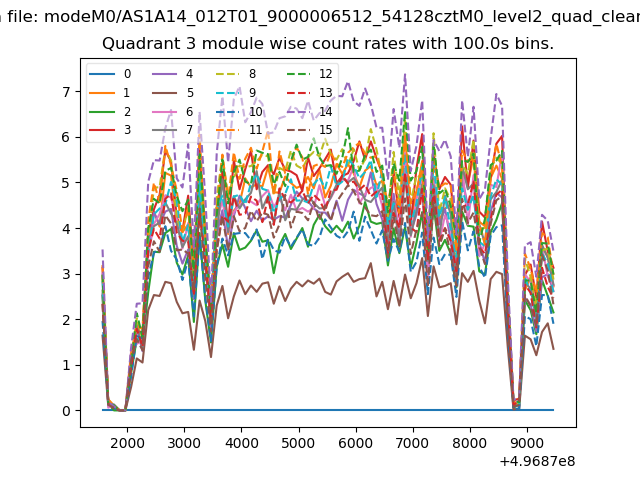
| Module-wise count rates for Quadrant A Data is divided into 100 sec bins |
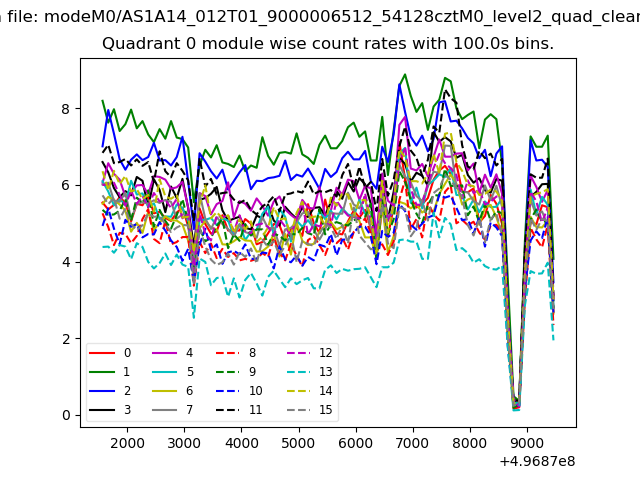 |
 |
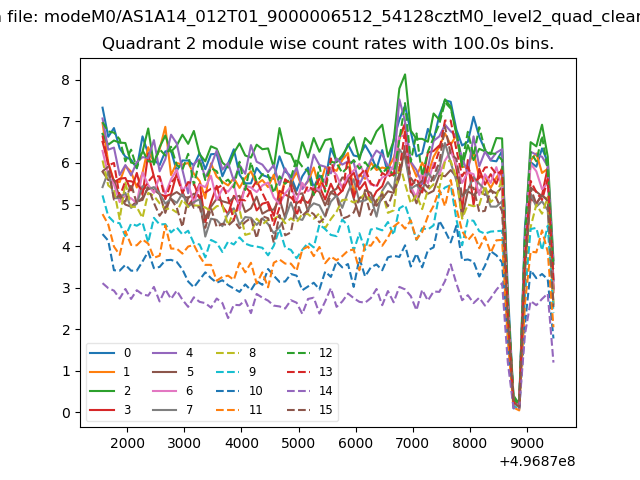
| Module-wise count rates for Quadrant B Data is divided into 100 sec bins |
 |
 |
| Module-wise count rates for Quadrant C Data is divided into 100 sec bins |
 |
 |
| Module-wise count rates for Quadrant D Data is divided into 100 sec bins |
 |
 |
| Parameter | Plot |
|---|---|
| CZT HV Monitor | 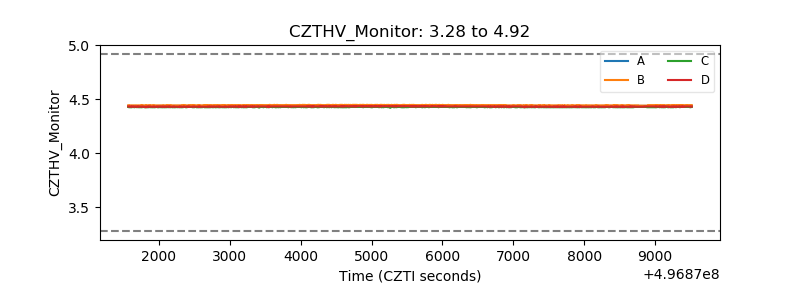 |
| D_VDD | 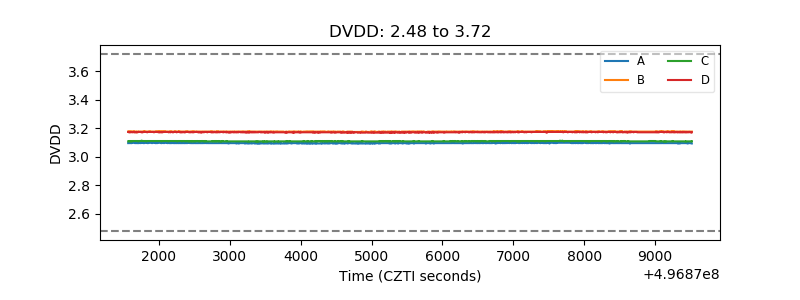 |
| Temperature 1 | 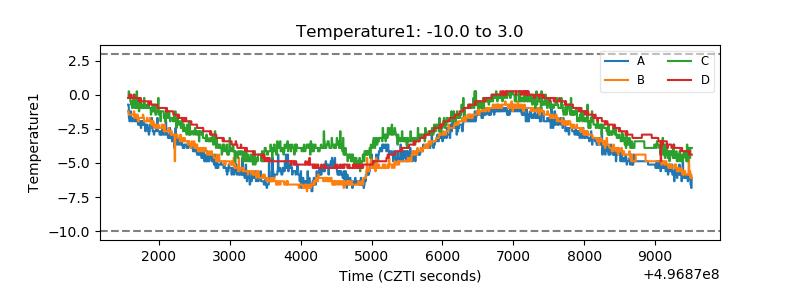 |
| Veto HV Monitor | 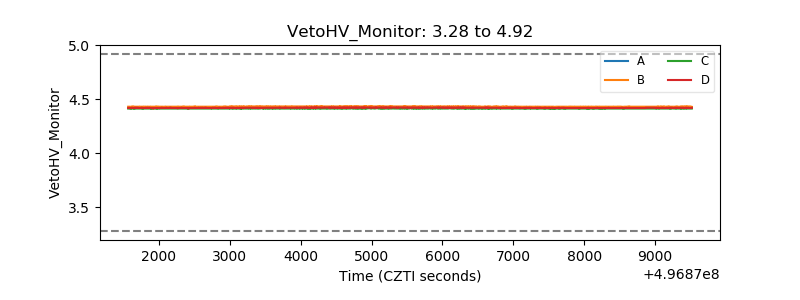 |
| Veto LLD | 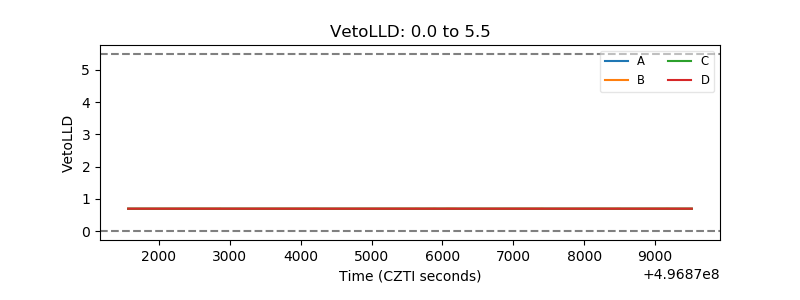 |
| Alpha Counter | 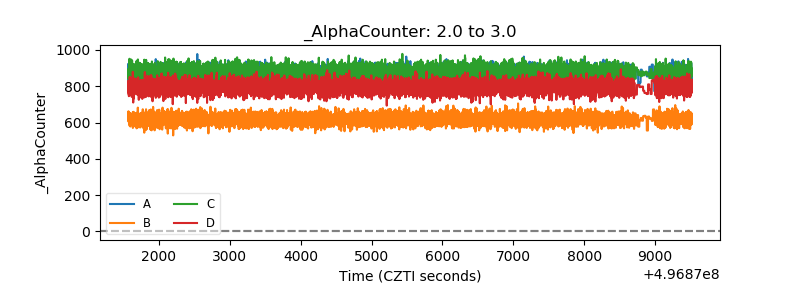 |
| _CPM_Rate | 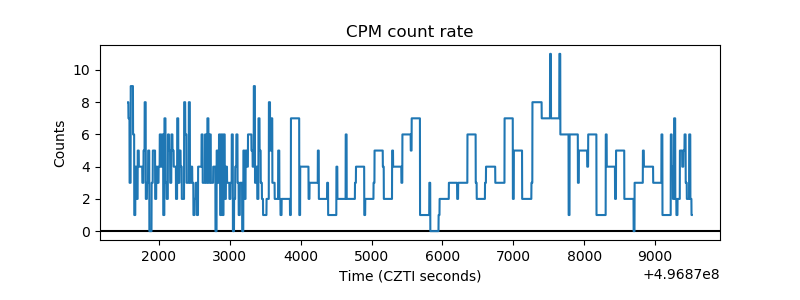 |
| CZT Counter | 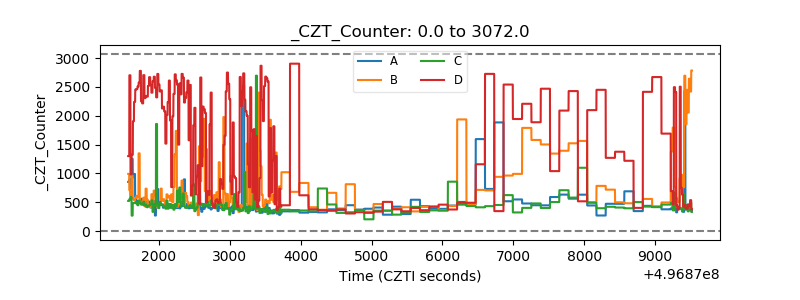 |
| +2.5 Volts monitor | 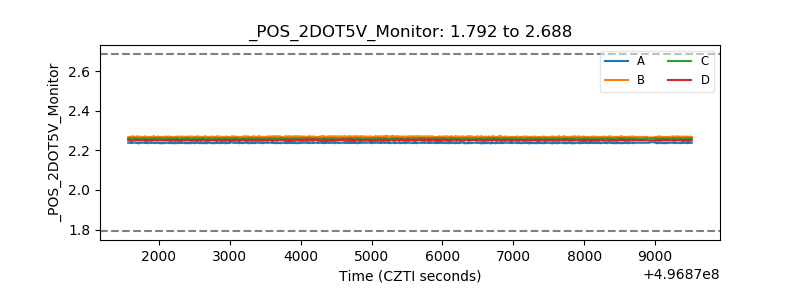 |
| +5 Volts monitor | 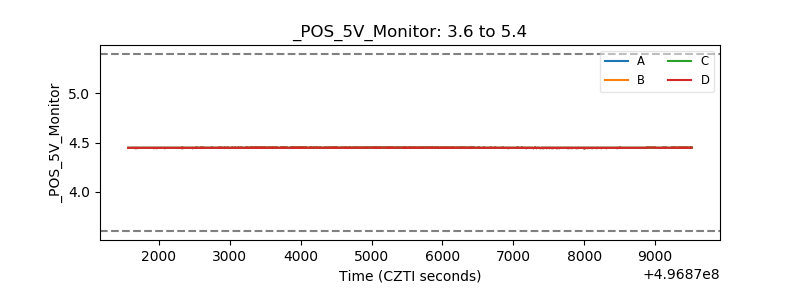 |
| _ROLL_ROT | 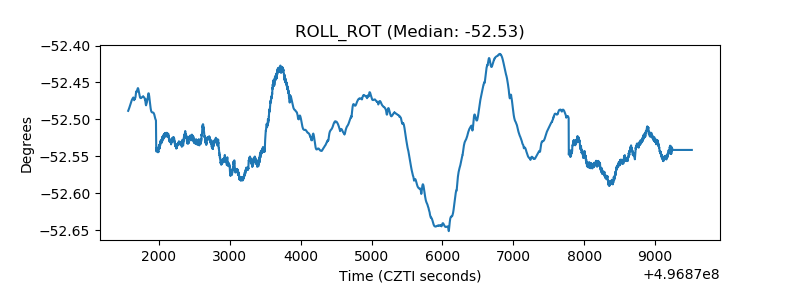 |
| _Roll_DEC | 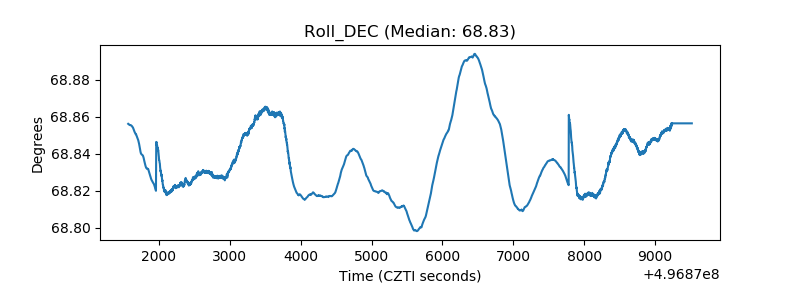 |
| _Roll_RA | 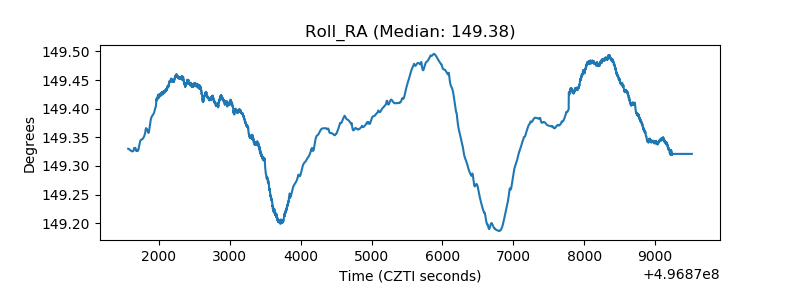 |
| Veto Counter | 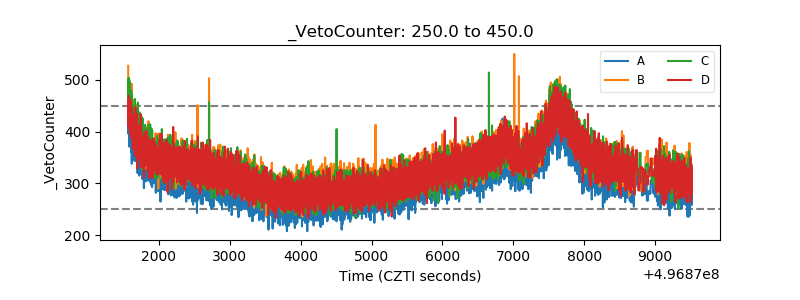 |