| Param | Original file | Final file |
|---|---|---|
| Filename | modeM0/AS1A14_012T01_9000006512_54129cztM0_level2.fits | modeM0/AS1A14_012T01_9000006512_54129cztM0_level2_quad_clean.evt |
| Size (bytes) | 683,493,120 | 104,538,240 |
| Size | 651.8 MB | 99.7 MB |
| Events in quadrant A | 4,008,452 | 707,024 |
| Events in quadrant B | 7,264,518 | 700,082 |
| Events in quadrant C | 4,275,785 | 671,176 |
| Events in quadrant D | 9,094,286 | 497,467 |
| Mode SS | |||
|---|---|---|---|
| Quadrant | BADHDUFLAG | Total packets | Discarded packets |
| A | 0 | 170 | 0 |
| B | 0 | 170 | 0 |
| C | 0 | 170 | 0 |
| D | 0 | 170 | 0 |
| Mode M0 | |||
|---|---|---|---|
| Quadrant | BADHDUFLAG | Total packets | Discarded packets |
| A | 0 | 18421 | 0 |
| B | 0 | 27587 | 0 |
| C | 0 | 19085 | 0 |
| D | 0 | 33278 | 0 |
| Quadrant | Total seconds | Saturated seconds | Saturation percentage |
|---|---|---|---|
| A | 8476 | 86 | 1.014630% |
| B | 8477 | 1030 | 12.150525% |
| C | 8477 | 138 | 1.627934% |
| D | 8477 | 1684 | 19.865518% |
Noise dominated data is calculated using 1-second bins in cleaned event files. If a bin has >2000 counts, and if more than 50% of those come from <1% of pixels, then it is considered to be noise-dominated and hence unusable.
| Quadrant | # 1 sec bins | Bins with >0 counts | Bins with >2000 counts | High rate bins dominated by noise | Noise dominated (total time) | Noise dominated (detector-on time) | Marked lightcurve |
|---|---|---|---|---|---|---|---|
| A | 8754 | 8754 | 74 | 74 | 0.85% | 0.85% | 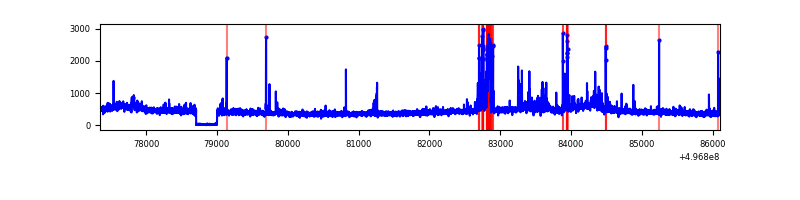 |
| B | 8755 | 8755 | 547 | 547 | 6.25% | 6.25% | 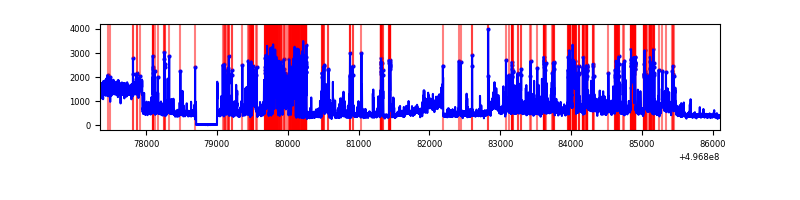 |
| C | 8755 | 8755 | 77 | 77 | 0.88% | 0.88% | 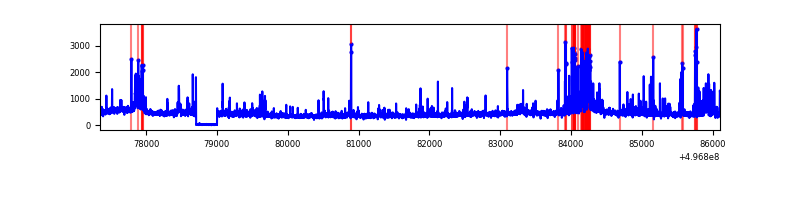 |
| D | 8755 | 8741 | 1527 | 1527 | 17.44% | 17.47% | 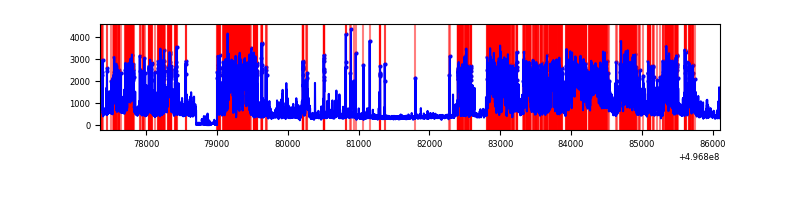 |
Top three noisy pixels from each quadrant. If the there are fewer than three noisy pixels in the level2.evt file, extra rows are filled as -1
| Pixel properties | Quadrant properties | ||||||
|---|---|---|---|---|---|---|---|
| Quadrant | DetID | PixID | Counts | Sigma | Mean | Median | Sigma |
| A | 15 | 174 | 265182 | 1180.42 | 898 | 874 | 223.9 |
| A | 3 | 130 | 49375 | 216.61 | 898 | 874 | 223.9 |
| A | 0 | 8 | 47263 | 207.18 | 898 | 874 | 223.9 |
| B | 5 | 172 | 1483056 | 7926.97 | 867 | 834 | 187.0 |
| B | 5 | 236 | 1369978 | 7322.23 | 867 | 834 | 187.0 |
| B | 0 | 213 | 236003 | 1257.69 | 867 | 834 | 187.0 |
| C | 1 | 241 | 345234 | 1410.22 | 888 | 878 | 244.2 |
| C | 13 | 3 | 103529 | 420.38 | 888 | 878 | 244.2 |
| C | 12 | 252 | 100503 | 407.99 | 888 | 878 | 244.2 |
| D | 8 | 176 | 4077451 | 17962.38 | 798 | 761 | 227.0 |
| D | 2 | 249 | 489235 | 2152.27 | 798 | 761 | 227.0 |
| D | 10 | 181 | 420873 | 1851.06 | 798 | 761 | 227.0 |
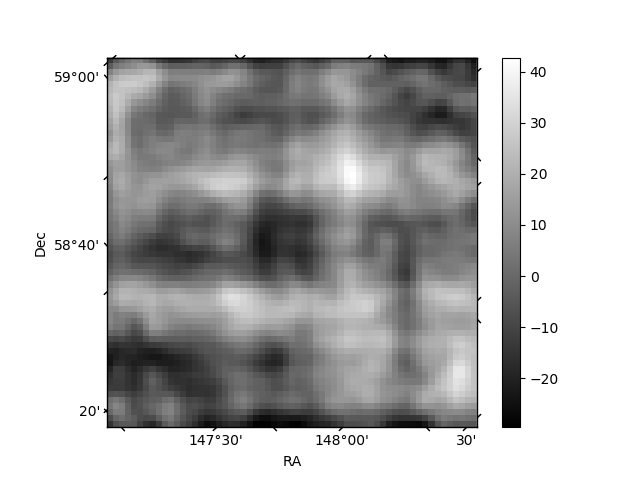
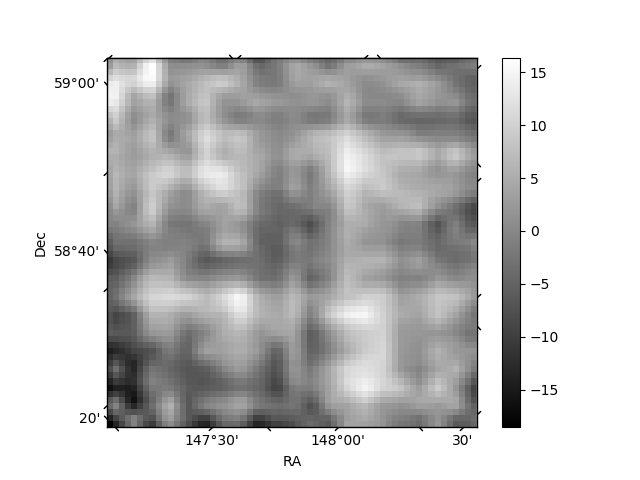
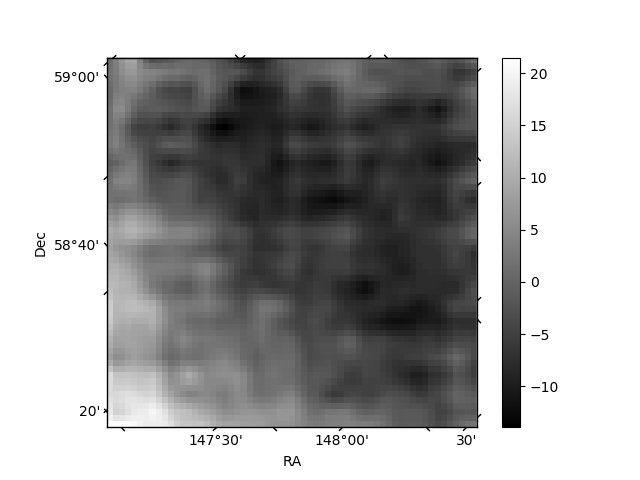
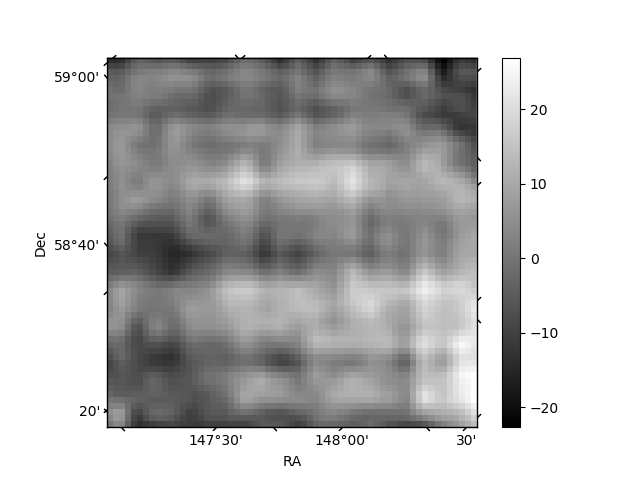
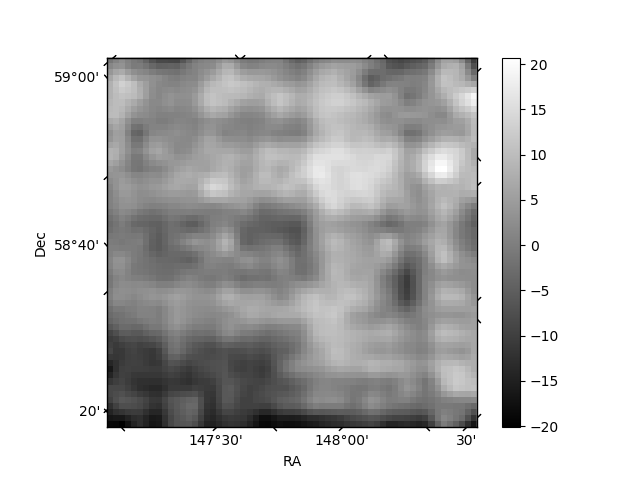
Histogram calculated using DETX and DETY for each event in the final _common_clean file
| Quadrant A | 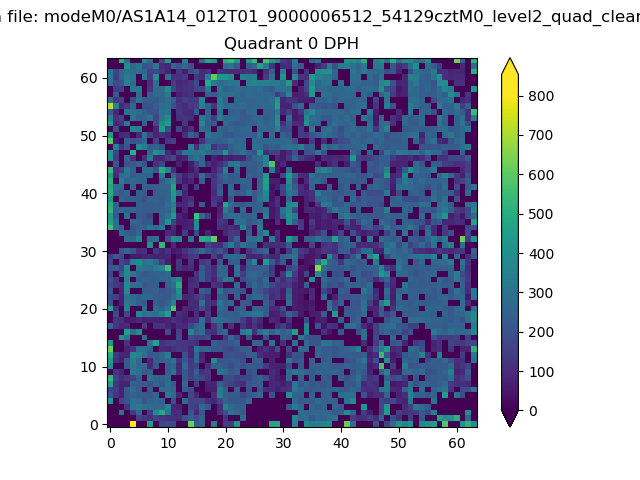 |
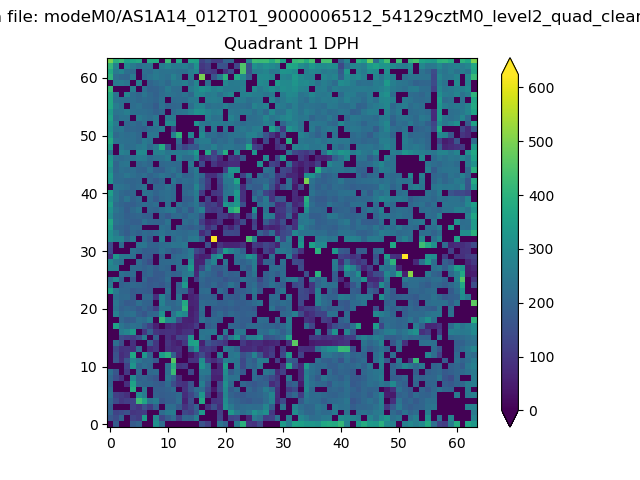 |
Quadrant B |
|---|---|---|---|
| Quadrant D | 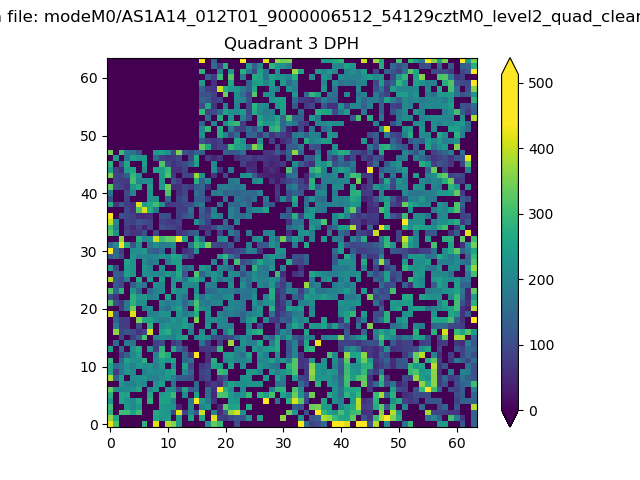 |
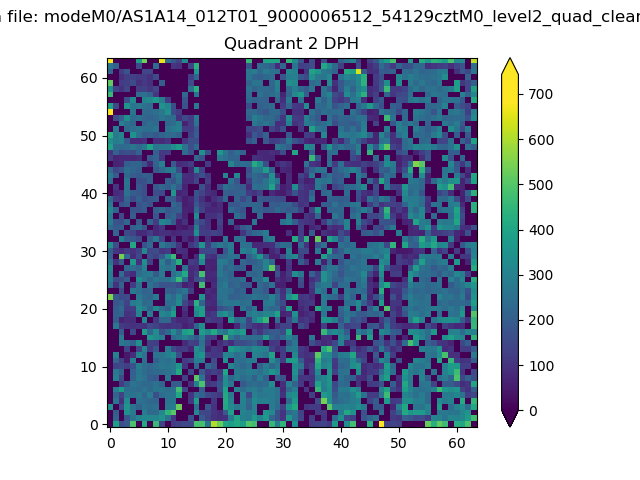 |
Quadrant C |
| Plot type | Count rate plots | Images |
|---|---|---|
| Comparison with Poisson distribution Blue bars denote a histogram of data divided into 1 sec bins. Red curve is a Poisson curve with rate = median count rate of data. |
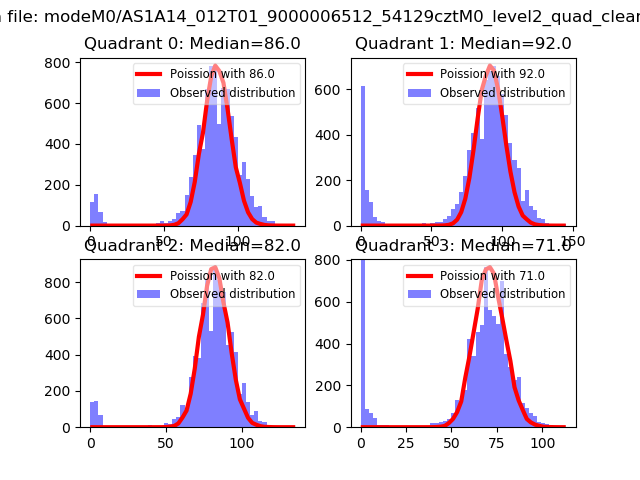 |
 |
| Quadrant-wise count rates Data is divided into 100 sec bins |
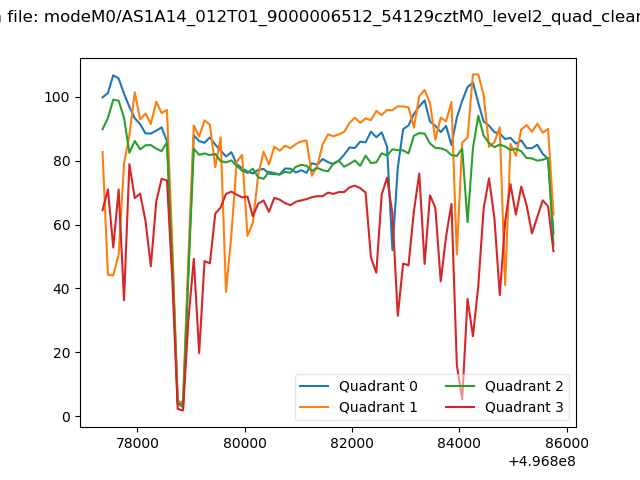 |
|
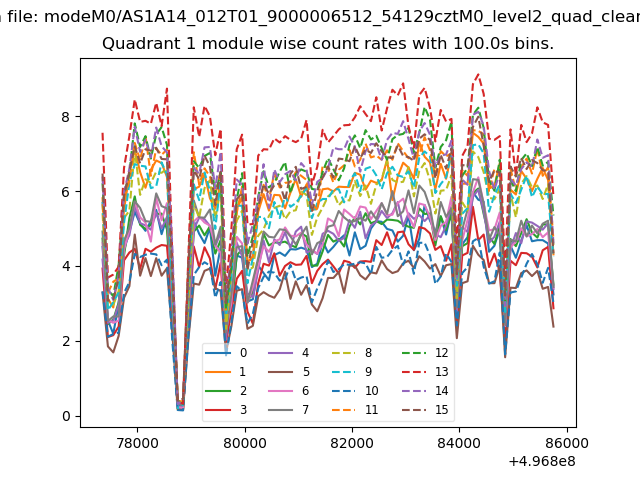
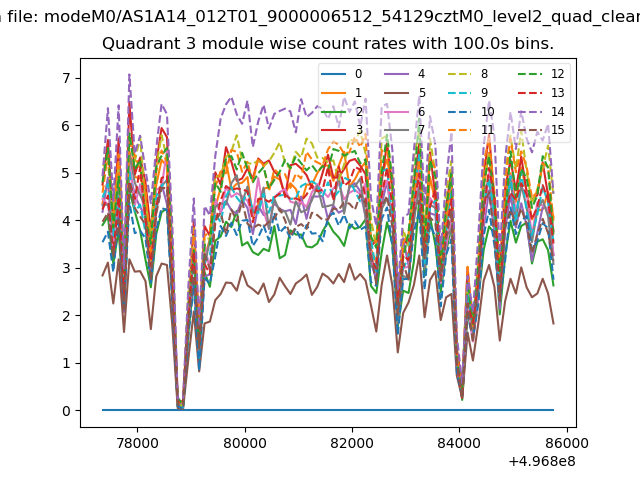
| Module-wise count rates for Quadrant A Data is divided into 100 sec bins |
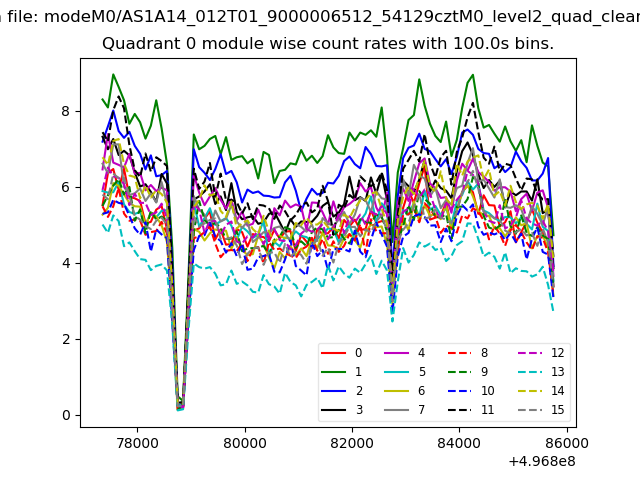 |
 |
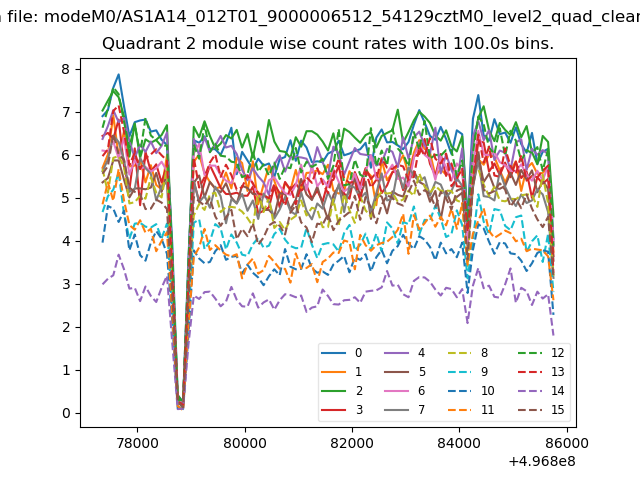
| Module-wise count rates for Quadrant B Data is divided into 100 sec bins |
 |
 |
| Module-wise count rates for Quadrant C Data is divided into 100 sec bins |
 |
 |
| Module-wise count rates for Quadrant D Data is divided into 100 sec bins |
 |
 |
| Parameter | Plot |
|---|---|
| CZT HV Monitor | 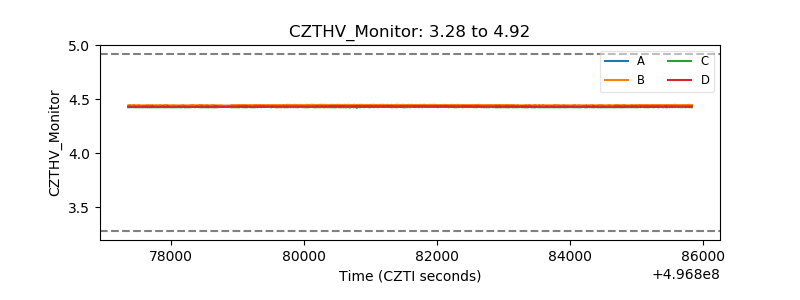 |
| D_VDD |  |
| Temperature 1 | 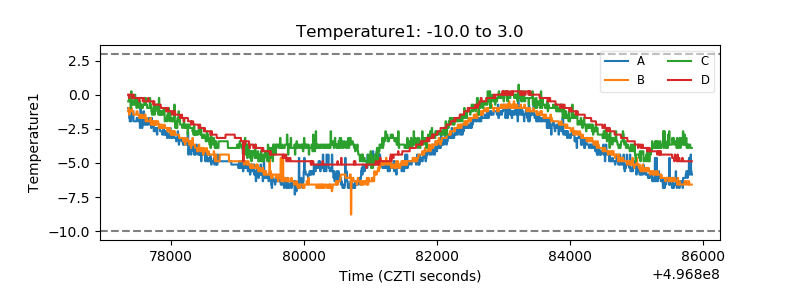 |
| Veto HV Monitor | 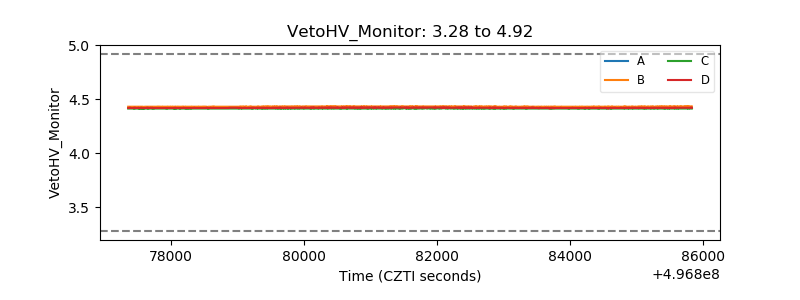 |
| Veto LLD | 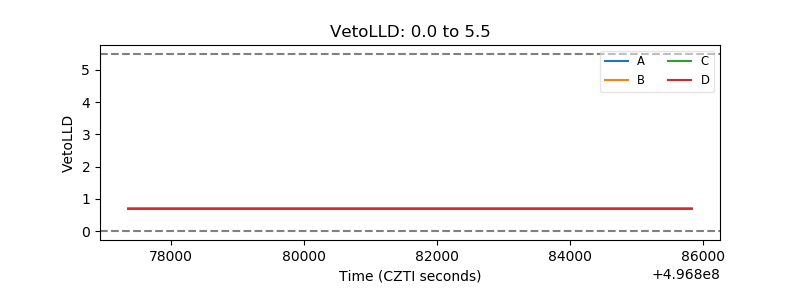 |
| Alpha Counter | 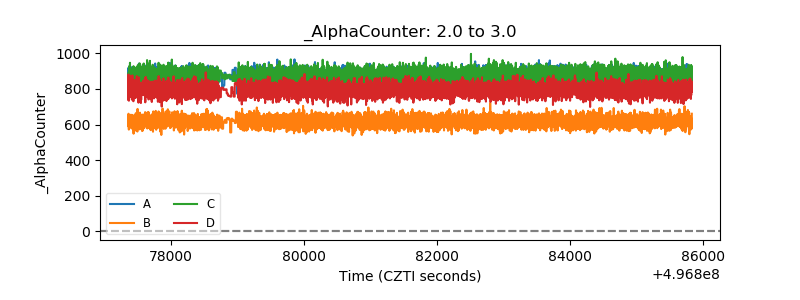 |
| _CPM_Rate | 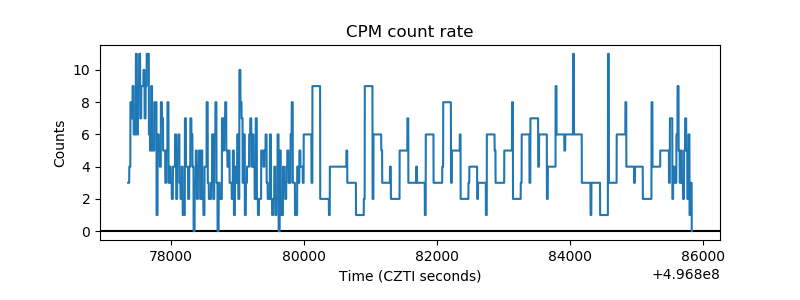 |
| CZT Counter | 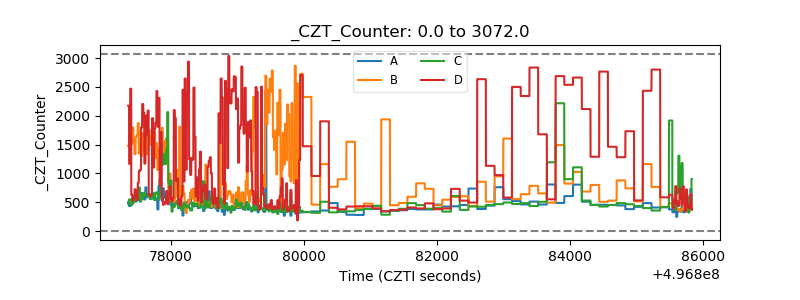 |
| +2.5 Volts monitor | 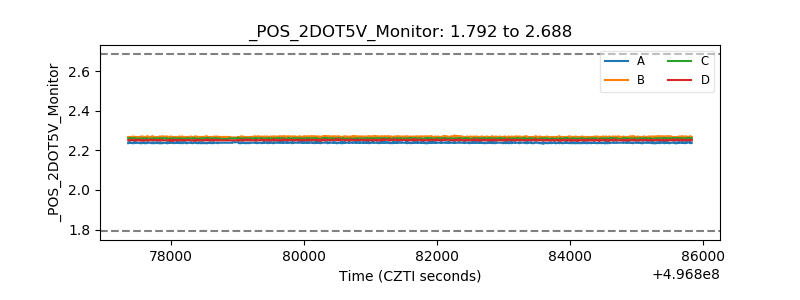 |
| +5 Volts monitor | 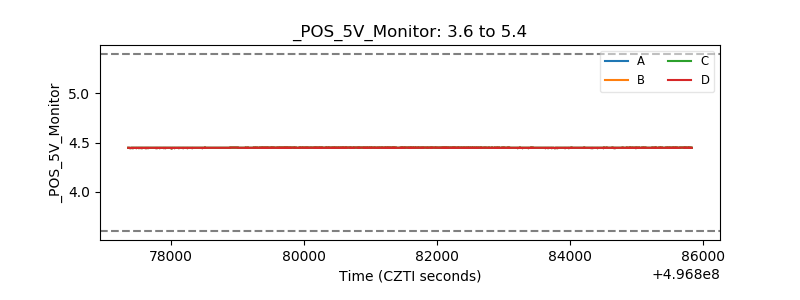 |
| _ROLL_ROT | 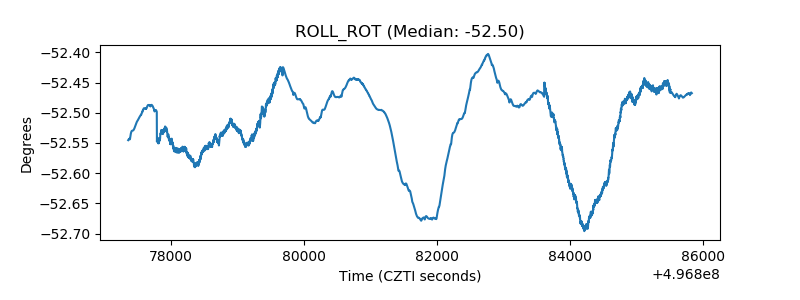 |
| _Roll_DEC | 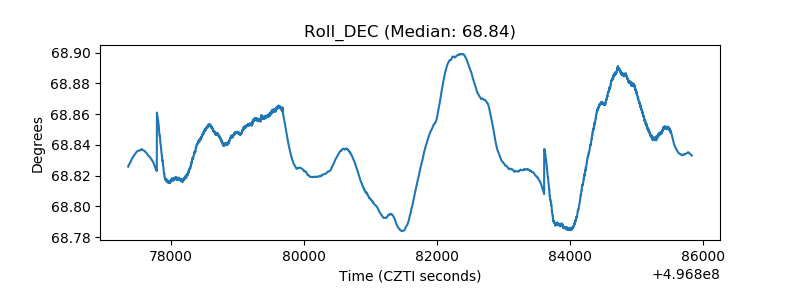 |
| _Roll_RA | 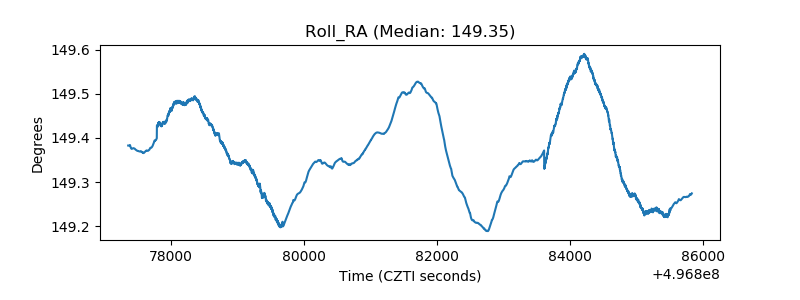 |
| Veto Counter | 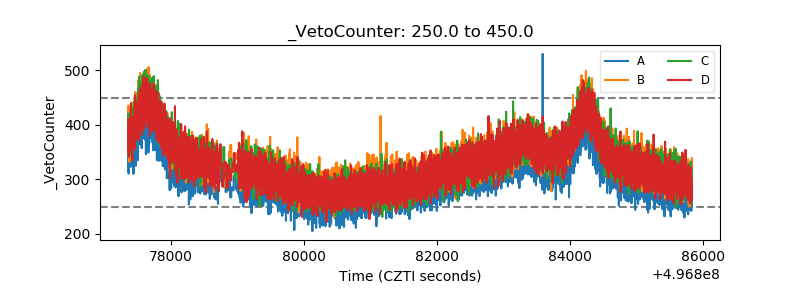 |