| Param | Original file | Final file |
|---|---|---|
| Filename | modeM0/AS1A14_012T01_9000006512_54133cztM0_level2.fits | modeM0/AS1A14_012T01_9000006512_54133cztM0_level2_quad_clean.evt |
| Size (bytes) | 1,828,068,480 | 349,960,320 |
| Size | 1.7 GB | 333.7 MB |
| Events in quadrant A | 15,318,649 | 2,259,290 |
| Events in quadrant B | 14,806,657 | 2,450,103 |
| Events in quadrant C | 11,762,176 | 2,253,319 |
| Events in quadrant D | 23,843,110 | 1,907,171 |
| Mode SS | |||
|---|---|---|---|
| Quadrant | BADHDUFLAG | Total packets | Discarded packets |
| A | 0 | 508 | 0 |
| B | 0 | 508 | 0 |
| C | 0 | 508 | 0 |
| D | 0 | 508 | 0 |
| Mode M0 | |||
|---|---|---|---|
| Quadrant | BADHDUFLAG | Total packets | Discarded packets |
| A | 0 | 64366 | 3 |
| B | 0 | 62364 | 3 |
| C | 0 | 54391 | 3 |
| D | 0 | 89130 | 3 |
| Mode M9 | |||
|---|---|---|---|
| Quadrant | BADHDUFLAG | Total packets | Discarded packets |
| A | 0 | 15 | 0 |
| B | 0 | 15 | 0 |
| C | 0 | 15 | 0 |
| D | 0 | 15 | 0 |
| Quadrant | Total seconds | Saturated seconds | Saturation percentage |
|---|---|---|---|
| A | 25074 | 1113 | 4.438861% |
| B | 25075 | 944 | 3.764706% |
| C | 25075 | 243 | 0.969093% |
| D | 25075 | 3113 | 12.414756% |
Noise dominated data is calculated using 1-second bins in cleaned event files. If a bin has >2000 counts, and if more than 50% of those come from <1% of pixels, then it is considered to be noise-dominated and hence unusable.
| Quadrant | # 1 sec bins | Bins with >0 counts | Bins with >2000 counts | High rate bins dominated by noise | Noise dominated (total time) | Noise dominated (detector-on time) | Marked lightcurve |
|---|---|---|---|---|---|---|---|
| A | 26559 | 25075 | 889 | 889 | 3.35% | 3.55% | 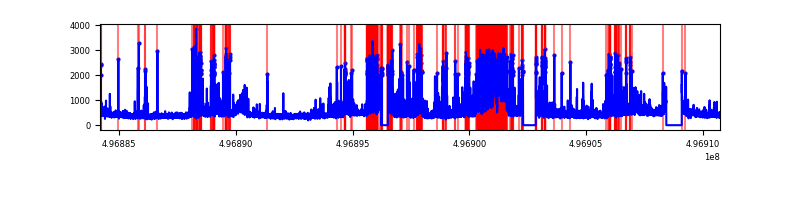 |
| B | 26560 | 25075 | 418 | 418 | 1.57% | 1.67% | 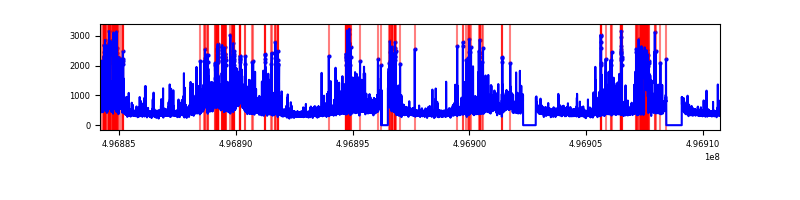 |
| C | 26560 | 25079 | 160 | 160 | 0.60% | 0.64% | 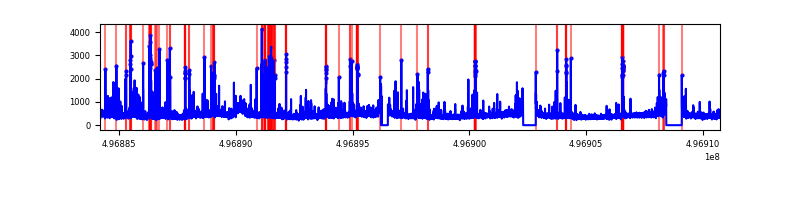 |
| D | 26560 | 25078 | 2716 | 2716 | 10.23% | 10.83% | 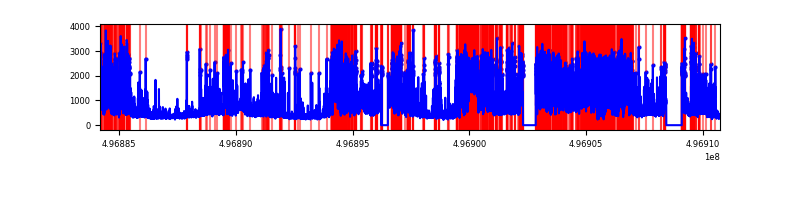 |
Top three noisy pixels from each quadrant. If the there are fewer than three noisy pixels in the level2.evt file, extra rows are filled as -1
| Pixel properties | Quadrant properties | ||||||
|---|---|---|---|---|---|---|---|
| Quadrant | DetID | PixID | Counts | Sigma | Mean | Median | Sigma |
| A | 7 | 158 | 3028385 | 4740.14 | 2585 | 2521 | 638.3 |
| A | 0 | 8 | 629395 | 982.02 | 2585 | 2521 | 638.3 |
| A | 15 | 174 | 583722 | 910.47 | 2585 | 2521 | 638.3 |
| B | 5 | 236 | 902088 | 1634.26 | 2585 | 2494 | 550.5 |
| B | 5 | 172 | 873322 | 1582.0 | 2585 | 2494 | 550.5 |
| B | 15 | 20 | 743923 | 1346.93 | 2585 | 2494 | 550.5 |
| C | 12 | 252 | 366704 | 521.08 | 2563 | 2536 | 698.9 |
| C | 13 | 3 | 263838 | 373.89 | 2563 | 2536 | 698.9 |
| C | 15 | 217 | 239273 | 338.74 | 2563 | 2536 | 698.9 |
| D | 8 | 176 | 5236525 | 7647.43 | 2404 | 2295 | 684.4 |
| D | 7 | 70 | 5069810 | 7403.85 | 2404 | 2295 | 684.4 |
| D | 12 | 153 | 671972 | 978.43 | 2404 | 2295 | 684.4 |
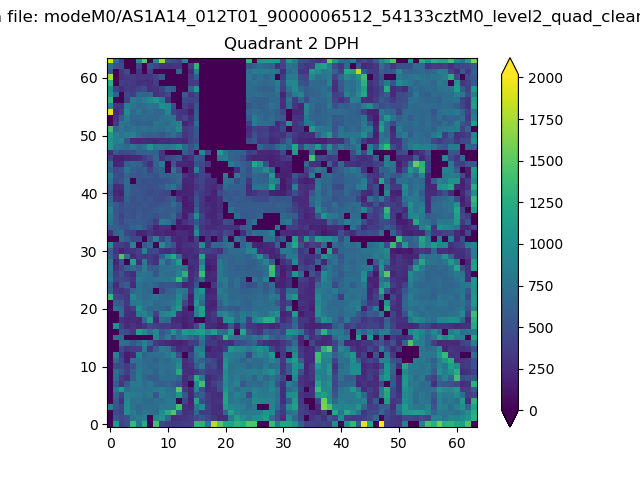
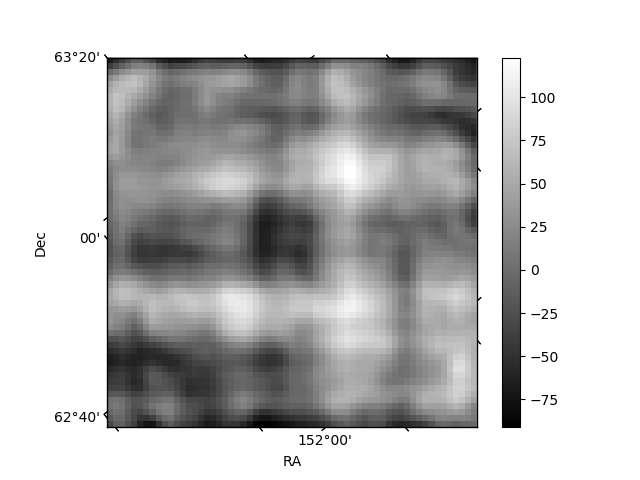
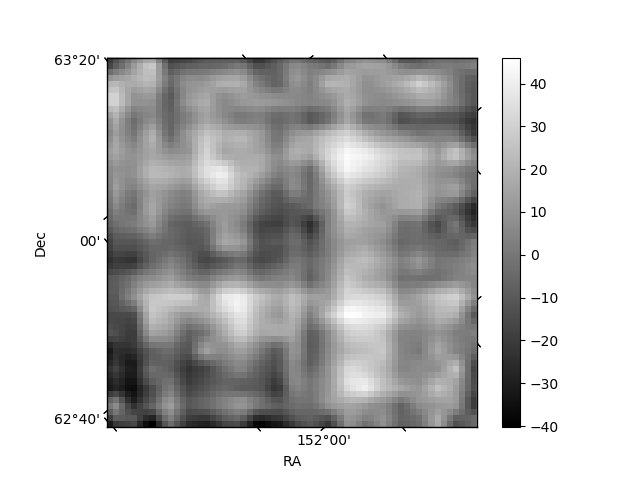
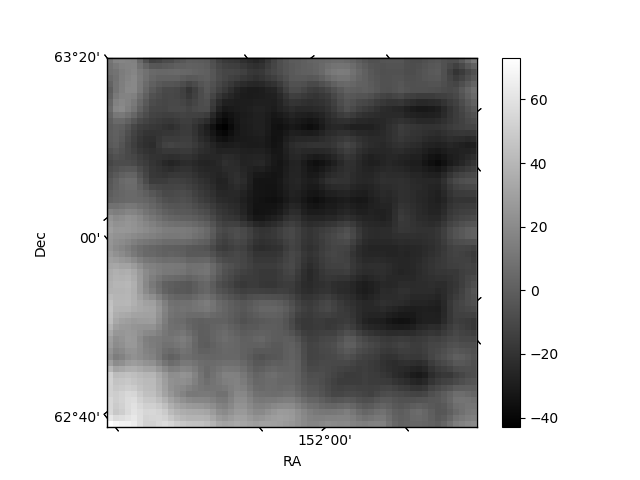
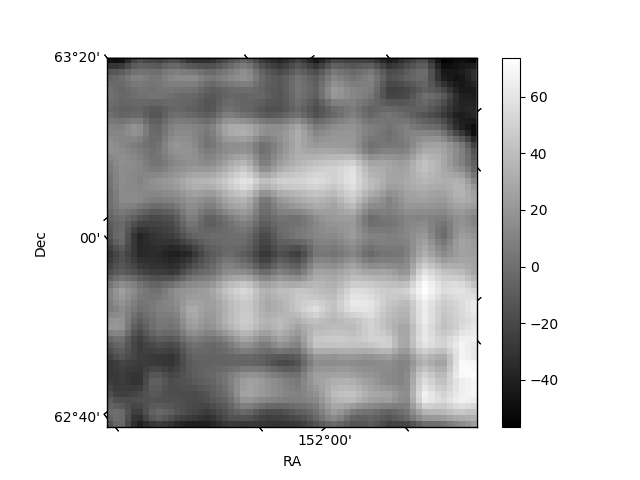
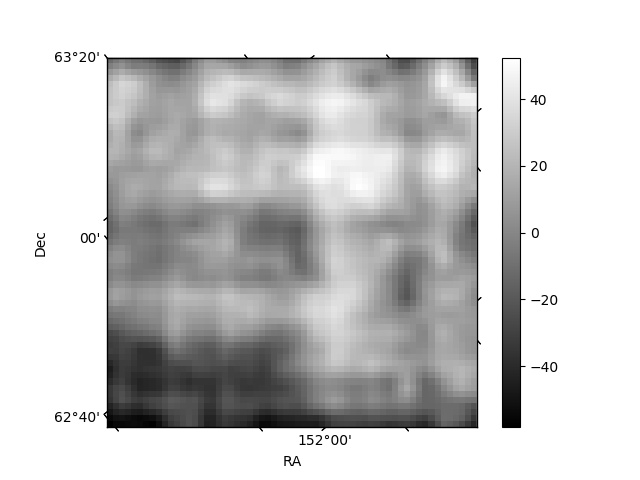
Histogram calculated using DETX and DETY for each event in the final _common_clean file
| Quadrant A | 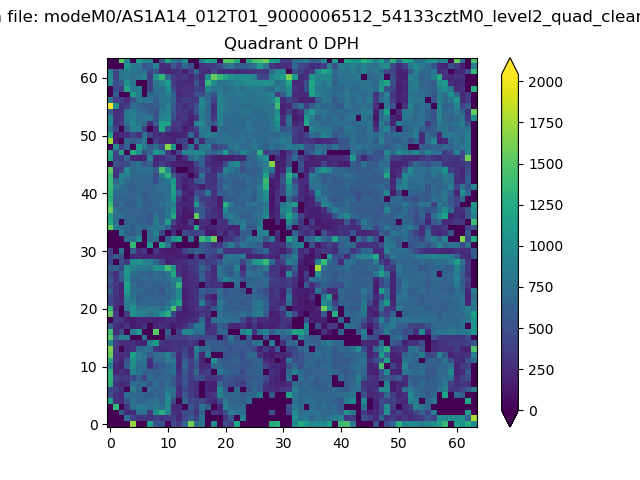 |
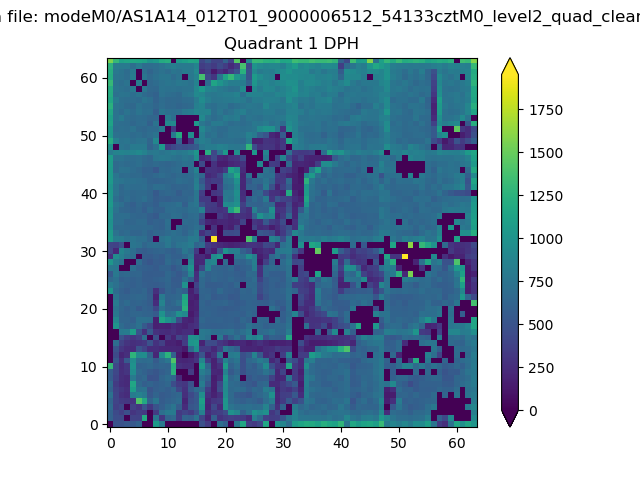 |
Quadrant B |
|---|---|---|---|
| Quadrant D | 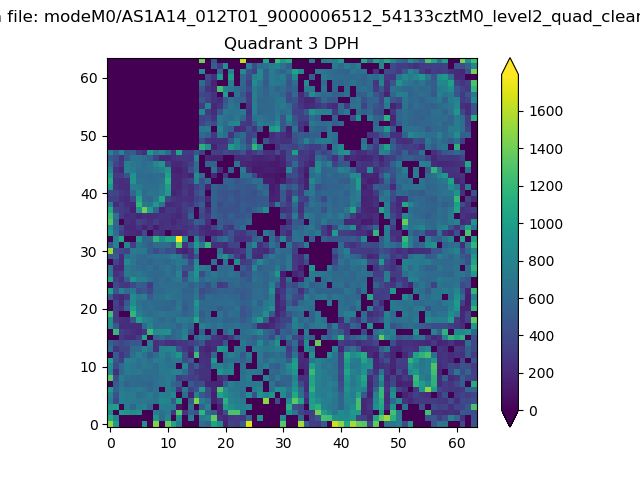 |
 |
Quadrant C |
| Plot type | Count rate plots | Images |
|---|---|---|
| Comparison with Poisson distribution Blue bars denote a histogram of data divided into 1 sec bins. Red curve is a Poisson curve with rate = median count rate of data. |
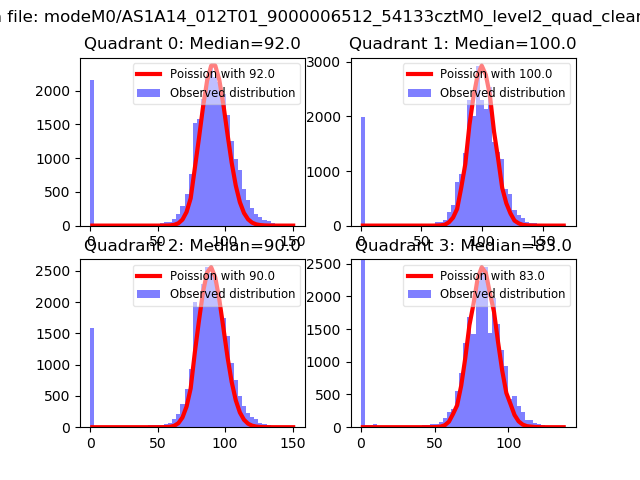 |
 |
| Quadrant-wise count rates Data is divided into 100 sec bins |
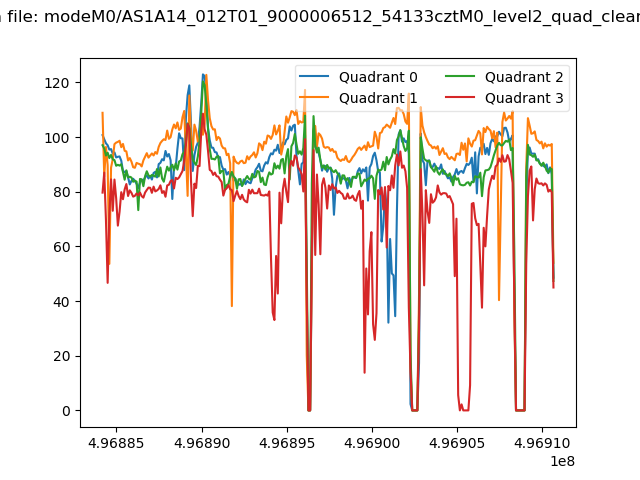 |
|
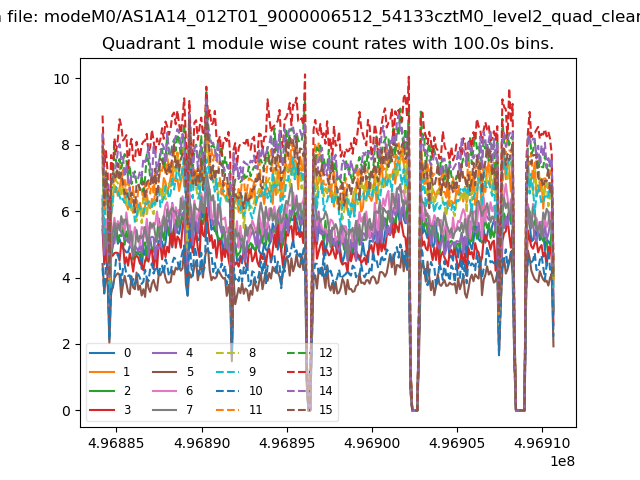
| Module-wise count rates for Quadrant A Data is divided into 100 sec bins |
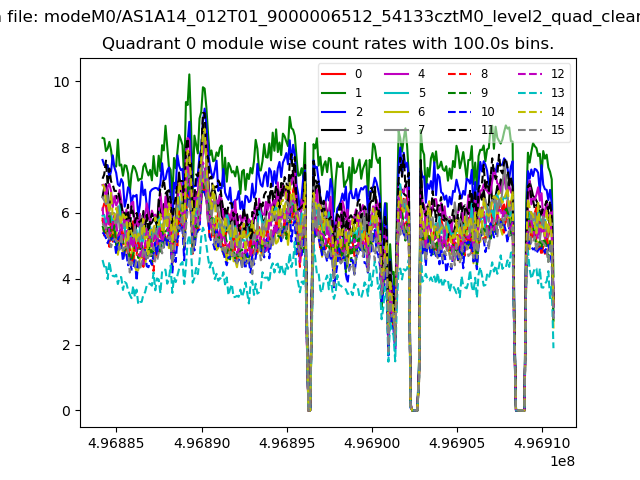 |
 |
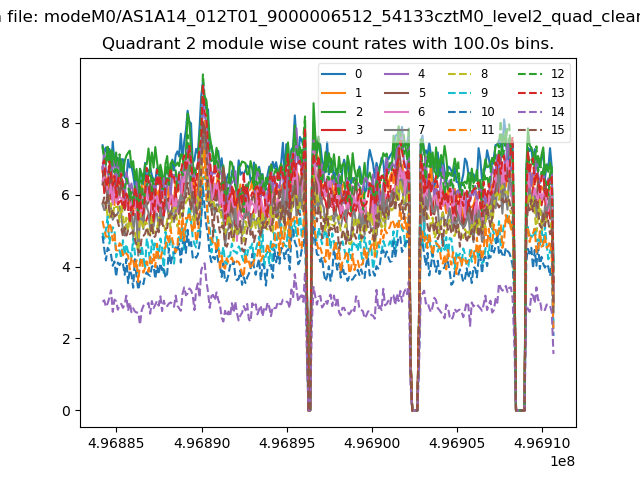
| Module-wise count rates for Quadrant B Data is divided into 100 sec bins |
 |
 |
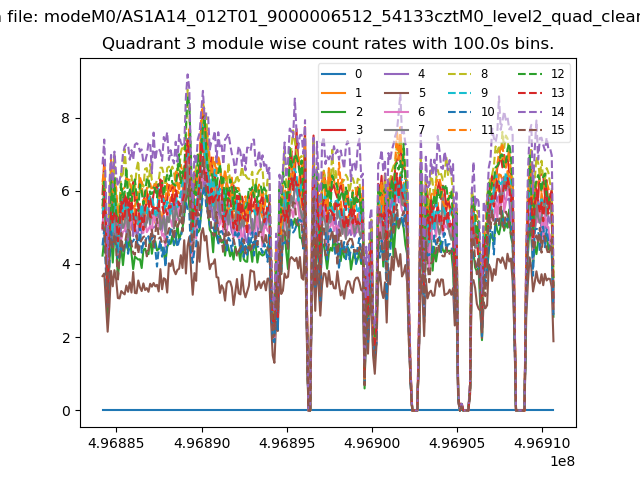
| Module-wise count rates for Quadrant C Data is divided into 100 sec bins |
 |
 |
| Module-wise count rates for Quadrant D Data is divided into 100 sec bins |
 |
 |
| Parameter | Plot |
|---|---|
| CZT HV Monitor | 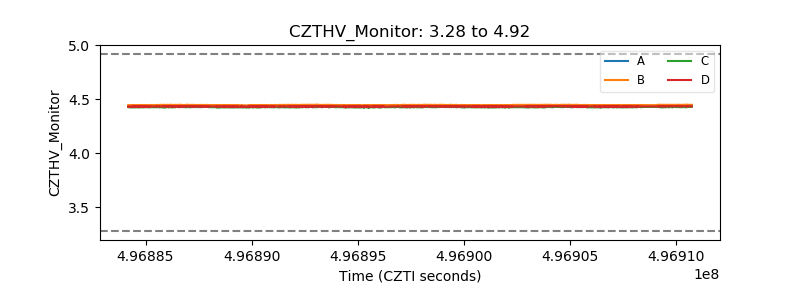 |
| D_VDD | 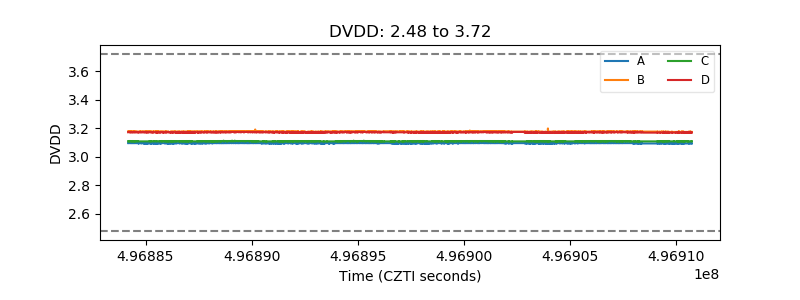 |
| Temperature 1 | 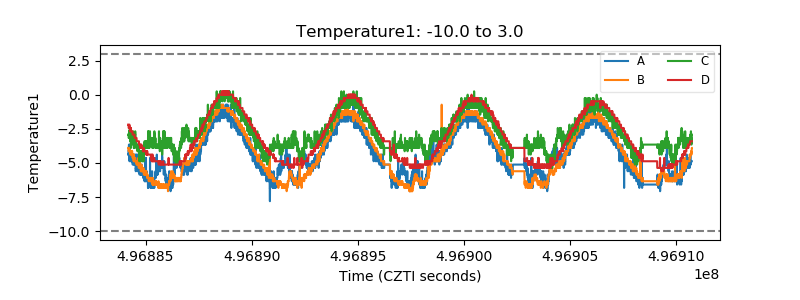 |
| Veto HV Monitor | 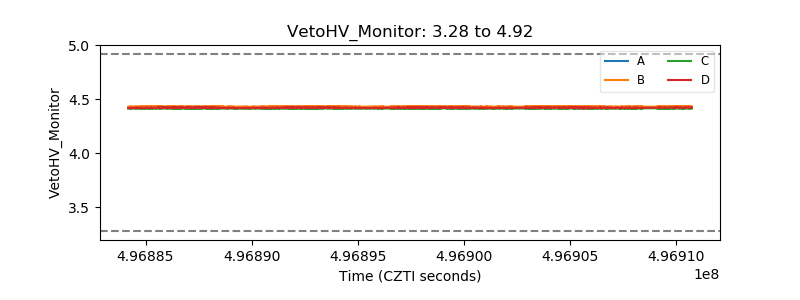 |
| Veto LLD | 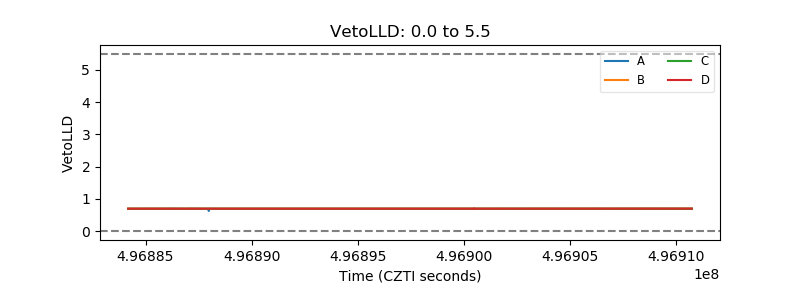 |
| Alpha Counter | 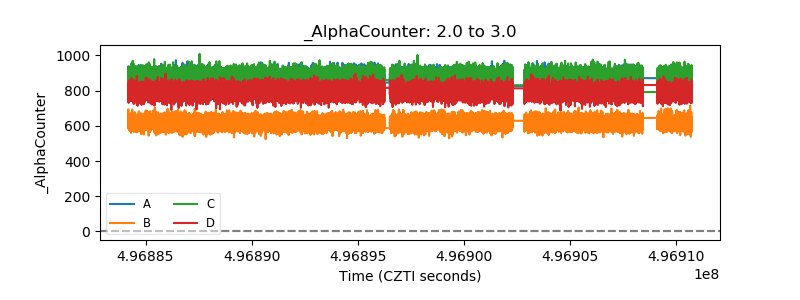 |
| _CPM_Rate | 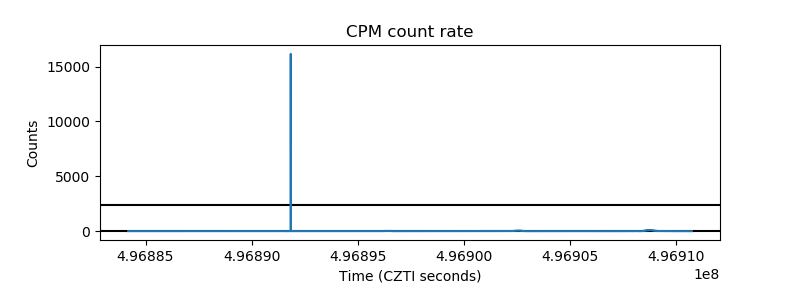 |
| CZT Counter | 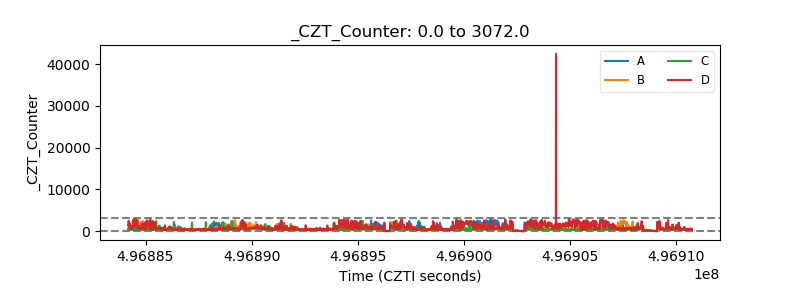 |
| +2.5 Volts monitor |  |
| +5 Volts monitor | 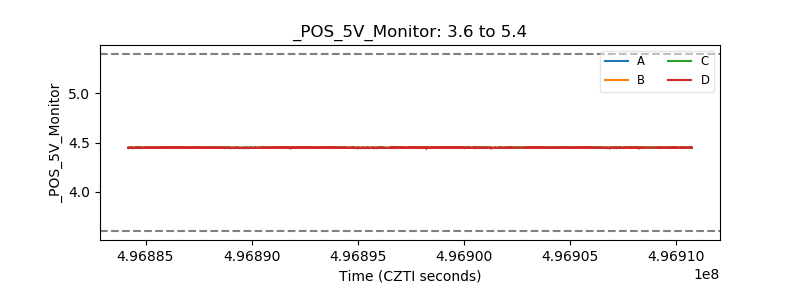 |
| _ROLL_ROT | 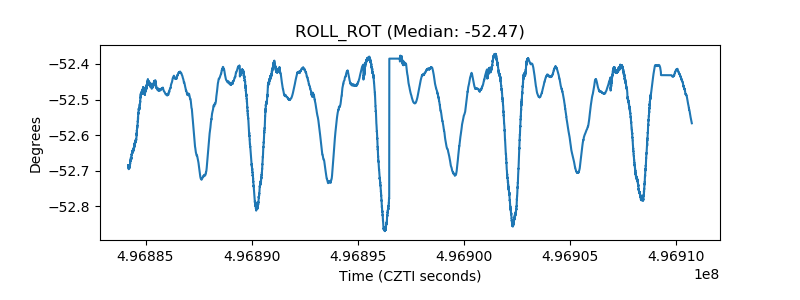 |
| _Roll_DEC | 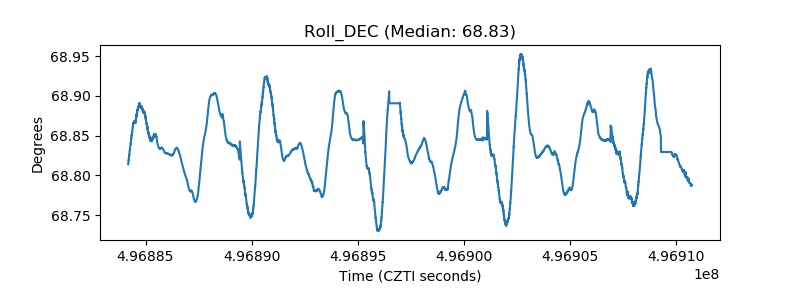 |
| _Roll_RA | 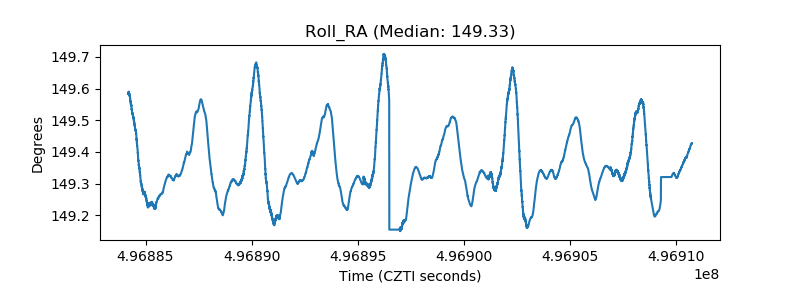 |
| Veto Counter | 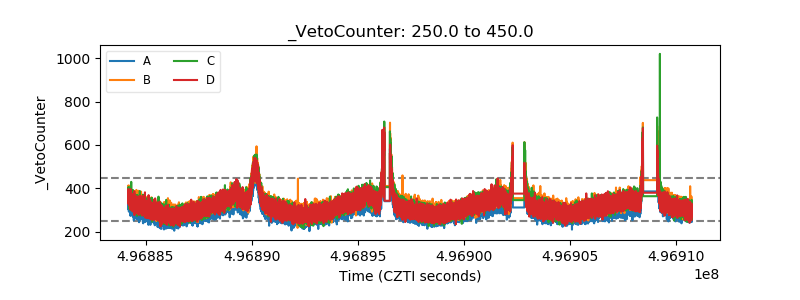 |