| Param | Original file | Final file |
|---|---|---|
| Filename | modeM0/AS1A14_012T01_9000006512_54134cztM0_level2.fits | modeM0/AS1A14_012T01_9000006512_54134cztM0_level2_quad_clean.evt |
| Size (bytes) | 516,467,520 | 92,088,000 |
| Size | 492.5 MB | 87.8 MB |
| Events in quadrant A | 3,424,986 | 610,207 |
| Events in quadrant B | 3,244,507 | 667,183 |
| Events in quadrant C | 3,098,919 | 593,870 |
| Events in quadrant D | 8,836,034 | 456,051 |
| Mode SS | |||
|---|---|---|---|
| Quadrant | BADHDUFLAG | Total packets | Discarded packets |
| A | 0 | 134 | 0 |
| B | 0 | 134 | 0 |
| C | 0 | 134 | 0 |
| D | 0 | 134 | 0 |
| Mode M0 | |||
|---|---|---|---|
| Quadrant | BADHDUFLAG | Total packets | Discarded packets |
| A | 0 | 14708 | 1 |
| B | 0 | 14225 | 1 |
| C | 0 | 14521 | 1 |
| D | 0 | 30892 | 1 |
| Mode M9 | |||
|---|---|---|---|
| Quadrant | BADHDUFLAG | Total packets | Discarded packets |
| A | 0 | 8 | 0 |
| B | 0 | 8 | 0 |
| C | 0 | 8 | 0 |
| D | 0 | 8 | 0 |
| Quadrant | Total seconds | Saturated seconds | Saturation percentage |
|---|---|---|---|
| A | 6610 | 124 | 1.875946% |
| B | 6610 | 67 | 1.013616% |
| C | 6611 | 99 | 1.497504% |
| D | 6611 | 1480 | 22.386931% |
Noise dominated data is calculated using 1-second bins in cleaned event files. If a bin has >2000 counts, and if more than 50% of those come from <1% of pixels, then it is considered to be noise-dominated and hence unusable.
| Quadrant | # 1 sec bins | Bins with >0 counts | Bins with >2000 counts | High rate bins dominated by noise | Noise dominated (total time) | Noise dominated (detector-on time) | Marked lightcurve |
|---|---|---|---|---|---|---|---|
| A | 7445 | 6610 | 75 | 75 | 1.01% | 1.13% | 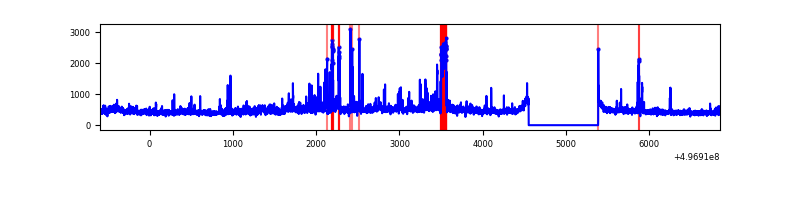 |
| B | 7445 | 6610 | 13 | 13 | 0.17% | 0.20% | 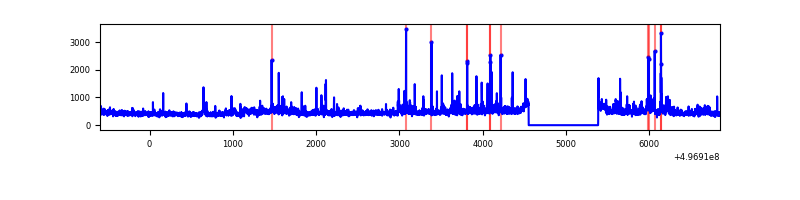 |
| C | 7446 | 6612 | 83 | 83 | 1.11% | 1.26% | 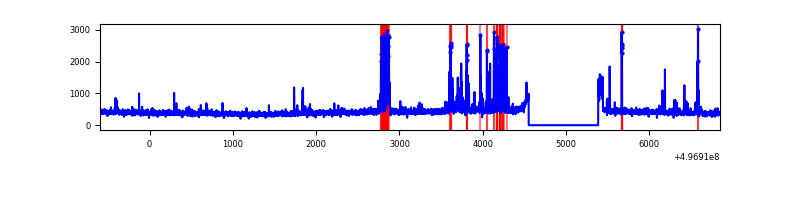 |
| D | 7446 | 6611 | 1495 | 1495 | 20.08% | 22.61% | 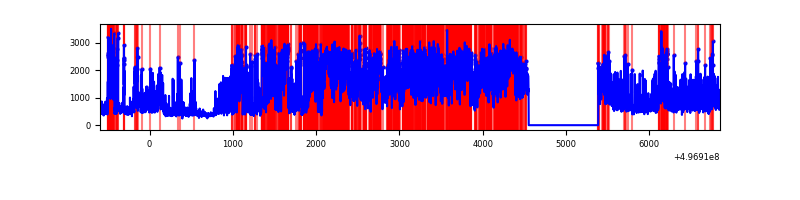 |
Top three noisy pixels from each quadrant. If the there are fewer than three noisy pixels in the level2.evt file, extra rows are filled as -1
| Pixel properties | Quadrant properties | ||||||
|---|---|---|---|---|---|---|---|
| Quadrant | DetID | PixID | Counts | Sigma | Mean | Median | Sigma |
| A | 3 | 14 | 284694 | 1667.75 | 687 | 672 | 170.3 |
| A | 15 | 174 | 217471 | 1273.02 | 687 | 672 | 170.3 |
| A | 7 | 158 | 68084 | 395.84 | 687 | 672 | 170.3 |
| B | 5 | 236 | 198354 | 1336.17 | 683 | 659 | 148.0 |
| B | 15 | 20 | 102110 | 685.68 | 683 | 659 | 148.0 |
| B | 0 | 197 | 46057 | 306.83 | 683 | 659 | 148.0 |
| C | 13 | 3 | 186130 | 1017.1 | 663 | 656 | 182.4 |
| C | 1 | 241 | 148320 | 809.76 | 663 | 656 | 182.4 |
| C | 12 | 252 | 35684 | 192.09 | 663 | 656 | 182.4 |
| D | 7 | 70 | 4190608 | 23778.11 | 616 | 587 | 176.2 |
| D | 8 | 176 | 1567990 | 8894.92 | 616 | 587 | 176.2 |
| D | 12 | 128 | 186253 | 1053.64 | 616 | 587 | 176.2 |
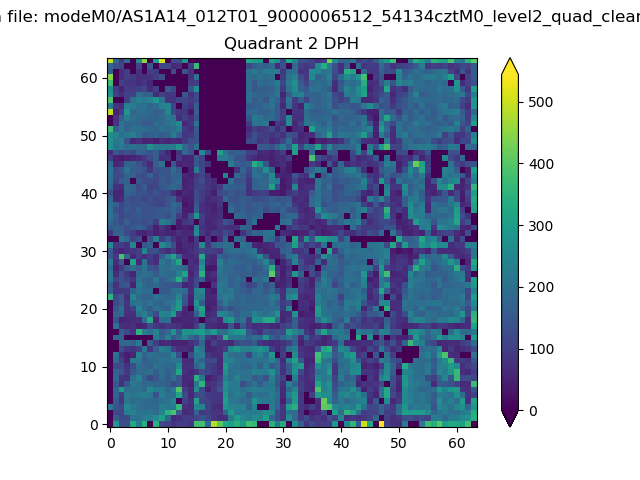
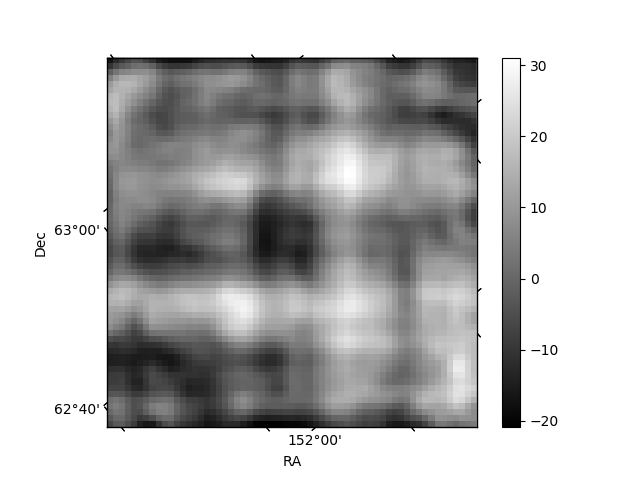
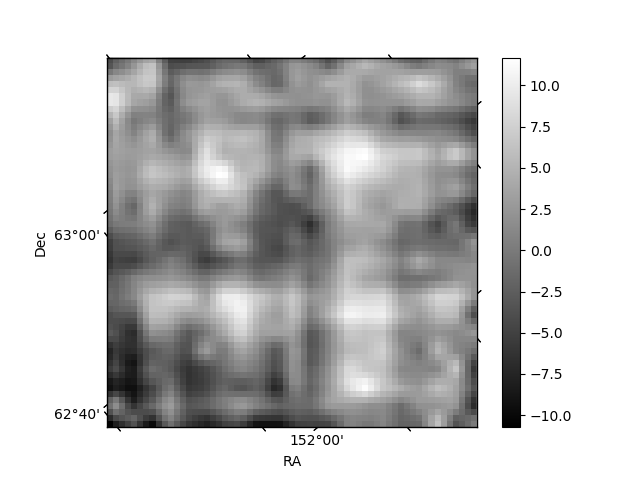
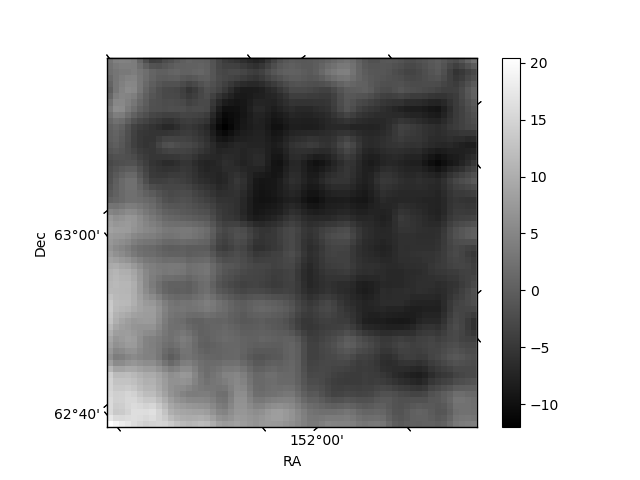
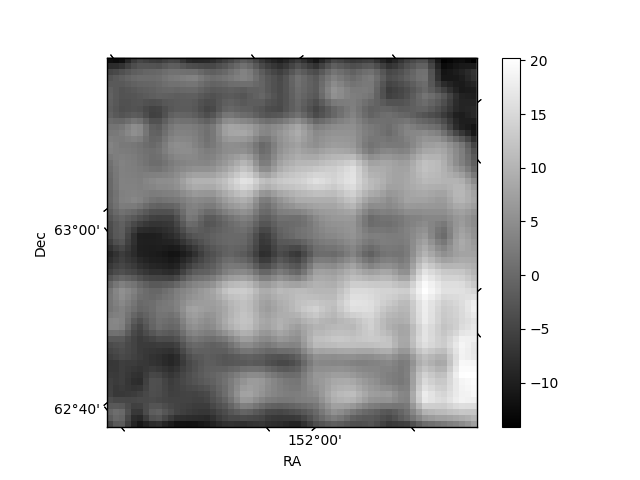
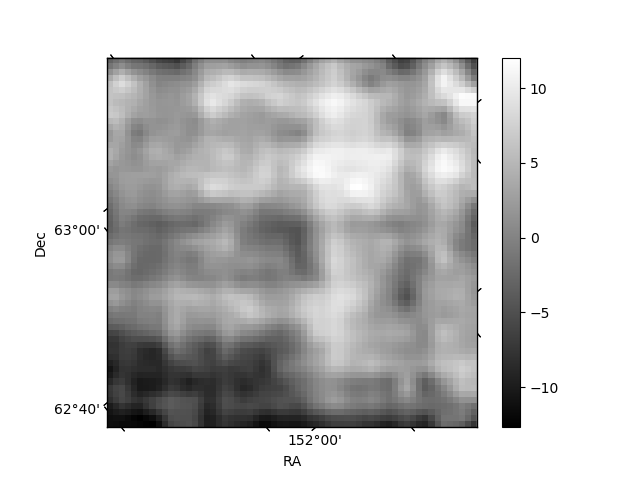
Histogram calculated using DETX and DETY for each event in the final _common_clean file
| Quadrant A | 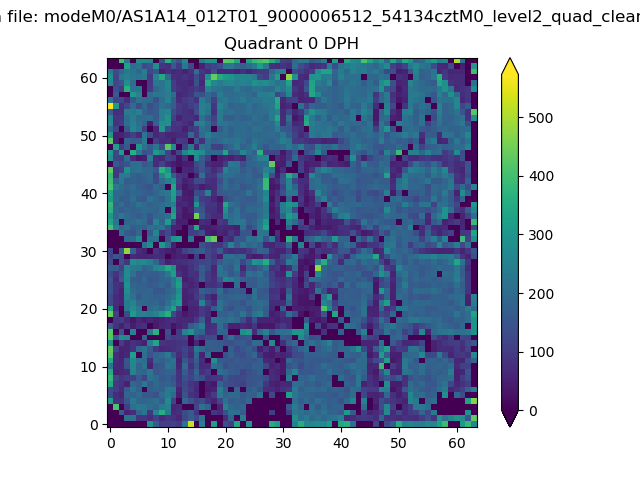 |
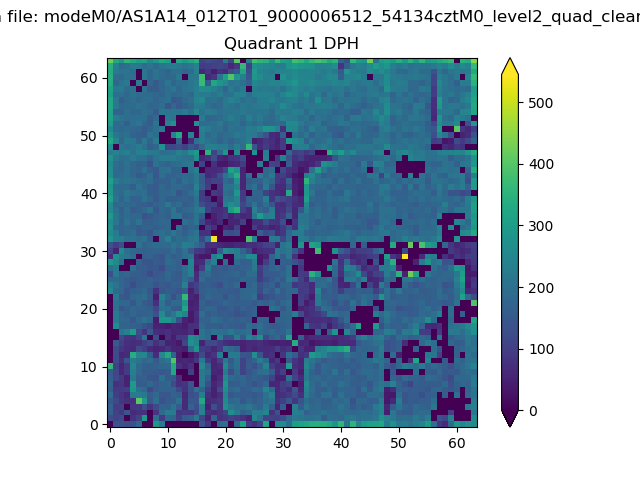 |
Quadrant B |
|---|---|---|---|
| Quadrant D | 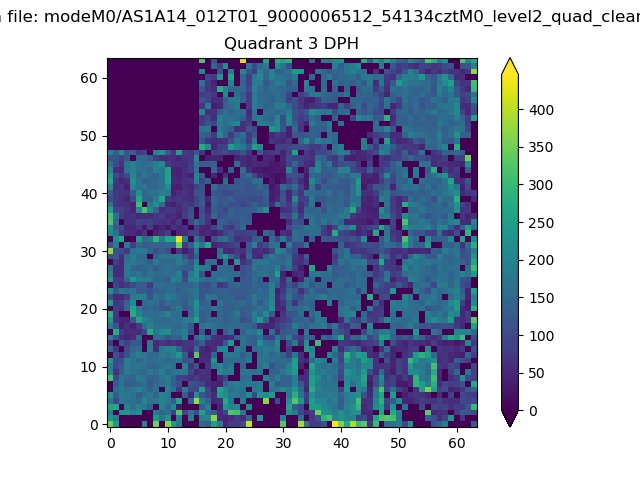 |
 |
Quadrant C |
| Plot type | Count rate plots | Images |
|---|---|---|
| Comparison with Poisson distribution Blue bars denote a histogram of data divided into 1 sec bins. Red curve is a Poisson curve with rate = median count rate of data. |
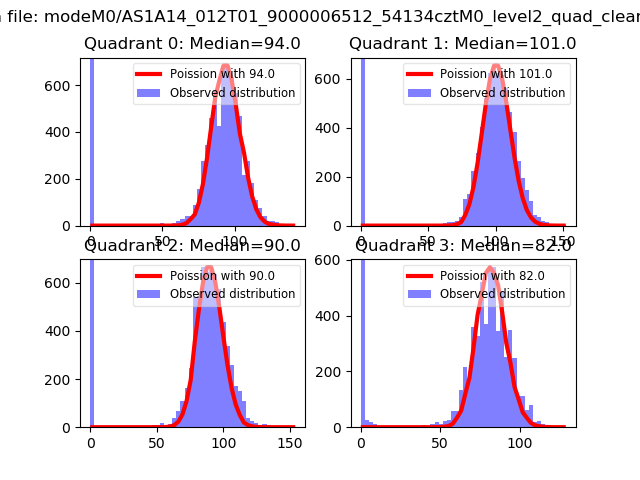 |
 |
| Quadrant-wise count rates Data is divided into 100 sec bins |
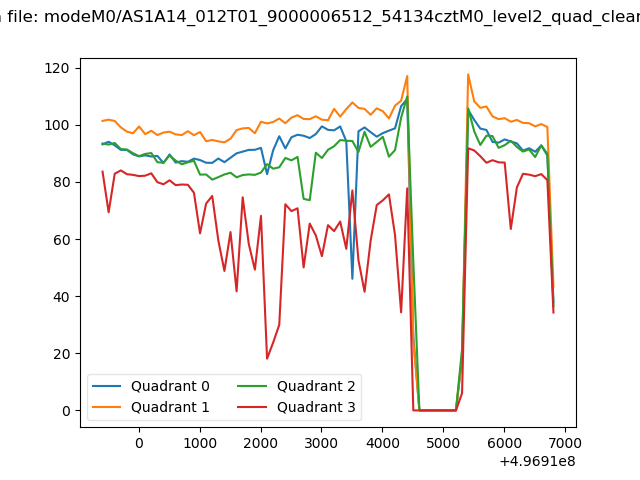 |
|
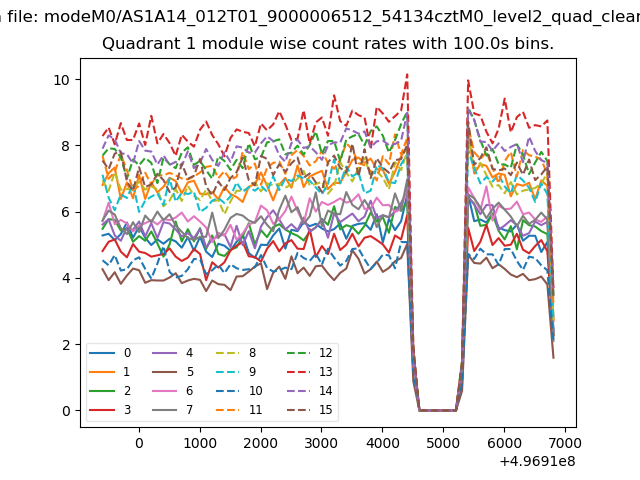
| Module-wise count rates for Quadrant A Data is divided into 100 sec bins |
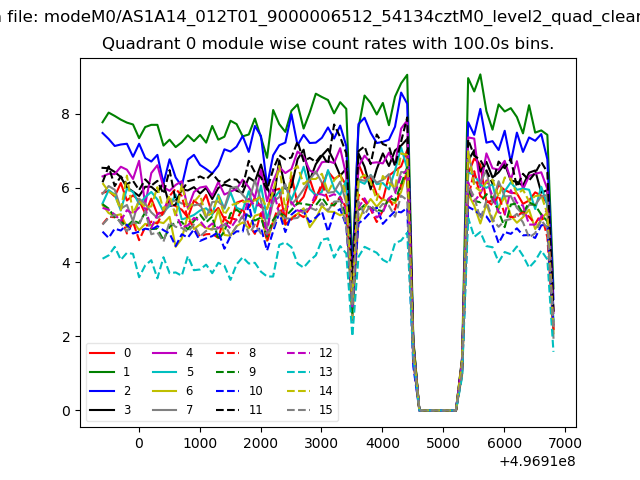 |
 |
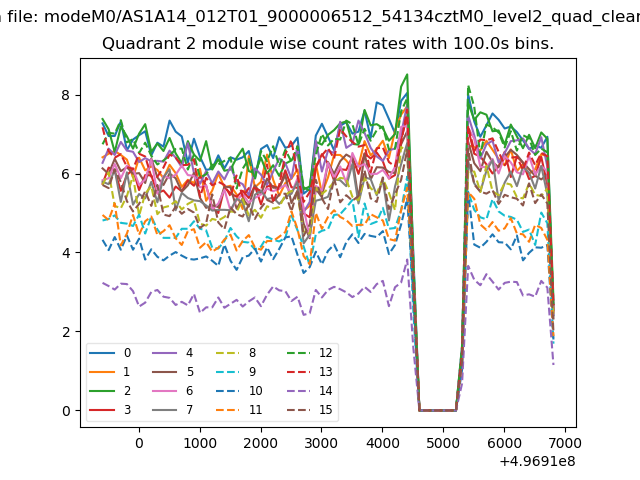
| Module-wise count rates for Quadrant B Data is divided into 100 sec bins |
 |
 |
| Module-wise count rates for Quadrant C Data is divided into 100 sec bins |
 |
 |
| Module-wise count rates for Quadrant D Data is divided into 100 sec bins |
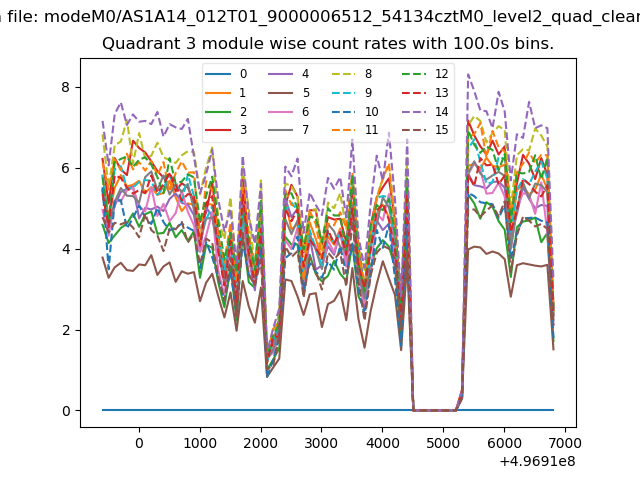 |
 |
| Parameter | Plot |
|---|---|
| CZT HV Monitor | 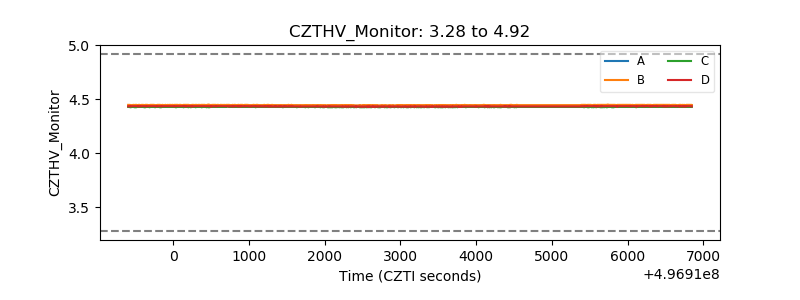 |
| D_VDD |  |
| Temperature 1 | 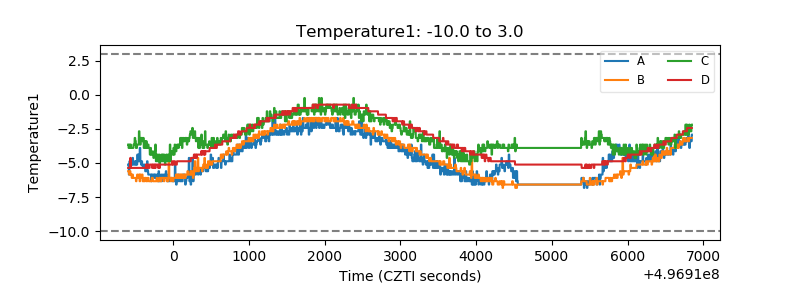 |
| Veto HV Monitor | 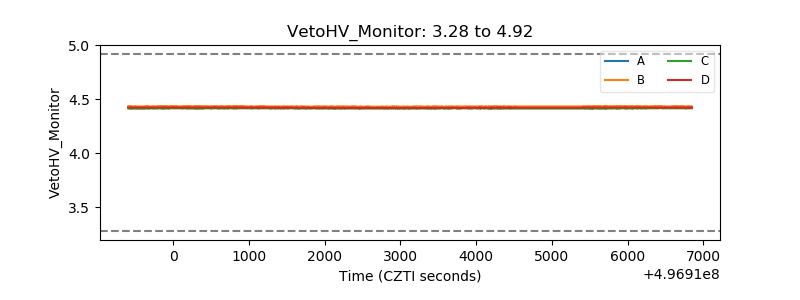 |
| Veto LLD | 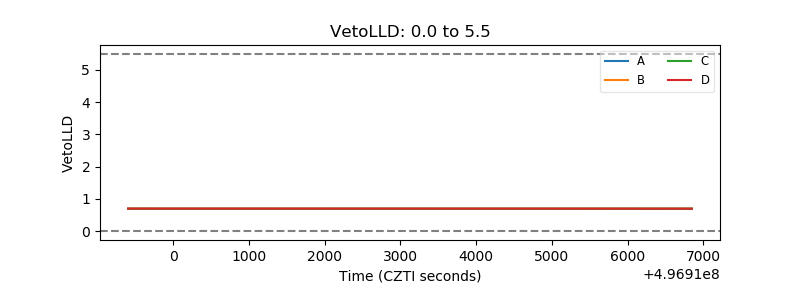 |
| Alpha Counter | 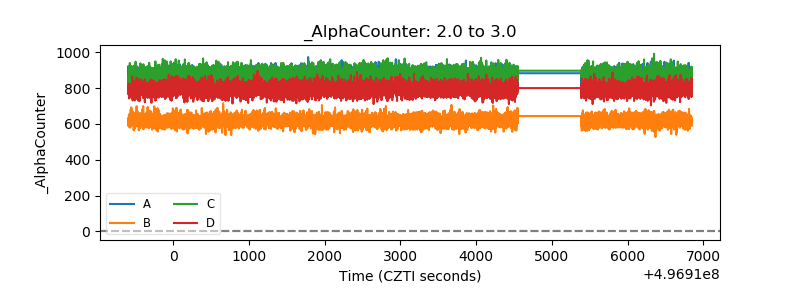 |
| _CPM_Rate | 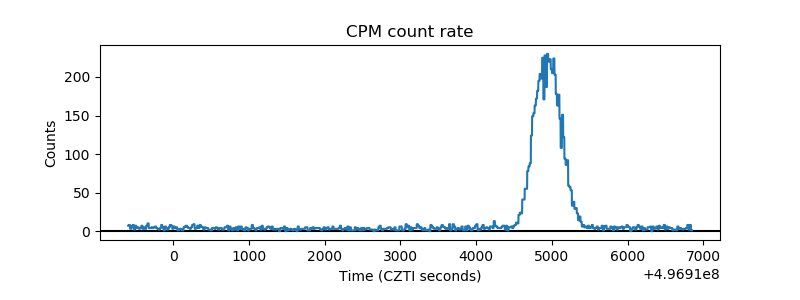 |
| CZT Counter | 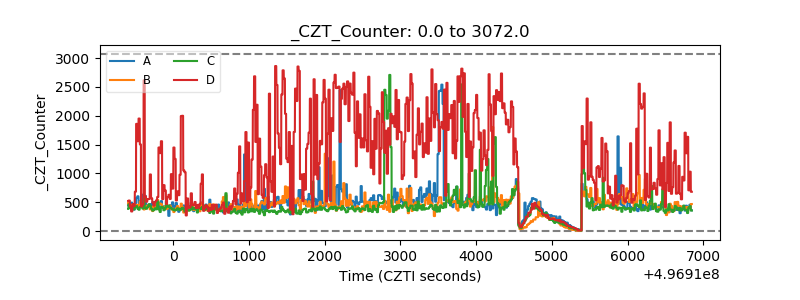 |
| +2.5 Volts monitor | 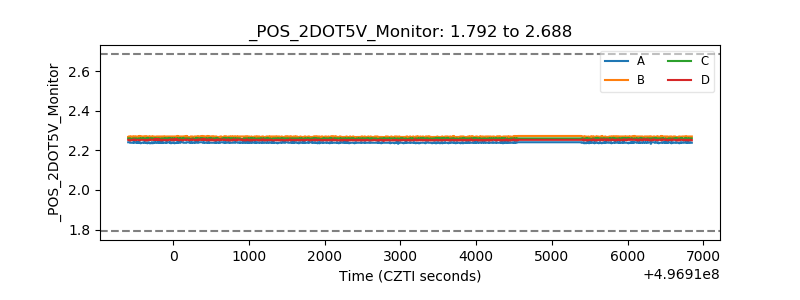 |
| +5 Volts monitor |  |
| _ROLL_ROT | 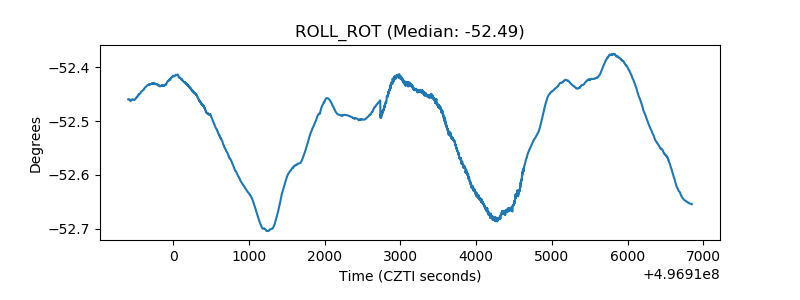 |
| _Roll_DEC | 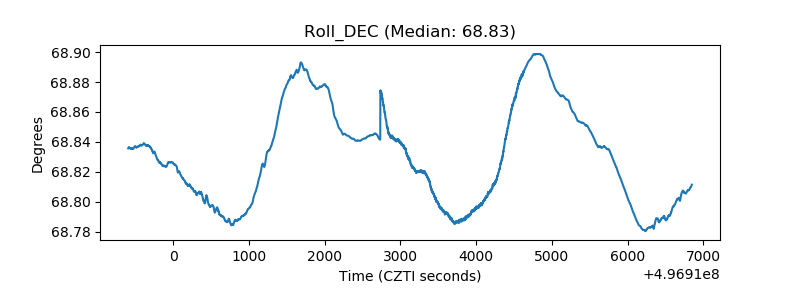 |
| _Roll_RA | 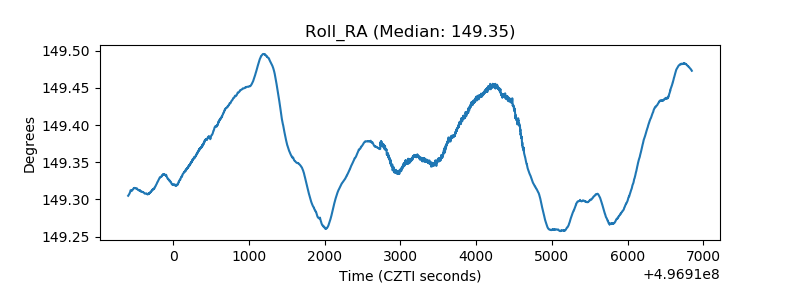 |
| Veto Counter | 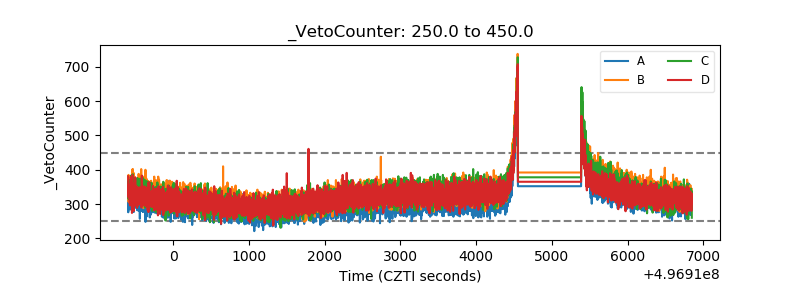 |