| Param | Original file | Final file |
|---|---|---|
| Filename | modeM0/AS1A14_012T01_9000006512_54136cztM0_level2.fits | modeM0/AS1A14_012T01_9000006512_54136cztM0_level2_quad_clean.evt |
| Size (bytes) | 586,270,080 | 94,533,120 |
| Size | 559.1 MB | 90.2 MB |
| Events in quadrant A | 3,207,256 | 657,766 |
| Events in quadrant B | 3,895,642 | 692,650 |
| Events in quadrant C | 4,114,838 | 605,514 |
| Events in quadrant D | 9,960,306 | 435,725 |
| Mode SS | |||
|---|---|---|---|
| Quadrant | BADHDUFLAG | Total packets | Discarded packets |
| A | 0 | 138 | 0 |
| B | 0 | 138 | 0 |
| C | 0 | 138 | 0 |
| D | 0 | 138 | 0 |
| Mode M0 | |||
|---|---|---|---|
| Quadrant | BADHDUFLAG | Total packets | Discarded packets |
| A | 0 | 14344 | 2 |
| B | 0 | 16136 | 2 |
| C | 0 | 17337 | 2 |
| D | 0 | 34315 | 2 |
| Mode M9 | |||
|---|---|---|---|
| Quadrant | BADHDUFLAG | Total packets | Discarded packets |
| A | 0 | 10 | 0 |
| B | 0 | 10 | 0 |
| C | 0 | 10 | 0 |
| D | 0 | 10 | 0 |
| Quadrant | Total seconds | Saturated seconds | Saturation percentage |
|---|---|---|---|
| A | 6747 | 67 | 0.993034% |
| B | 6748 | 187 | 2.771191% |
| C | 6748 | 358 | 5.305276% |
| D | 6748 | 2037 | 30.186722% |
Noise dominated data is calculated using 1-second bins in cleaned event files. If a bin has >2000 counts, and if more than 50% of those come from <1% of pixels, then it is considered to be noise-dominated and hence unusable.
| Quadrant | # 1 sec bins | Bins with >0 counts | Bins with >2000 counts | High rate bins dominated by noise | Noise dominated (total time) | Noise dominated (detector-on time) | Marked lightcurve |
|---|---|---|---|---|---|---|---|
| A | 7717 | 6747 | 9 | 9 | 0.12% | 0.13% | 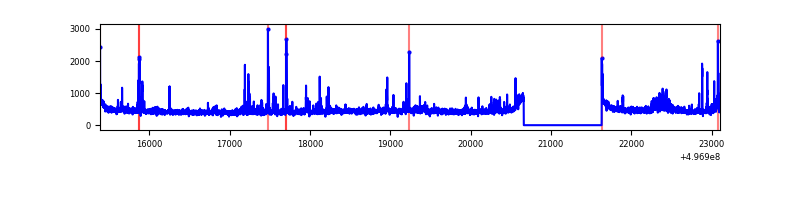 |
| B | 7718 | 6749 | 110 | 110 | 1.43% | 1.63% | 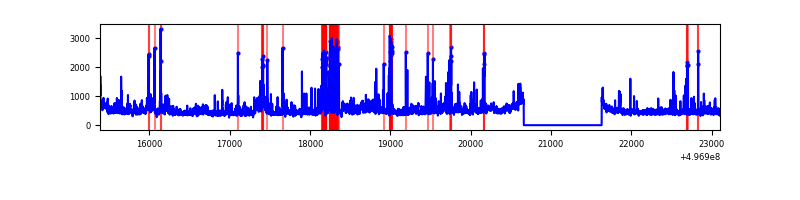 |
| C | 7718 | 6749 | 335 | 335 | 4.34% | 4.96% | 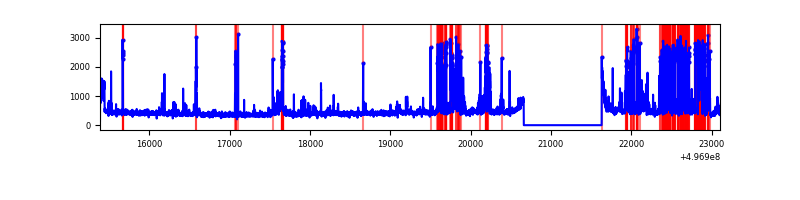 |
| D | 7718 | 6748 | 2041 | 2041 | 26.44% | 30.25% | 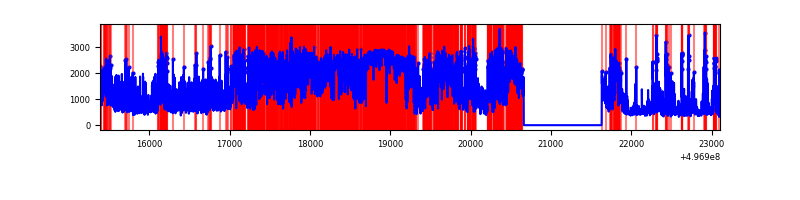 |
Top three noisy pixels from each quadrant. If the there are fewer than three noisy pixels in the level2.evt file, extra rows are filled as -1
| Pixel properties | Quadrant properties | ||||||
|---|---|---|---|---|---|---|---|
| Quadrant | DetID | PixID | Counts | Sigma | Mean | Median | Sigma |
| A | 15 | 174 | 120932 | 674.86 | 721 | 702 | 178.2 |
| A | 4 | 3 | 67508 | 374.99 | 721 | 702 | 178.2 |
| A | 7 | 158 | 50722 | 280.77 | 721 | 702 | 178.2 |
| B | 5 | 236 | 498080 | 3289.16 | 702 | 678 | 151.2 |
| B | 15 | 20 | 198261 | 1306.55 | 702 | 678 | 151.2 |
| B | 10 | 245 | 85395 | 560.21 | 702 | 678 | 151.2 |
| C | 13 | 3 | 1064286 | 5648.4 | 679 | 673 | 188.3 |
| C | 12 | 252 | 119929 | 633.32 | 679 | 673 | 188.3 |
| C | 1 | 16 | 107943 | 569.67 | 679 | 673 | 188.3 |
| D | 7 | 70 | 4530447 | 25907.62 | 611 | 580 | 174.8 |
| D | 2 | 165 | 1279549 | 7314.79 | 611 | 580 | 174.8 |
| D | 8 | 176 | 1072583 | 6131.09 | 611 | 580 | 174.8 |
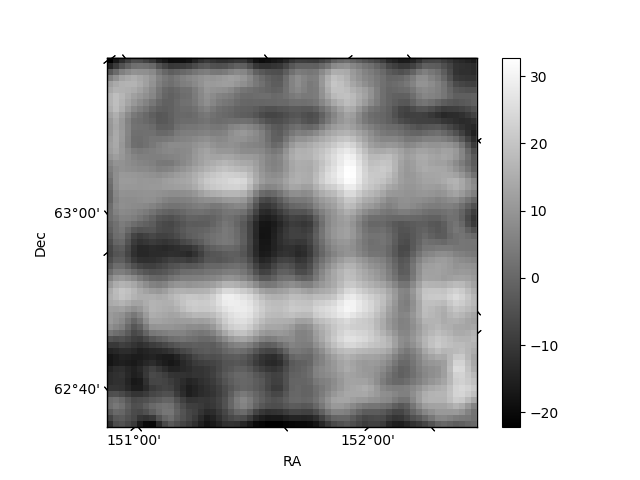
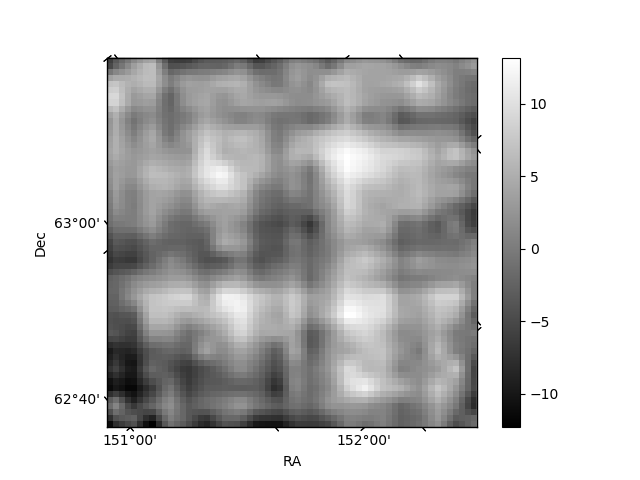
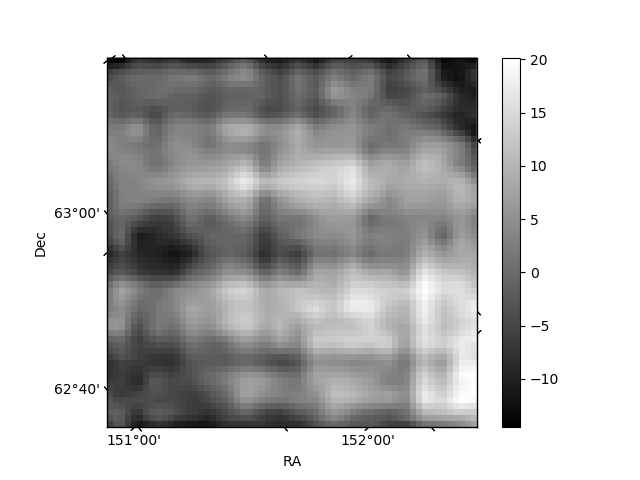
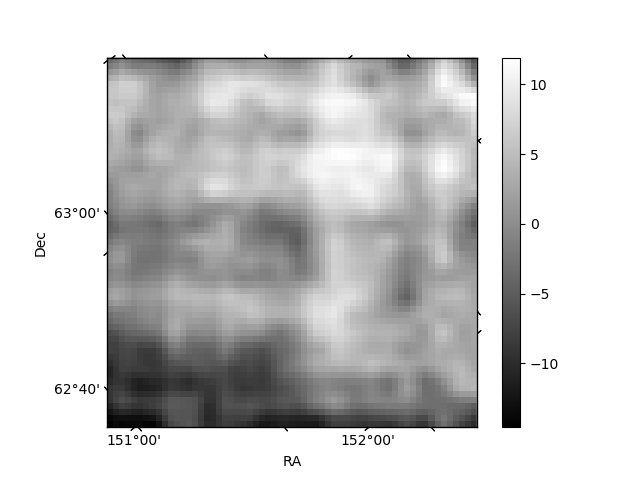
Histogram calculated using DETX and DETY for each event in the final _common_clean file
| Quadrant A | 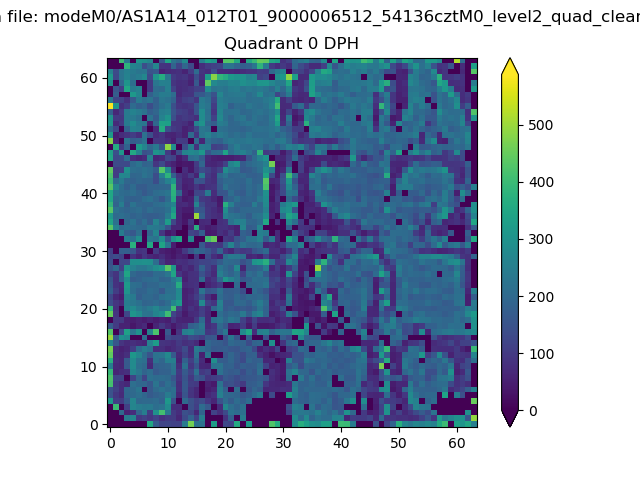 |
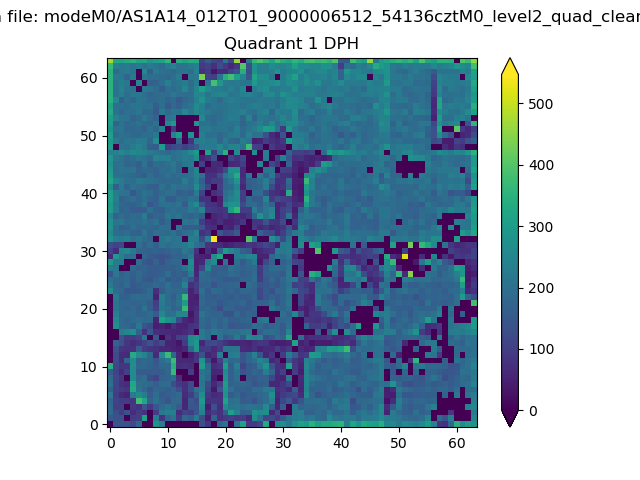 |
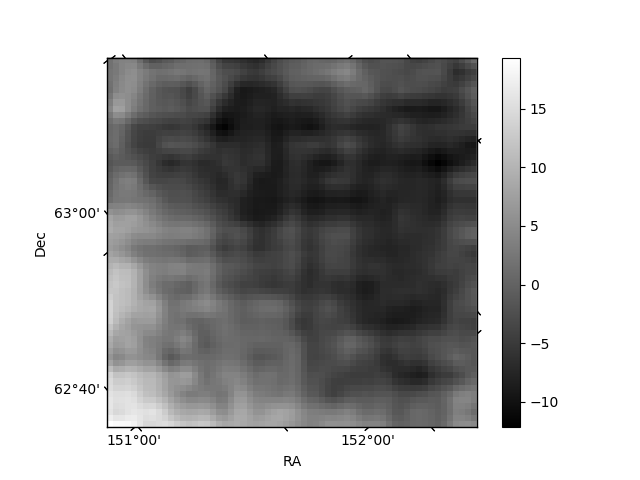
Quadrant B |
|---|---|---|---|
| Quadrant D | 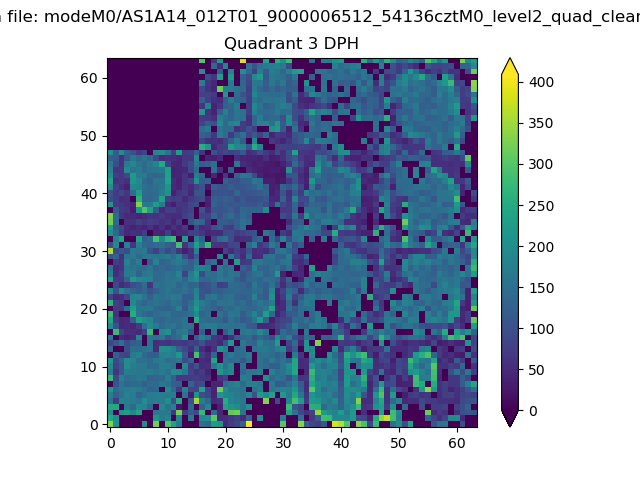 |
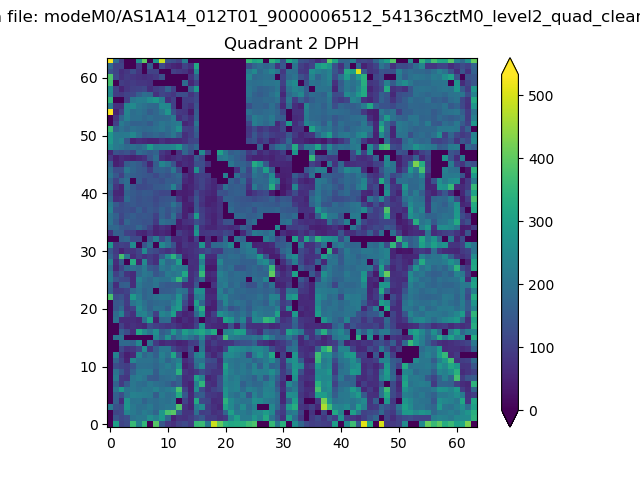 |
Quadrant C |
| Plot type | Count rate plots | Images |
|---|---|---|
| Comparison with Poisson distribution Blue bars denote a histogram of data divided into 1 sec bins. Red curve is a Poisson curve with rate = median count rate of data. |
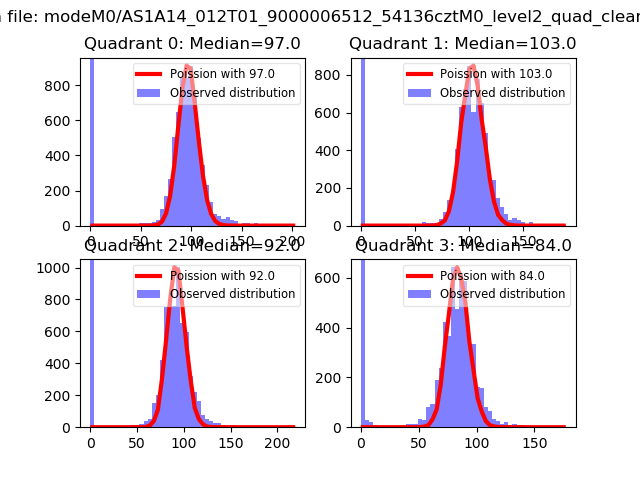 |
 |
| Quadrant-wise count rates Data is divided into 100 sec bins |
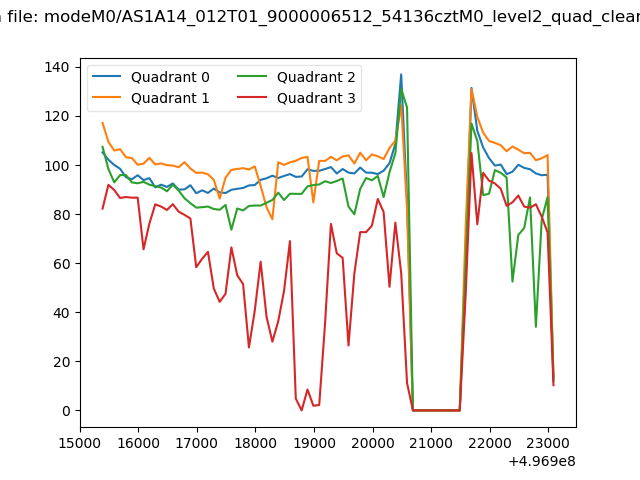 |
|
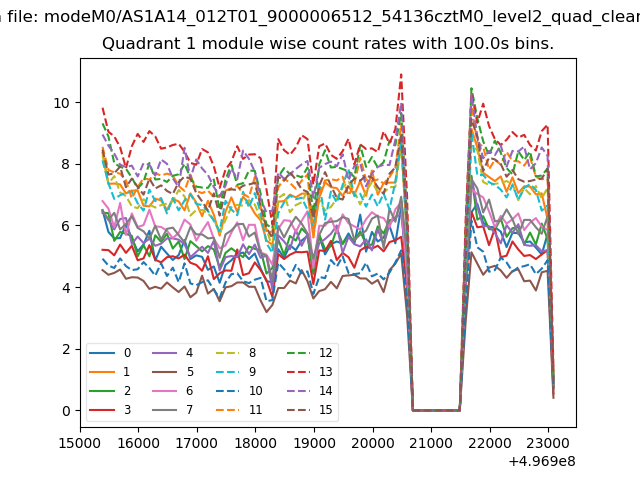
| Module-wise count rates for Quadrant A Data is divided into 100 sec bins |
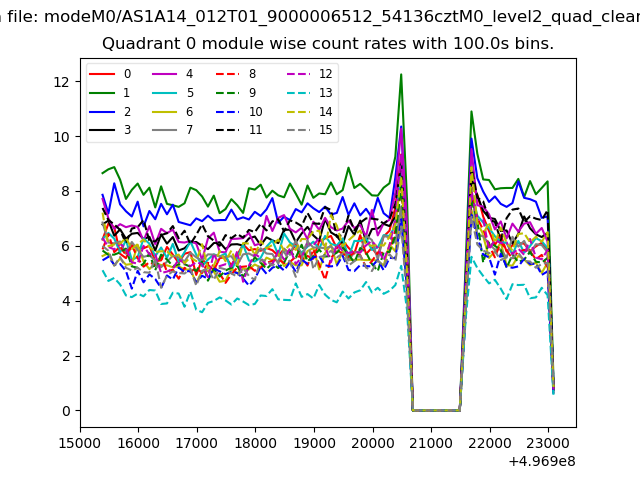 |
 |
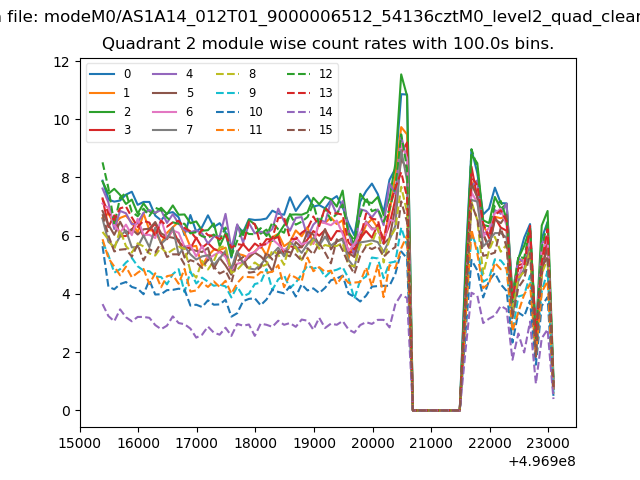
| Module-wise count rates for Quadrant B Data is divided into 100 sec bins |
 |
 |
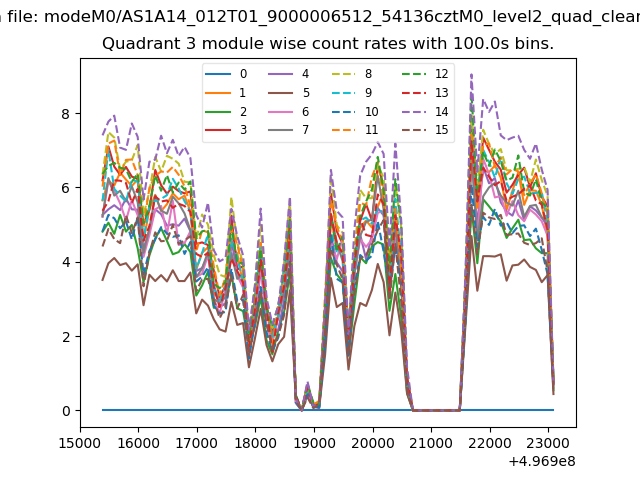
| Module-wise count rates for Quadrant C Data is divided into 100 sec bins |
 |
 |
| Module-wise count rates for Quadrant D Data is divided into 100 sec bins |
 |
 |
| Parameter | Plot |
|---|---|
| CZT HV Monitor | 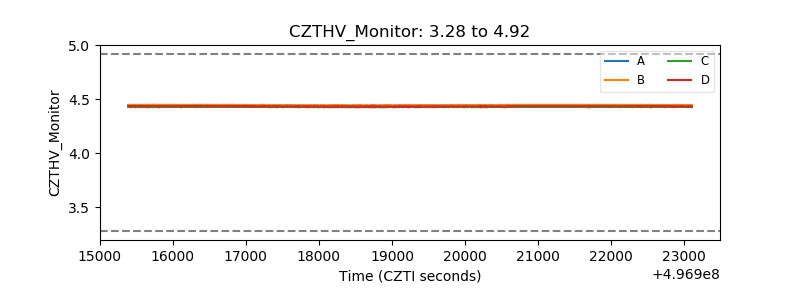 |
| D_VDD | 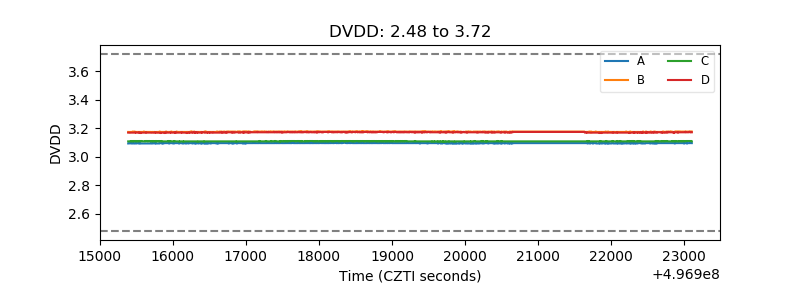 |
| Temperature 1 | 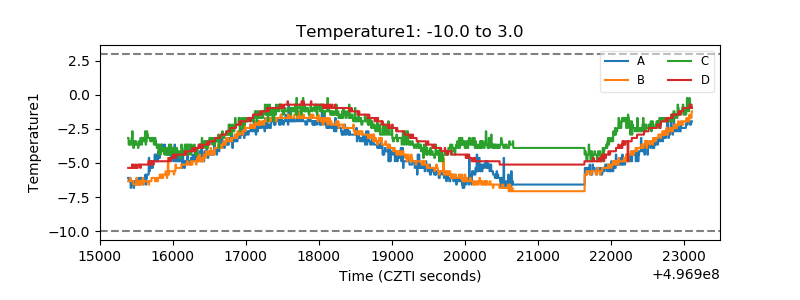 |
| Veto HV Monitor | 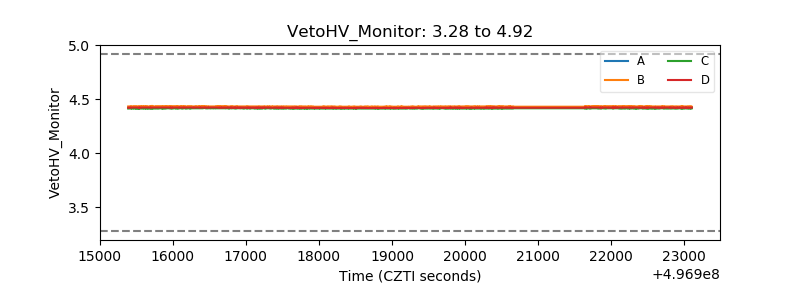 |
| Veto LLD | 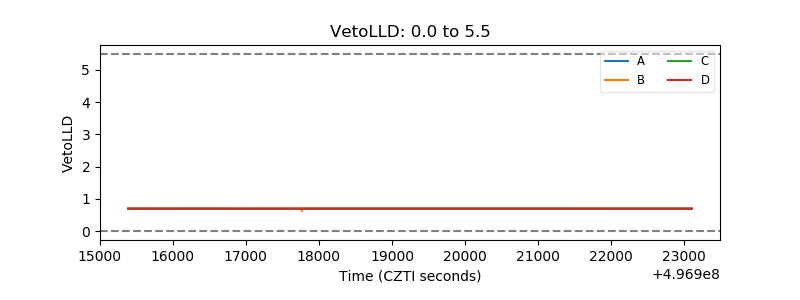 |
| Alpha Counter | 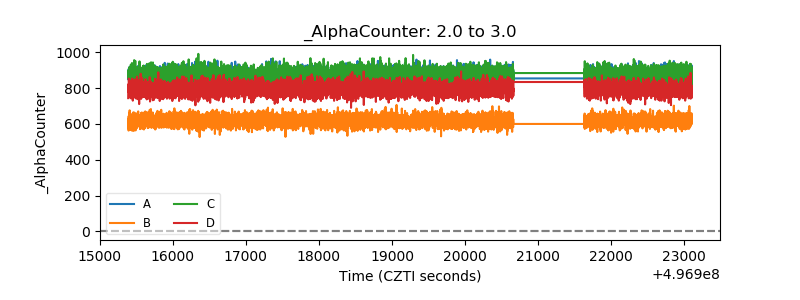 |
| _CPM_Rate | 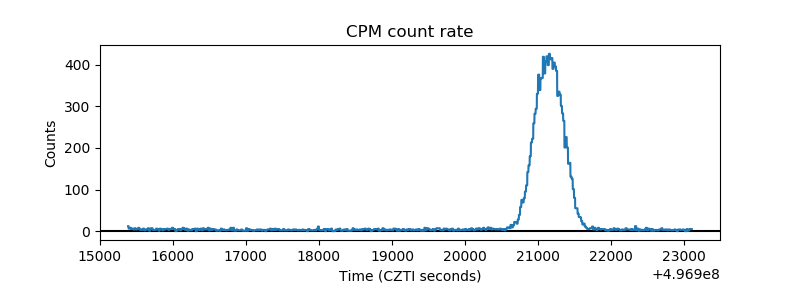 |
| CZT Counter | 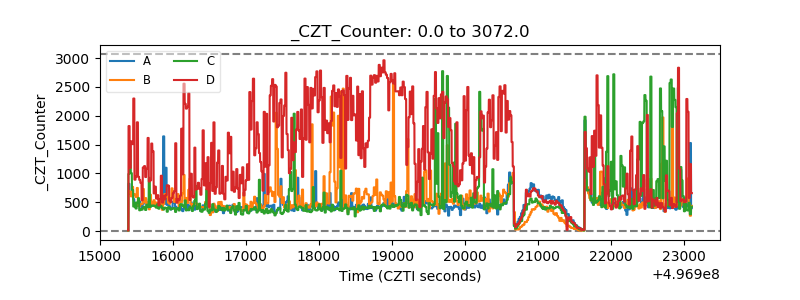 |
| +2.5 Volts monitor |  |
| +5 Volts monitor |  |
| _ROLL_ROT | 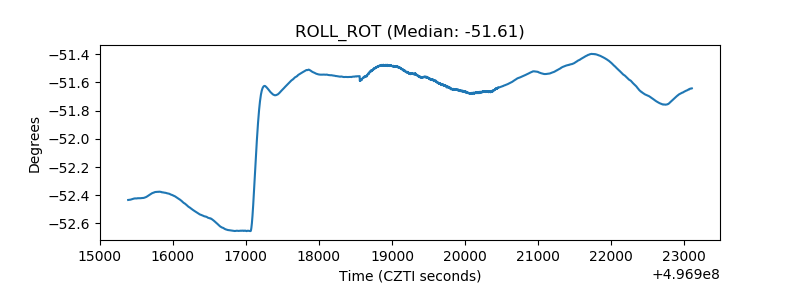 |
| _Roll_DEC | 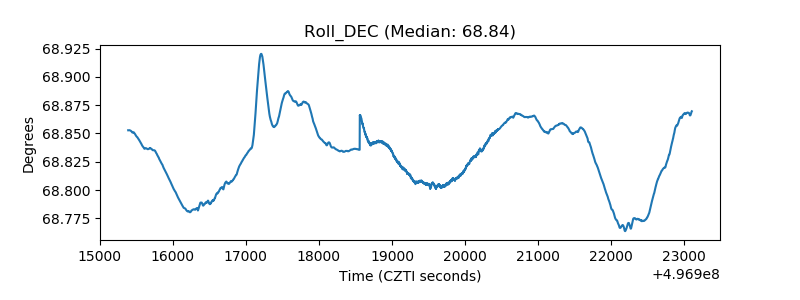 |
| _Roll_RA | 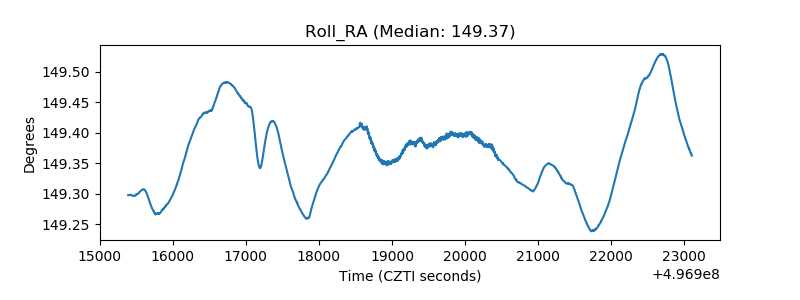 |
| Veto Counter | 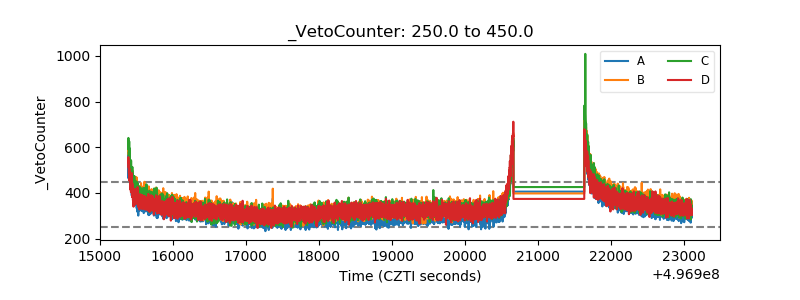 |