| Param | Original file | Final file |
|---|---|---|
| Filename | modeM0/AS1A14_012T01_9000006512_54138cztM0_level2.fits | modeM0/AS1A14_012T01_9000006512_54138cztM0_level2_quad_clean.evt |
| Size (bytes) | 490,838,400 | 91,022,400 |
| Size | 468.1 MB | 86.8 MB |
| Events in quadrant A | 3,454,120 | 614,658 |
| Events in quadrant B | 4,411,923 | 648,590 |
| Events in quadrant C | 3,197,649 | 585,231 |
| Events in quadrant D | 6,616,326 | 468,268 |
| Mode SS | |||
|---|---|---|---|
| Quadrant | BADHDUFLAG | Total packets | Discarded packets |
| A | 0 | 128 | 0 |
| B | 0 | 128 | 0 |
| C | 0 | 128 | 0 |
| D | 0 | 128 | 0 |
| Mode M0 | |||
|---|---|---|---|
| Quadrant | BADHDUFLAG | Total packets | Discarded packets |
| A | 0 | 14278 | 1 |
| B | 0 | 17351 | 1 |
| C | 0 | 14235 | 1 |
| D | 0 | 23940 | 1 |
| Mode M9 | |||
|---|---|---|---|
| Quadrant | BADHDUFLAG | Total packets | Discarded packets |
| A | 0 | 11 | 0 |
| B | 0 | 11 | 0 |
| C | 0 | 11 | 0 |
| D | 0 | 11 | 0 |
| Quadrant | Total seconds | Saturated seconds | Saturation percentage |
|---|---|---|---|
| A | 6294 | 154 | 2.446775% |
| B | 6294 | 301 | 4.782332% |
| C | 6295 | 124 | 1.969817% |
| D | 6295 | 1078 | 17.124702% |
Noise dominated data is calculated using 1-second bins in cleaned event files. If a bin has >2000 counts, and if more than 50% of those come from <1% of pixels, then it is considered to be noise-dominated and hence unusable.
| Quadrant | # 1 sec bins | Bins with >0 counts | Bins with >2000 counts | High rate bins dominated by noise | Noise dominated (total time) | Noise dominated (detector-on time) | Marked lightcurve |
|---|---|---|---|---|---|---|---|
| A | 7384 | 6294 | 73 | 73 | 0.99% | 1.16% | 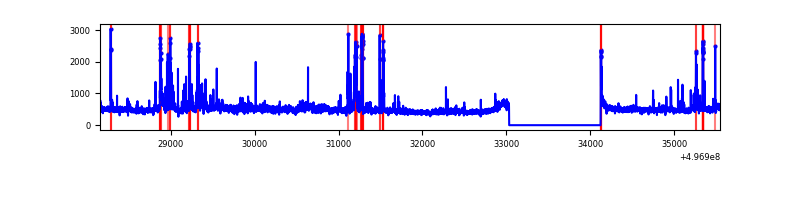 |
| B | 7384 | 6294 | 159 | 159 | 2.15% | 2.53% | 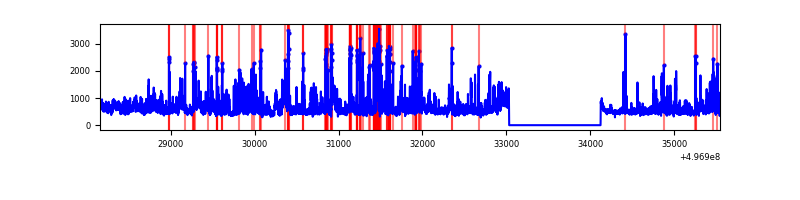 |
| C | 7385 | 6295 | 69 | 69 | 0.93% | 1.10% | 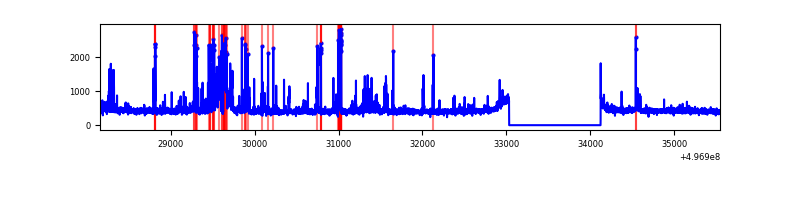 |
| D | 7384 | 6294 | 1013 | 1013 | 13.72% | 16.09% | 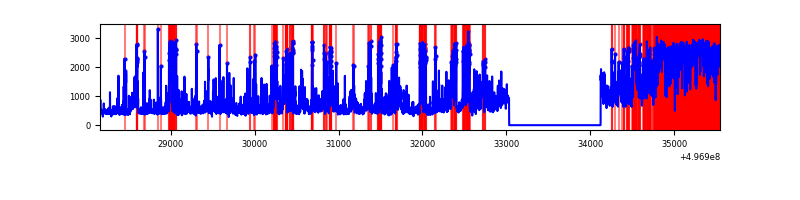 |
Top three noisy pixels from each quadrant. If the there are fewer than three noisy pixels in the level2.evt file, extra rows are filled as -1
| Pixel properties | Quadrant properties | ||||||
|---|---|---|---|---|---|---|---|
| Quadrant | DetID | PixID | Counts | Sigma | Mean | Median | Sigma |
| A | 15 | 174 | 267101 | 1596.67 | 673 | 655 | 166.9 |
| A | 3 | 14 | 235950 | 1410.0 | 673 | 655 | 166.9 |
| A | 4 | 3 | 136760 | 815.61 | 673 | 655 | 166.9 |
| B | 5 | 236 | 600360 | 4302.8 | 653 | 630 | 139.4 |
| B | 15 | 20 | 553168 | 3964.22 | 653 | 630 | 139.4 |
| B | 14 | 167 | 139281 | 994.76 | 653 | 630 | 139.4 |
| C | 13 | 3 | 413333 | 2295.76 | 653 | 646 | 179.8 |
| C | 9 | 237 | 69123 | 380.94 | 653 | 646 | 179.8 |
| C | 1 | 16 | 55822 | 306.94 | 653 | 646 | 179.8 |
| D | 8 | 176 | 2406596 | 13668.38 | 607 | 579 | 176.0 |
| D | 2 | 172 | 741455 | 4208.85 | 607 | 579 | 176.0 |
| D | 7 | 70 | 476169 | 2701.79 | 607 | 579 | 176.0 |
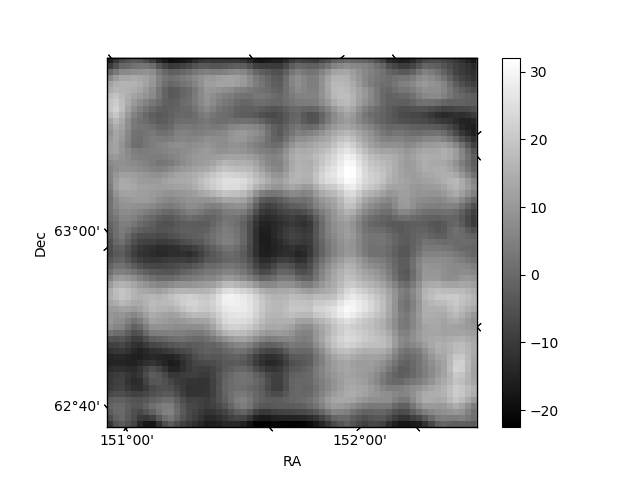
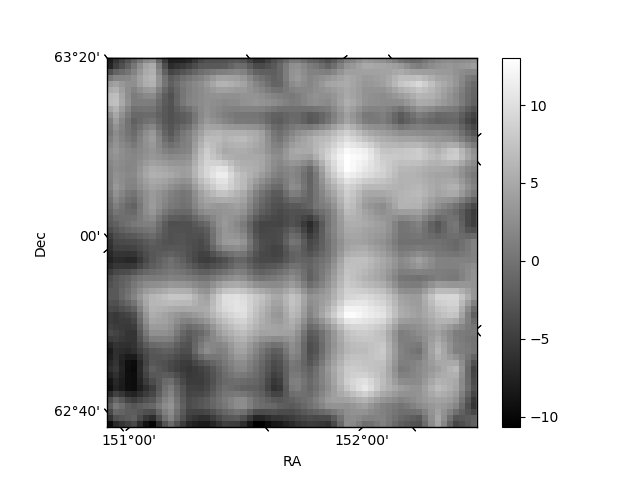
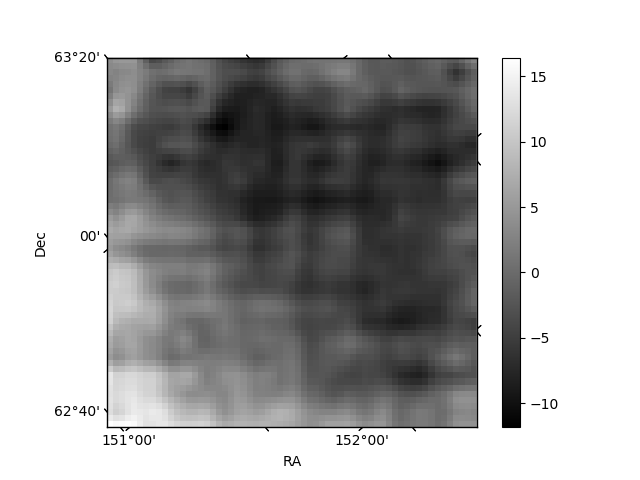
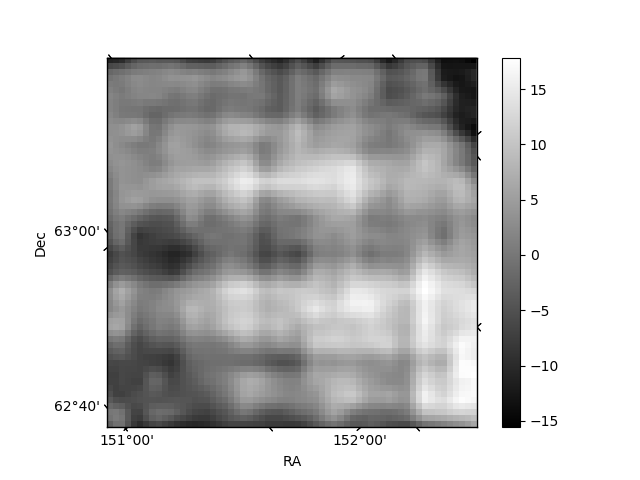
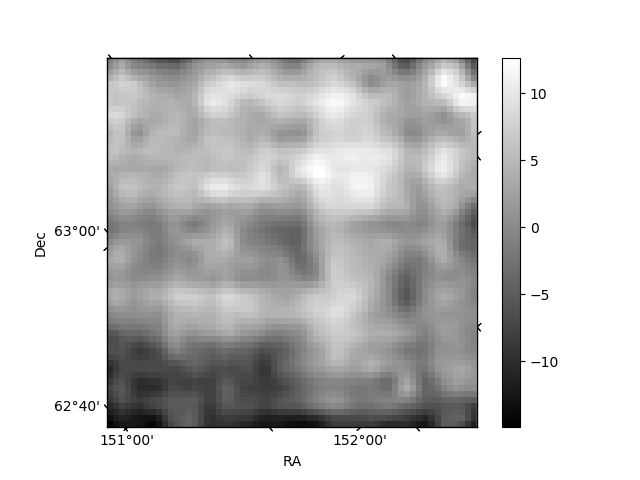
Histogram calculated using DETX and DETY for each event in the final _common_clean file
| Quadrant A | 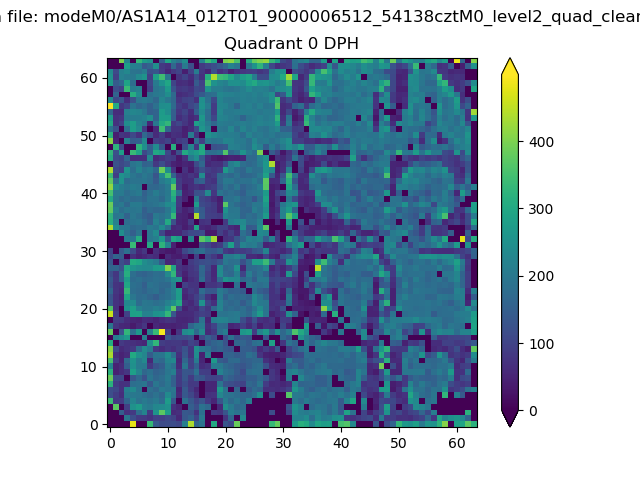 |
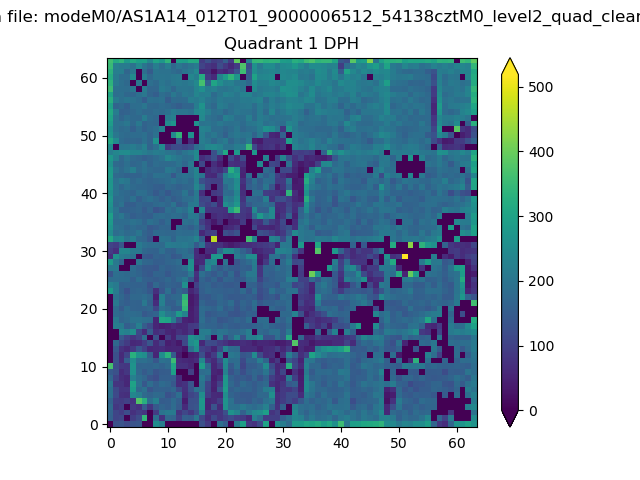 |
Quadrant B |
|---|---|---|---|
| Quadrant D | 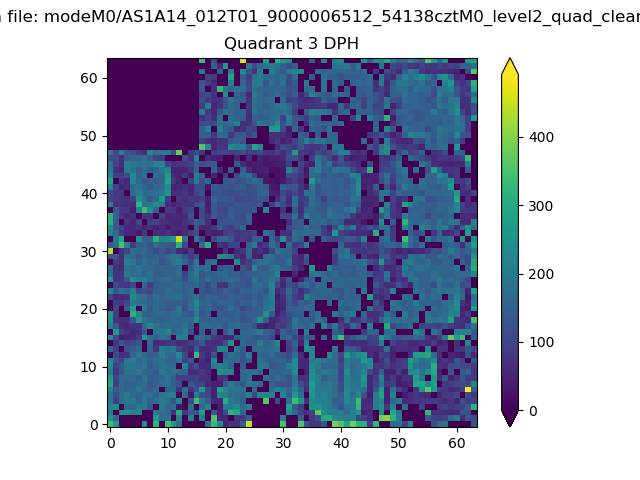 |
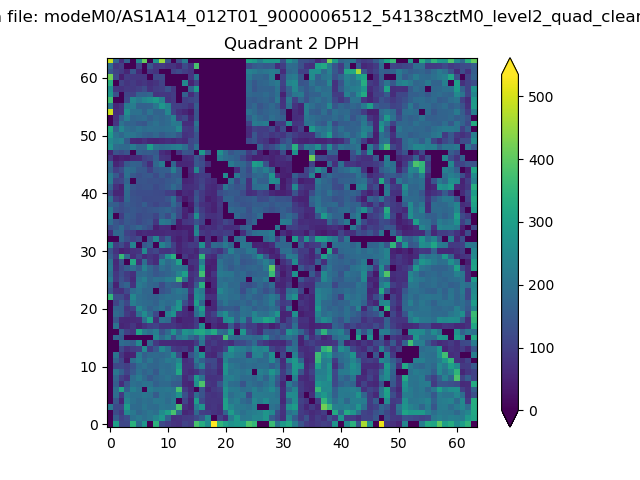 |
Quadrant C |
| Plot type | Count rate plots | Images |
|---|---|---|
| Comparison with Poisson distribution Blue bars denote a histogram of data divided into 1 sec bins. Red curve is a Poisson curve with rate = median count rate of data. |
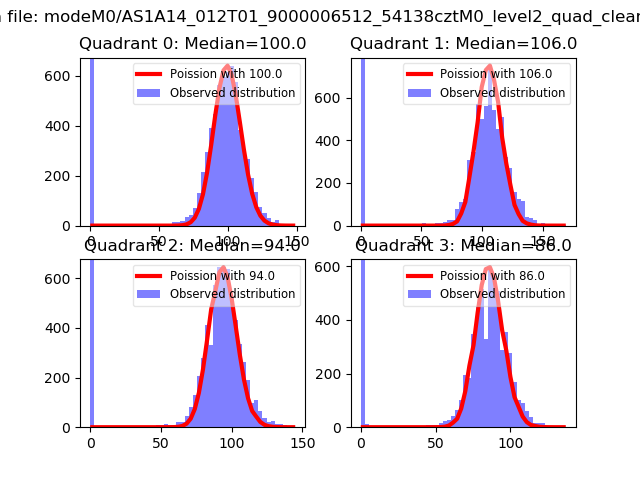 |
 |
| Quadrant-wise count rates Data is divided into 100 sec bins |
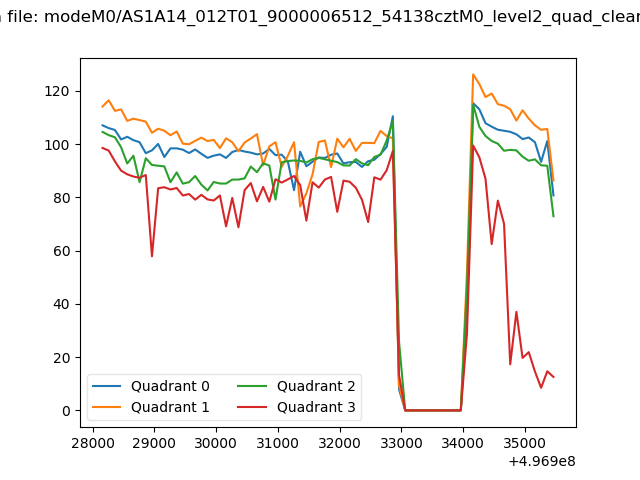 |
|
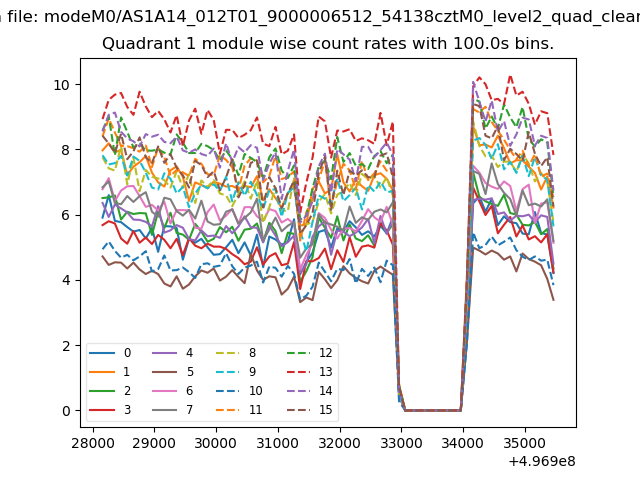
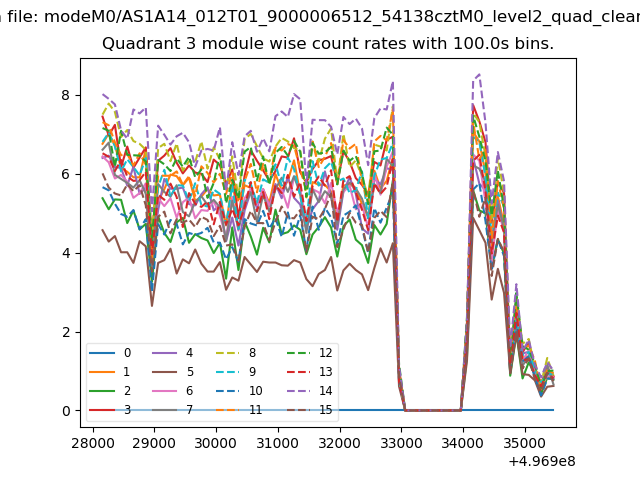
| Module-wise count rates for Quadrant A Data is divided into 100 sec bins |
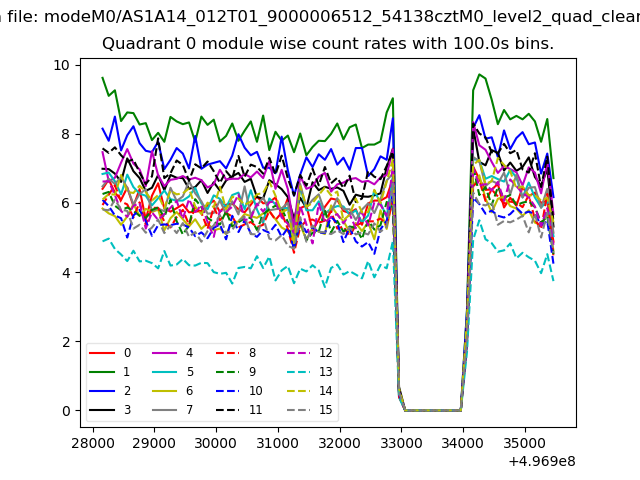 |
 |
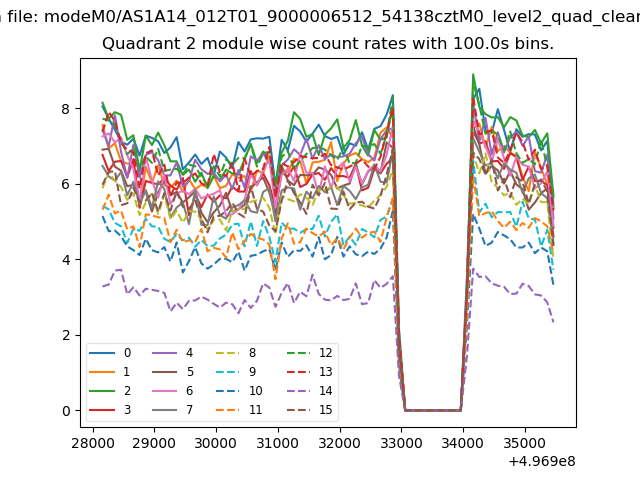
| Module-wise count rates for Quadrant B Data is divided into 100 sec bins |
 |
 |
| Module-wise count rates for Quadrant C Data is divided into 100 sec bins |
 |
 |
| Module-wise count rates for Quadrant D Data is divided into 100 sec bins |
 |
 |
| Parameter | Plot |
|---|---|
| CZT HV Monitor |  |
| D_VDD | 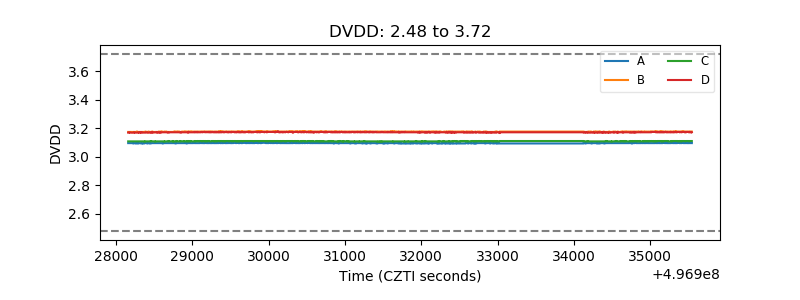 |
| Temperature 1 | 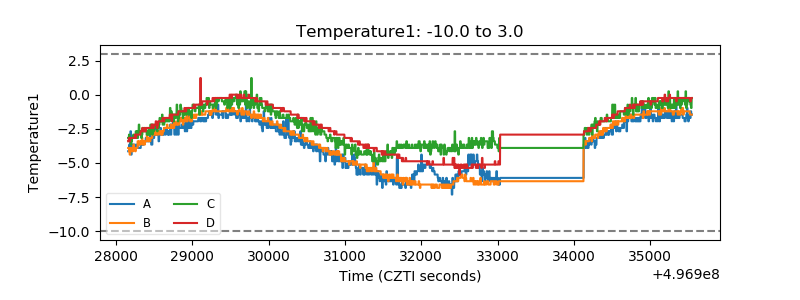 |
| Veto HV Monitor | 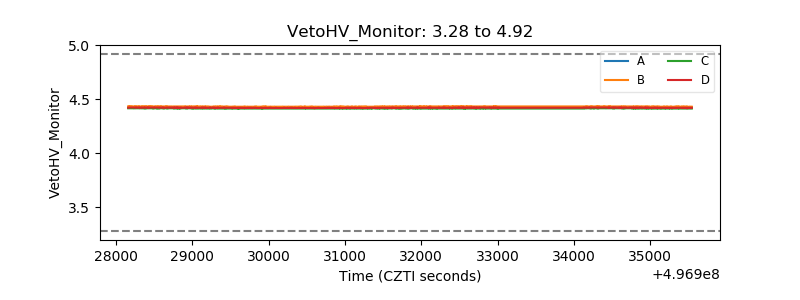 |
| Veto LLD | 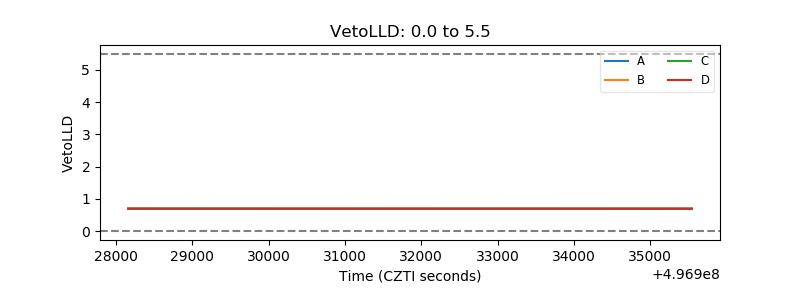 |
| Alpha Counter | 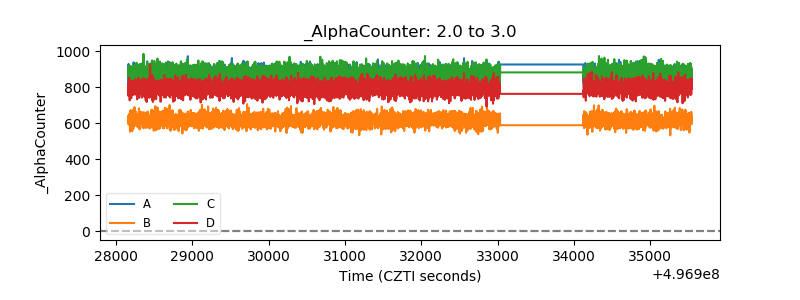 |
| _CPM_Rate | 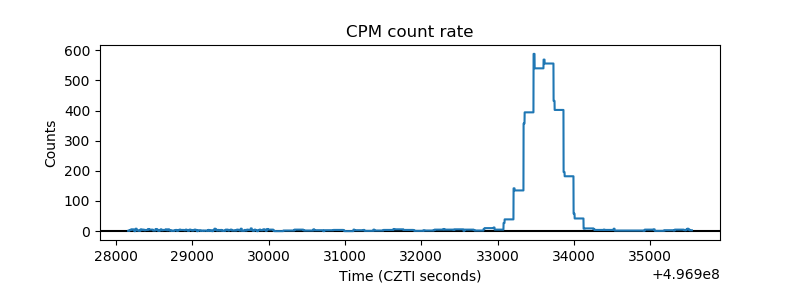 |
| CZT Counter | 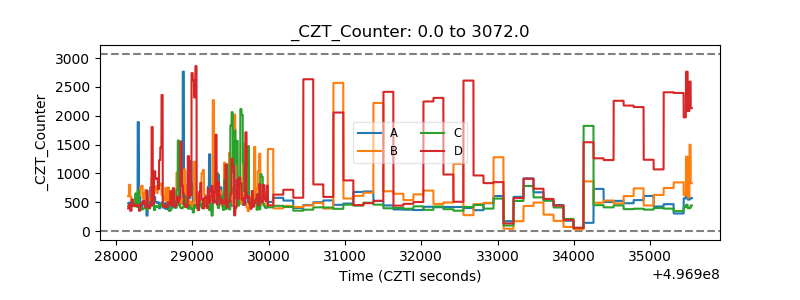 |
| +2.5 Volts monitor |  |
| +5 Volts monitor |  |
| _ROLL_ROT | 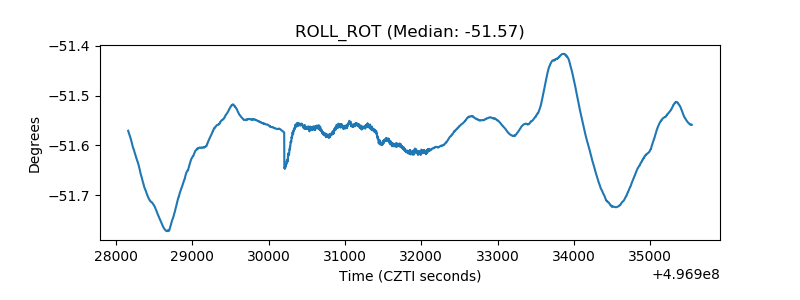 |
| _Roll_DEC | 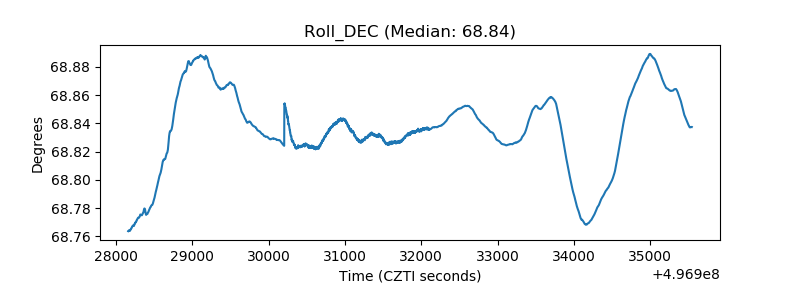 |
| _Roll_RA | 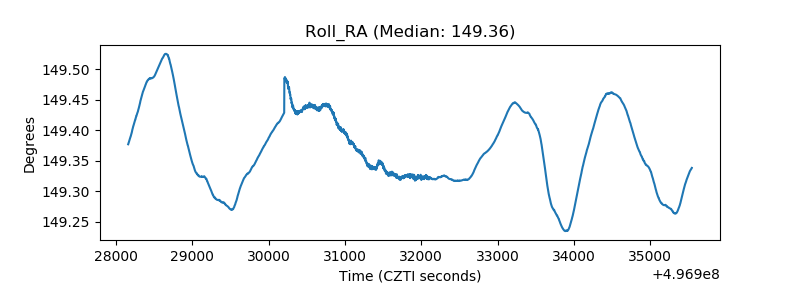 |
| Veto Counter | 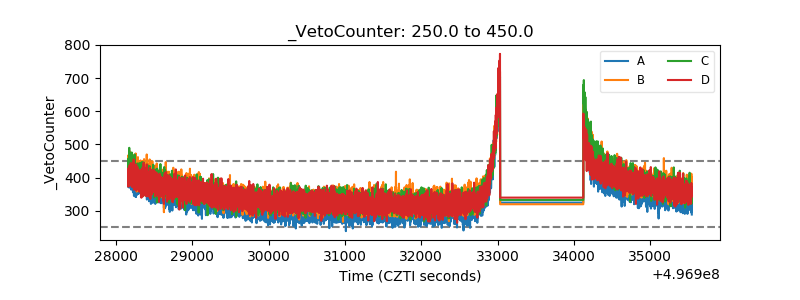 |