| Param | Original file | Final file |
|---|---|---|
| Filename | modeM0/AS1A14_012T01_9000006512_54140cztM0_level2.fits | modeM0/AS1A14_012T01_9000006512_54140cztM0_level2_quad_clean.evt |
| Size (bytes) | 520,862,400 | 88,660,800 |
| Size | 496.7 MB | 84.6 MB |
| Events in quadrant A | 3,368,896 | 612,918 |
| Events in quadrant B | 5,558,488 | 554,802 |
| Events in quadrant C | 3,099,892 | 582,382 |
| Events in quadrant D | 6,756,788 | 488,042 |
| Mode SS | |||
|---|---|---|---|
| Quadrant | BADHDUFLAG | Total packets | Discarded packets |
| A | 0 | 130 | 0 |
| B | 0 | 130 | 0 |
| C | 0 | 130 | 0 |
| D | 0 | 130 | 0 |
| Mode M0 | |||
|---|---|---|---|
| Quadrant | BADHDUFLAG | Total packets | Discarded packets |
| A | 0 | 14401 | 1 |
| B | 0 | 20932 | 1 |
| C | 0 | 14154 | 1 |
| D | 0 | 24463 | 1 |
| Mode M9 | |||
|---|---|---|---|
| Quadrant | BADHDUFLAG | Total packets | Discarded packets |
| A | 0 | 10 | 0 |
| B | 0 | 10 | 0 |
| C | 0 | 10 | 0 |
| D | 0 | 10 | 0 |
| Quadrant | Total seconds | Saturated seconds | Saturation percentage |
|---|---|---|---|
| A | 6392 | 115 | 1.799124% |
| B | 6392 | 1134 | 17.740926% |
| C | 6393 | 103 | 1.611137% |
| D | 6393 | 887 | 13.874550% |
Noise dominated data is calculated using 1-second bins in cleaned event files. If a bin has >2000 counts, and if more than 50% of those come from <1% of pixels, then it is considered to be noise-dominated and hence unusable.
| Quadrant | # 1 sec bins | Bins with >0 counts | Bins with >2000 counts | High rate bins dominated by noise | Noise dominated (total time) | Noise dominated (detector-on time) | Marked lightcurve |
|---|---|---|---|---|---|---|---|
| A | 7367 | 6392 | 53 | 53 | 0.72% | 0.83% | 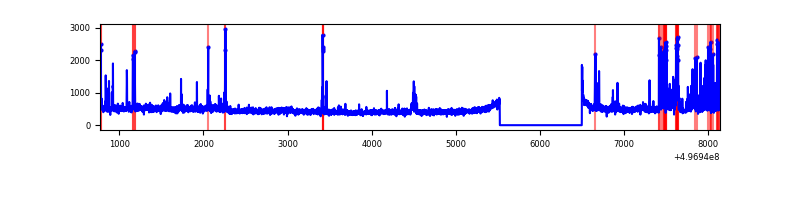 |
| B | 7367 | 6392 | 758 | 758 | 10.29% | 11.86% | 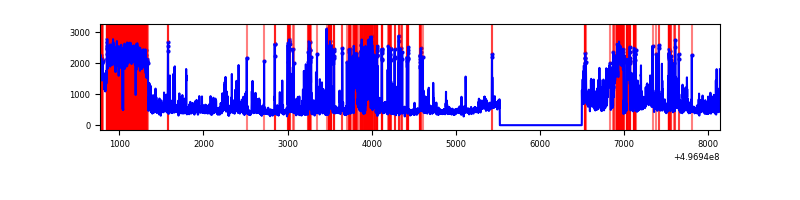 |
| C | 7368 | 6394 | 56 | 56 | 0.76% | 0.88% | 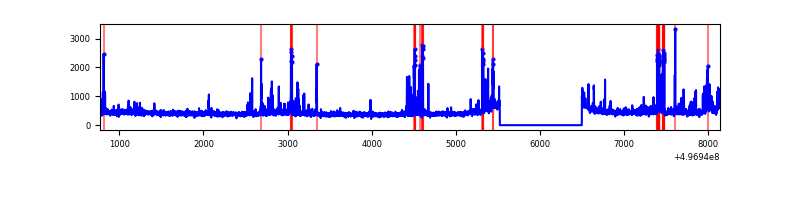 |
| D | 7368 | 6393 | 852 | 852 | 11.56% | 13.33% | 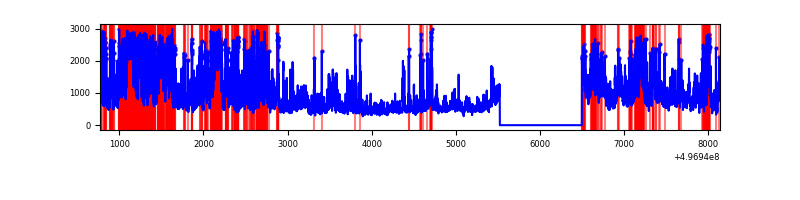 |
Top three noisy pixels from each quadrant. If the there are fewer than three noisy pixels in the level2.evt file, extra rows are filled as -1
| Pixel properties | Quadrant properties | ||||||
|---|---|---|---|---|---|---|---|
| Quadrant | DetID | PixID | Counts | Sigma | Mean | Median | Sigma |
| A | 7 | 158 | 346681 | 2083.66 | 672 | 656 | 166.1 |
| A | 3 | 14 | 153530 | 920.56 | 672 | 656 | 166.1 |
| A | 15 | 174 | 90300 | 539.81 | 672 | 656 | 166.1 |
| B | 5 | 236 | 2556554 | 19854.72 | 606 | 584 | 128.7 |
| B | 14 | 167 | 111296 | 860.01 | 606 | 584 | 128.7 |
| B | 10 | 245 | 92462 | 713.71 | 606 | 584 | 128.7 |
| C | 13 | 3 | 227065 | 1261.48 | 658 | 651 | 179.5 |
| C | 9 | 38 | 172945 | 959.95 | 658 | 651 | 179.5 |
| C | 1 | 16 | 48254 | 265.22 | 658 | 651 | 179.5 |
| D | 8 | 176 | 2225859 | 12639.19 | 619 | 590 | 176.1 |
| D | 7 | 70 | 695321 | 3945.96 | 619 | 590 | 176.1 |
| D | 2 | 62 | 601407 | 3412.55 | 619 | 590 | 176.1 |
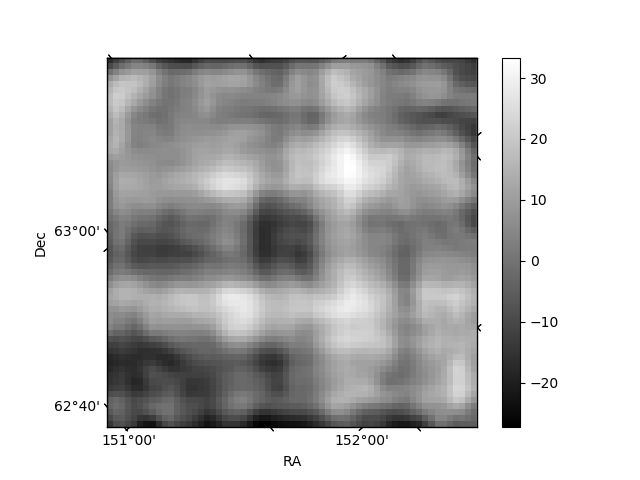
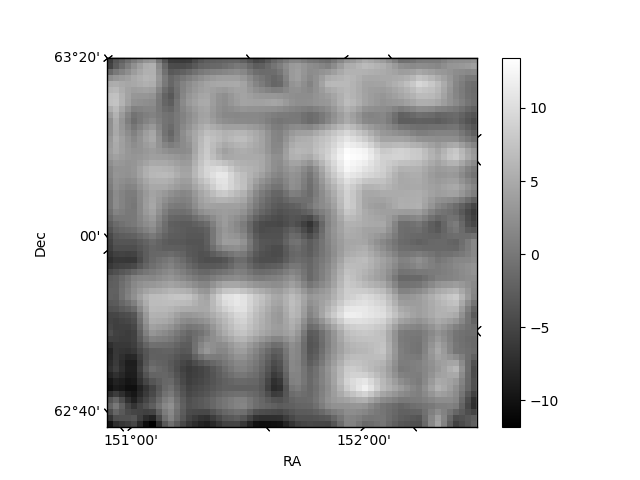
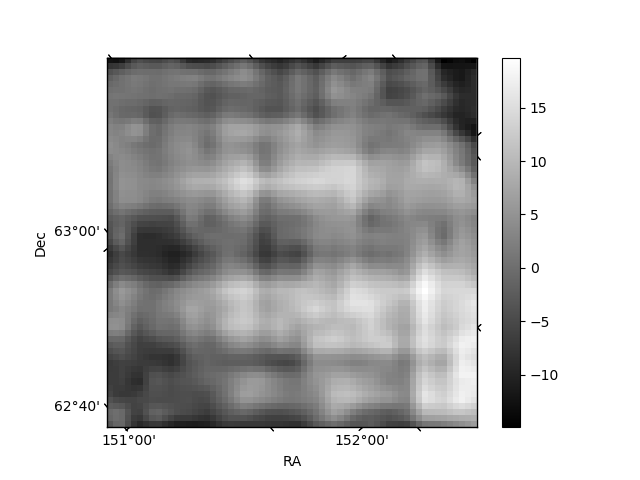
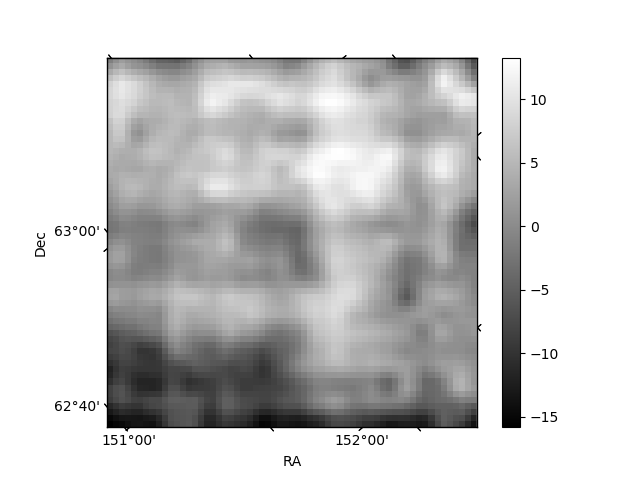
Histogram calculated using DETX and DETY for each event in the final _common_clean file
| Quadrant A | 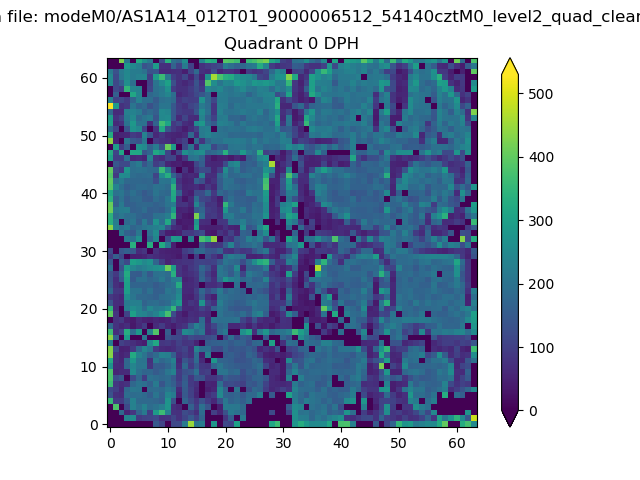 |
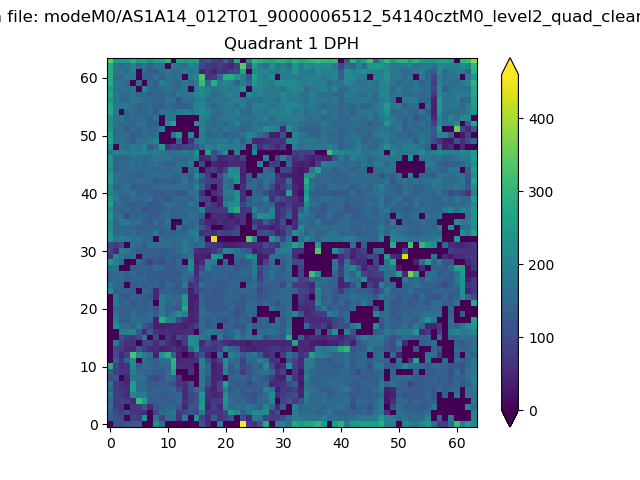 |
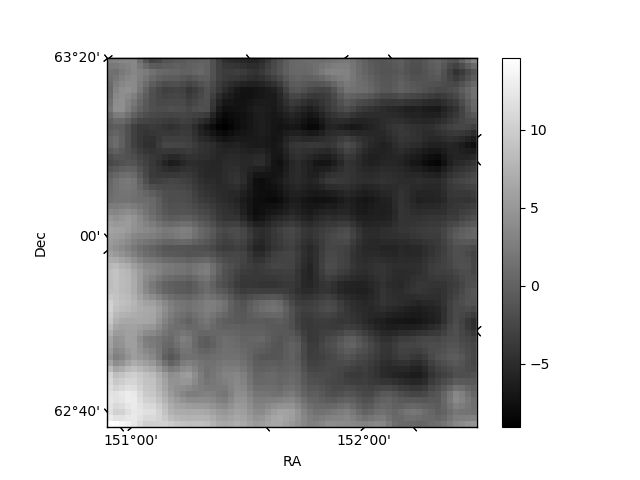
Quadrant B |
|---|---|---|---|
| Quadrant D | 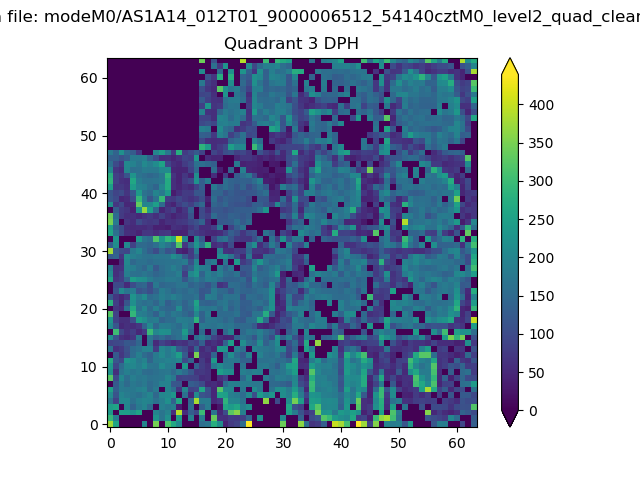 |
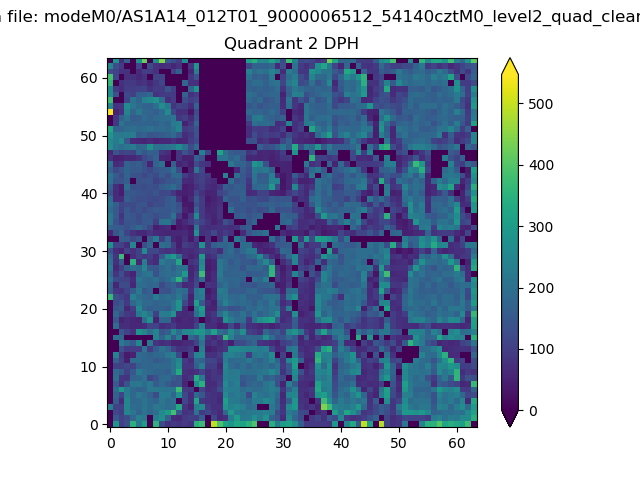 |
Quadrant C |
| Plot type | Count rate plots | Images |
|---|---|---|
| Comparison with Poisson distribution Blue bars denote a histogram of data divided into 1 sec bins. Red curve is a Poisson curve with rate = median count rate of data. |
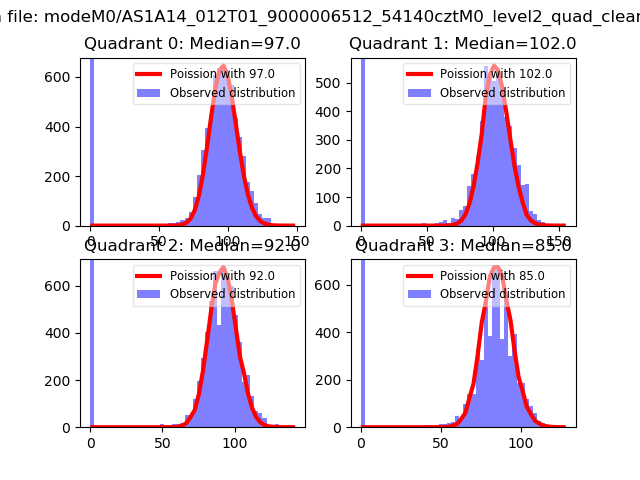 |
 |
| Quadrant-wise count rates Data is divided into 100 sec bins |
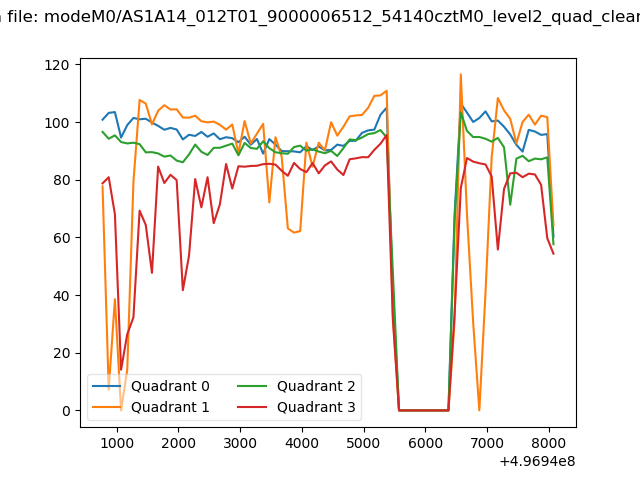 |
|
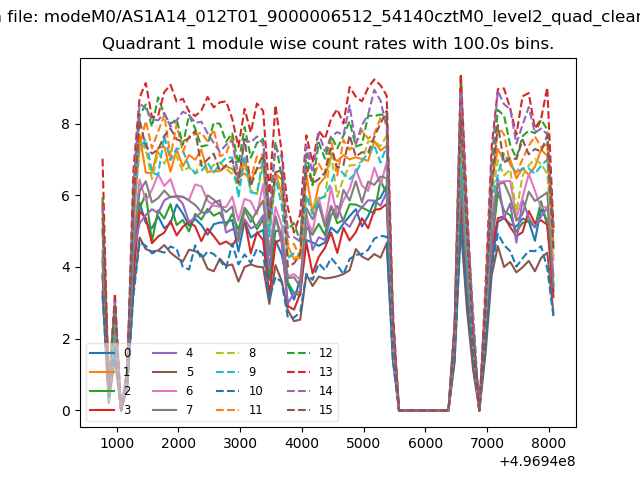
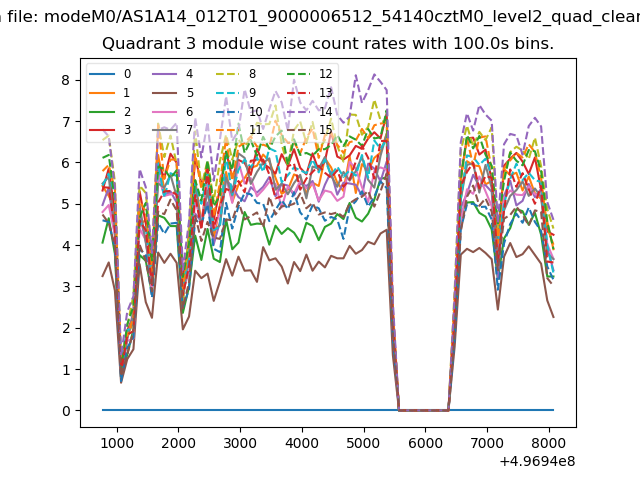
| Module-wise count rates for Quadrant A Data is divided into 100 sec bins |
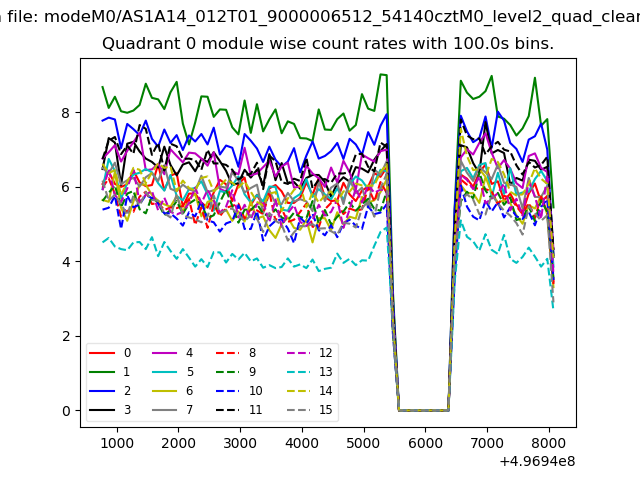 |
 |
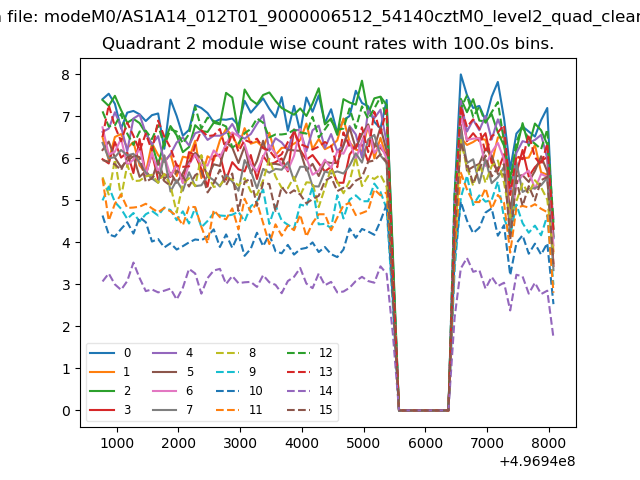
| Module-wise count rates for Quadrant B Data is divided into 100 sec bins |
 |
 |
| Module-wise count rates for Quadrant C Data is divided into 100 sec bins |
 |
 |
| Module-wise count rates for Quadrant D Data is divided into 100 sec bins |
 |
 |
| Parameter | Plot |
|---|---|
| CZT HV Monitor |  |
| D_VDD | 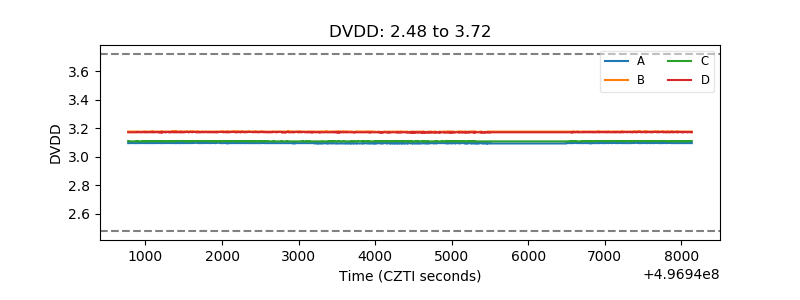 |
| Temperature 1 | 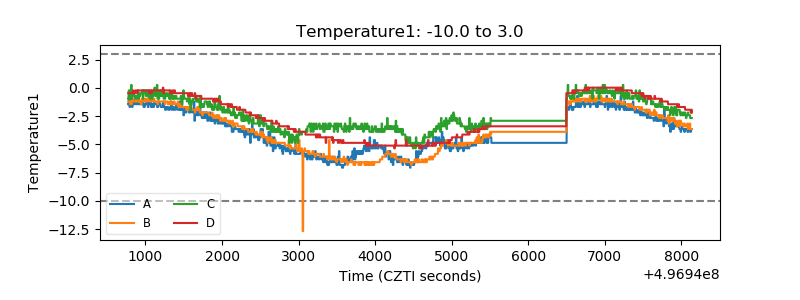 |
| Veto HV Monitor | 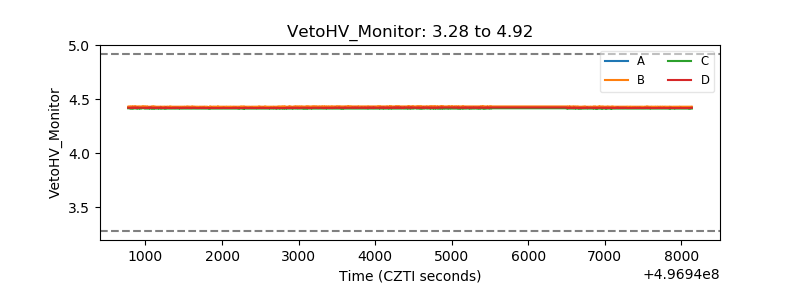 |
| Veto LLD | 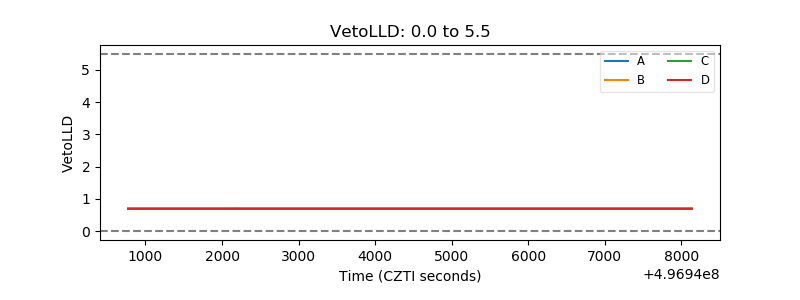 |
| Alpha Counter | 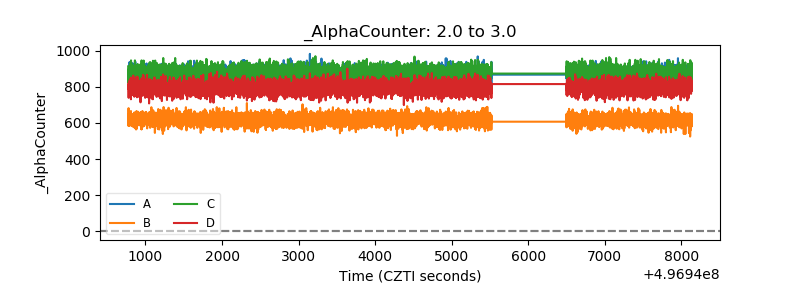 |
| _CPM_Rate | 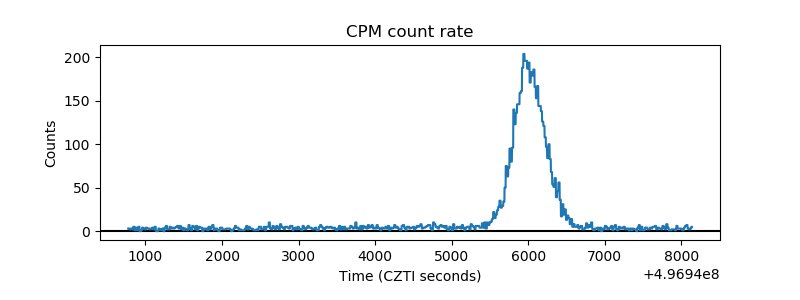 |
| CZT Counter | 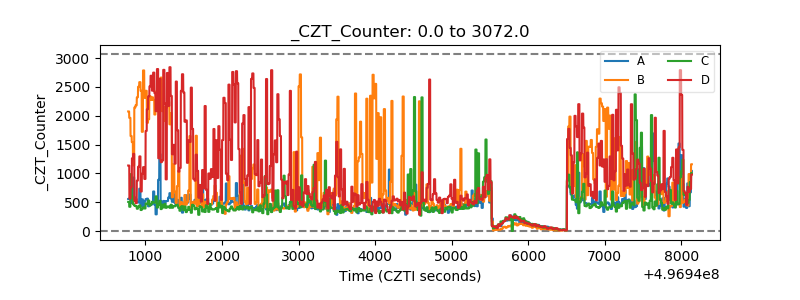 |
| +2.5 Volts monitor |  |
| +5 Volts monitor |  |
| _ROLL_ROT | 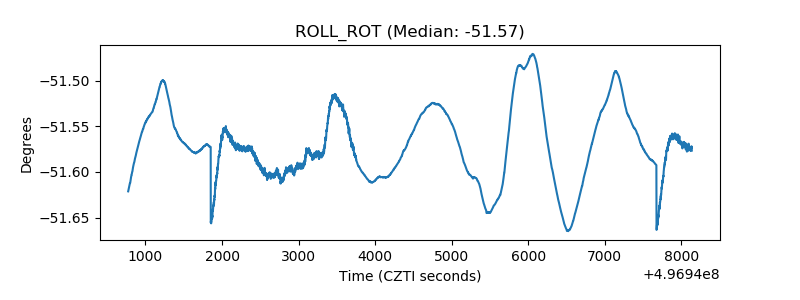 |
| _Roll_DEC | 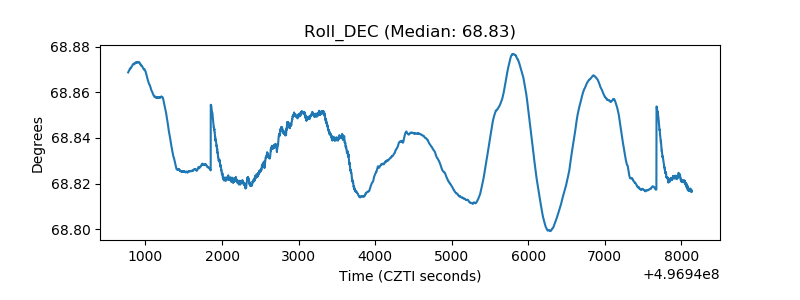 |
| _Roll_RA | 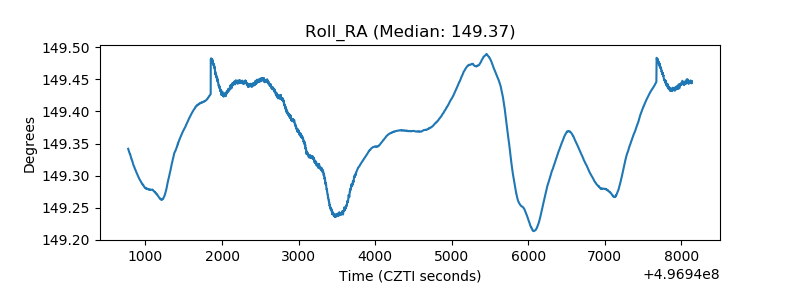 |
| Veto Counter | 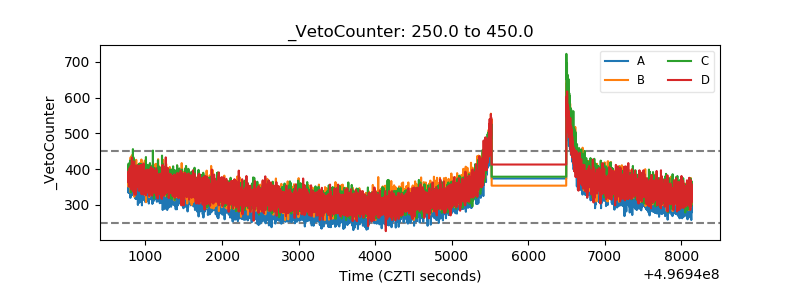 |