| Param | Original file | Final file |
|---|---|---|
| Filename | modeM0/AS1A14_012T01_9000006512_54141cztM0_level2.fits | modeM0/AS1A14_012T01_9000006512_54141cztM0_level2_quad_clean.evt |
| Size (bytes) | 491,610,240 | 93,260,160 |
| Size | 468.8 MB | 88.9 MB |
| Events in quadrant A | 3,401,312 | 620,703 |
| Events in quadrant B | 4,072,679 | 634,452 |
| Events in quadrant C | 4,120,939 | 586,413 |
| Events in quadrant D | 6,093,117 | 524,230 |
| Mode SS | |||
|---|---|---|---|
| Quadrant | BADHDUFLAG | Total packets | Discarded packets |
| A | 0 | 134 | 0 |
| B | 0 | 134 | 0 |
| C | 0 | 134 | 0 |
| D | 0 | 134 | 0 |
| Mode M0 | |||
|---|---|---|---|
| Quadrant | BADHDUFLAG | Total packets | Discarded packets |
| A | 0 | 14867 | 2 |
| B | 0 | 16923 | 2 |
| C | 0 | 17034 | 2 |
| D | 0 | 22732 | 2 |
| Mode M9 | |||
|---|---|---|---|
| Quadrant | BADHDUFLAG | Total packets | Discarded packets |
| A | 0 | 7 | 0 |
| B | 0 | 7 | 0 |
| C | 0 | 7 | 0 |
| D | 0 | 7 | 0 |
| Quadrant | Total seconds | Saturated seconds | Saturation percentage |
|---|---|---|---|
| A | 6564 | 119 | 1.812919% |
| B | 6564 | 409 | 6.230957% |
| C | 6564 | 200 | 3.046923% |
| D | 6565 | 561 | 8.545316% |
Noise dominated data is calculated using 1-second bins in cleaned event files. If a bin has >2000 counts, and if more than 50% of those come from <1% of pixels, then it is considered to be noise-dominated and hence unusable.
| Quadrant | # 1 sec bins | Bins with >0 counts | Bins with >2000 counts | High rate bins dominated by noise | Noise dominated (total time) | Noise dominated (detector-on time) | Marked lightcurve |
|---|---|---|---|---|---|---|---|
| A | 7319 | 6565 | 72 | 72 | 0.98% | 1.10% | 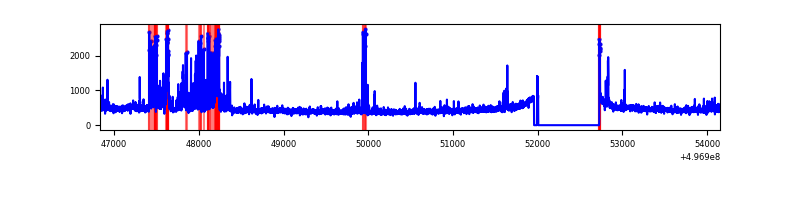 |
| B | 7319 | 6564 | 194 | 194 | 2.65% | 2.96% | 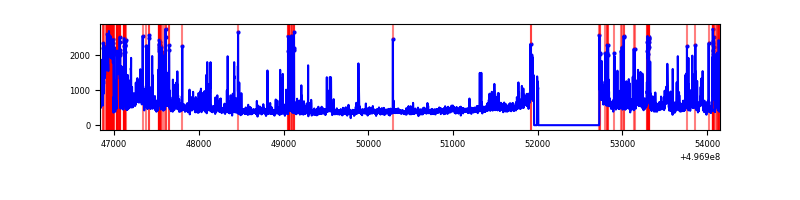 |
| C | 7319 | 6564 | 166 | 166 | 2.27% | 2.53% | 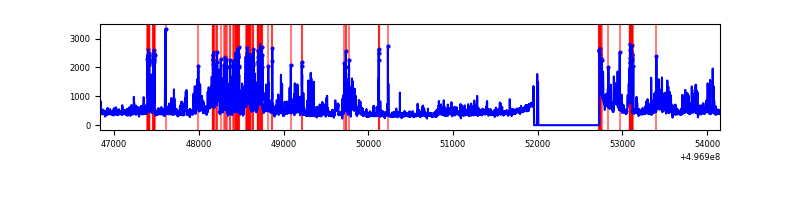 |
| D | 7320 | 6566 | 502 | 502 | 6.86% | 7.65% | 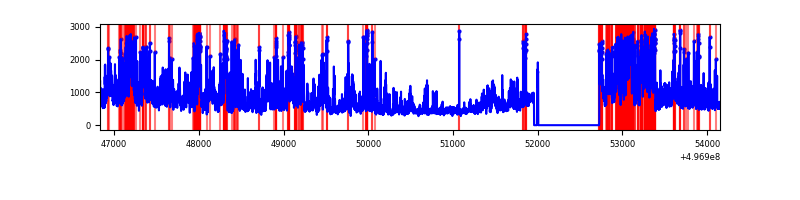 |
Top three noisy pixels from each quadrant. If the there are fewer than three noisy pixels in the level2.evt file, extra rows are filled as -1
| Pixel properties | Quadrant properties | ||||||
|---|---|---|---|---|---|---|---|
| Quadrant | DetID | PixID | Counts | Sigma | Mean | Median | Sigma |
| A | 7 | 158 | 399311 | 2336.59 | 687 | 670 | 170.6 |
| A | 3 | 14 | 112504 | 655.5 | 687 | 670 | 170.6 |
| A | 4 | 3 | 56268 | 325.88 | 687 | 670 | 170.6 |
| B | 5 | 236 | 827641 | 5915.69 | 656 | 632 | 139.8 |
| B | 0 | 213 | 143255 | 1020.2 | 656 | 632 | 139.8 |
| B | 5 | 185 | 102485 | 728.57 | 656 | 632 | 139.8 |
| C | 9 | 38 | 799345 | 4370.09 | 665 | 659 | 182.8 |
| C | 13 | 3 | 185180 | 1009.63 | 665 | 659 | 182.8 |
| C | 14 | 246 | 115655 | 629.21 | 665 | 659 | 182.8 |
| D | 8 | 176 | 1748363 | 9620.86 | 647 | 619 | 181.7 |
| D | 2 | 62 | 567589 | 3121.02 | 647 | 619 | 181.7 |
| D | 7 | 70 | 495511 | 2724.25 | 647 | 619 | 181.7 |
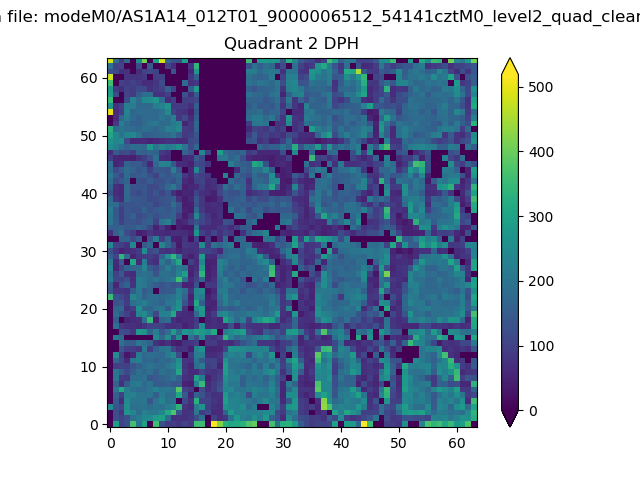
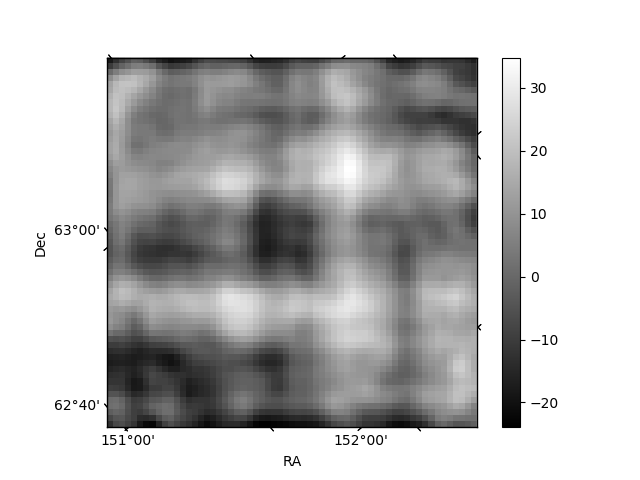
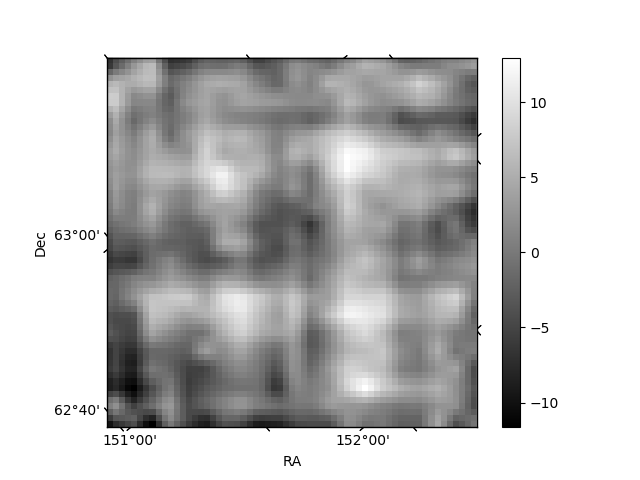
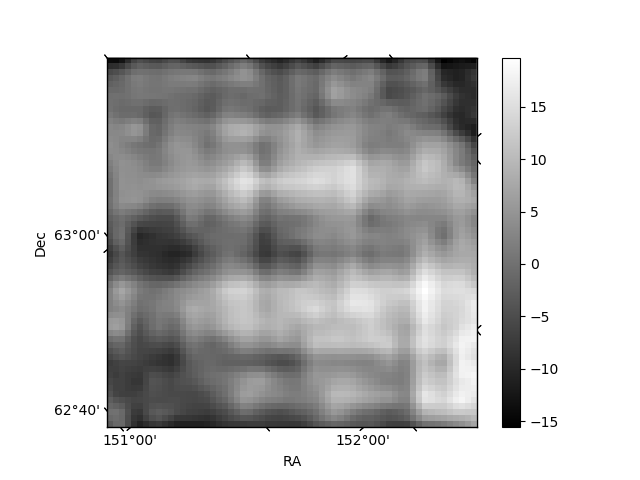
Histogram calculated using DETX and DETY for each event in the final _common_clean file
| Quadrant A | 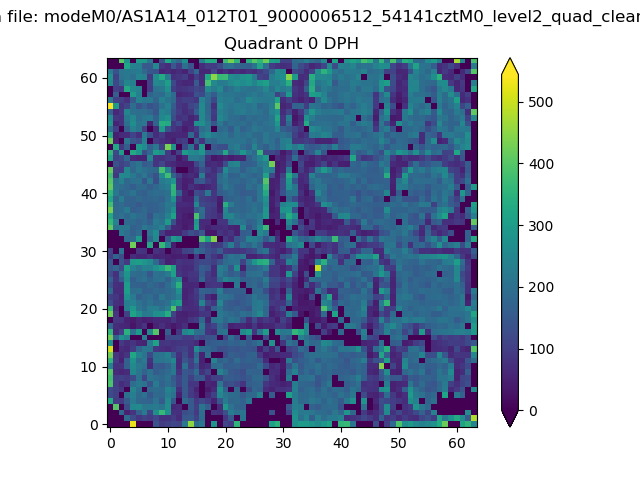 |
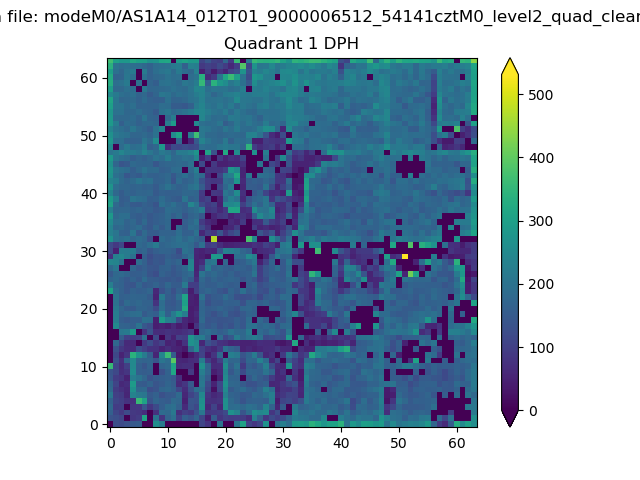 |
Quadrant B |
|---|---|---|---|
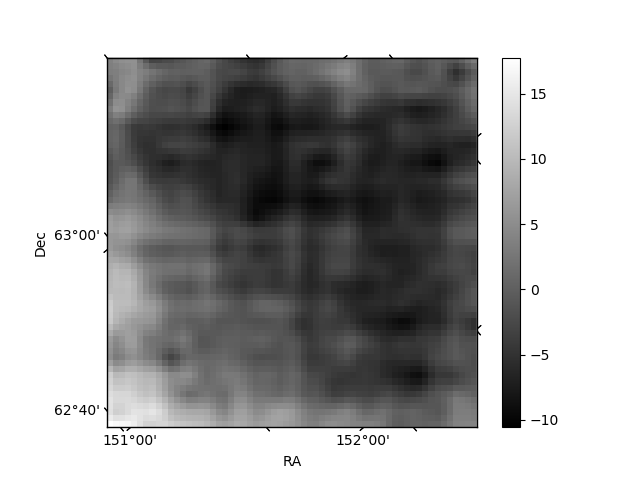
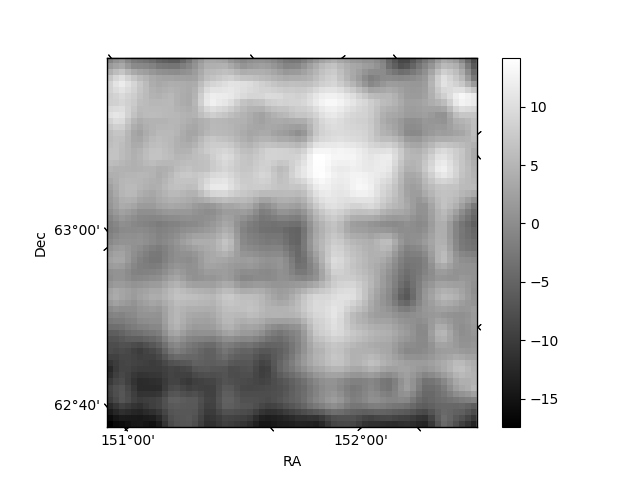
| Quadrant D | 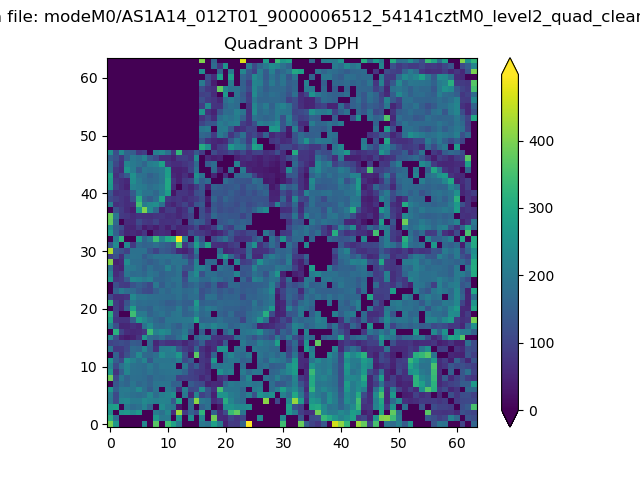 |
 |
Quadrant C |
| Plot type | Count rate plots | Images |
|---|---|---|
| Comparison with Poisson distribution Blue bars denote a histogram of data divided into 1 sec bins. Red curve is a Poisson curve with rate = median count rate of data. |
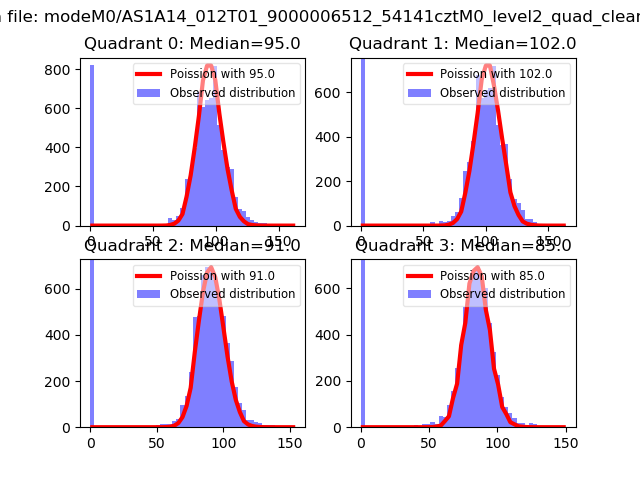 |
 |
| Quadrant-wise count rates Data is divided into 100 sec bins |
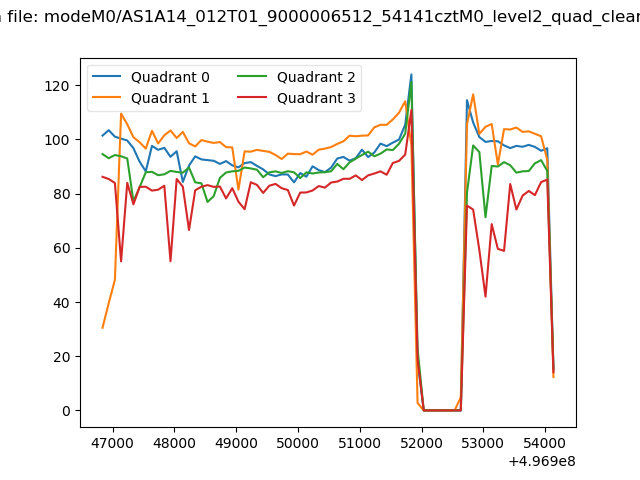 |
|
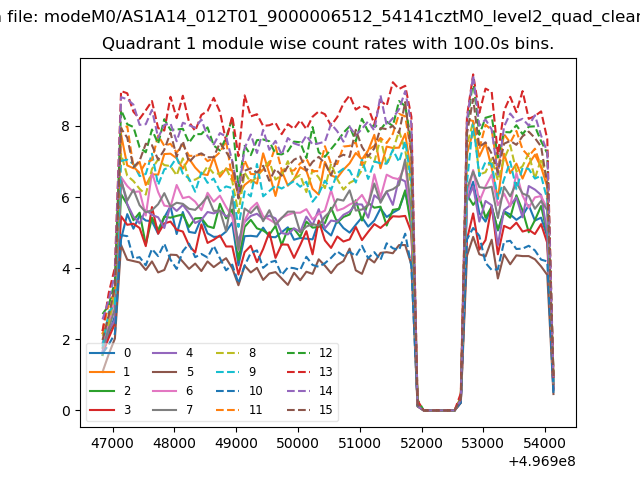
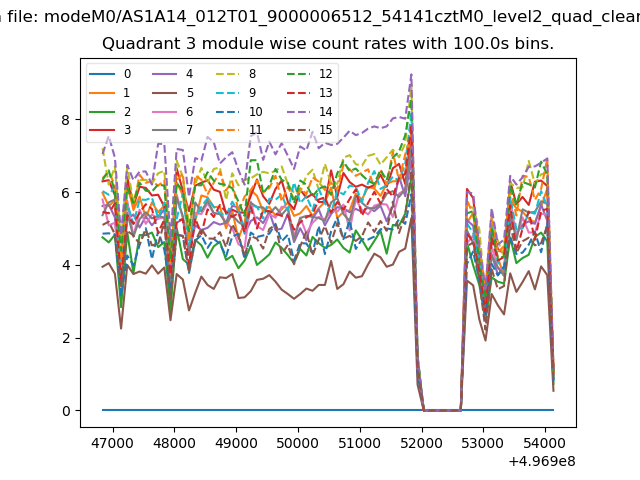
| Module-wise count rates for Quadrant A Data is divided into 100 sec bins |
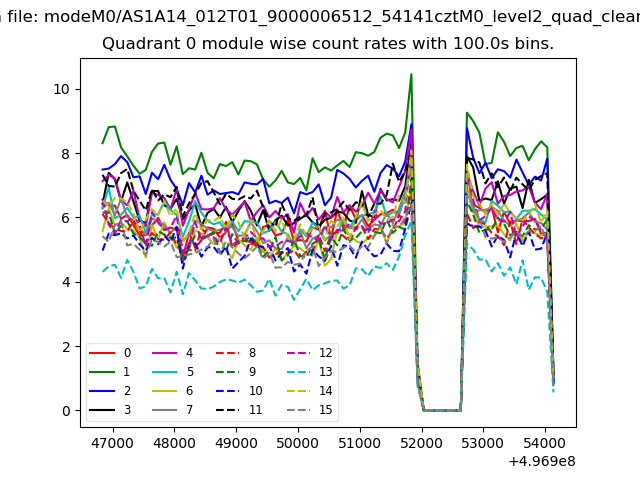 |
 |
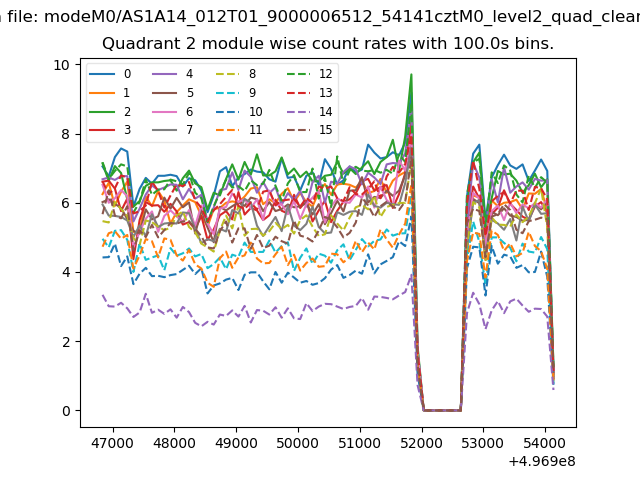
| Module-wise count rates for Quadrant B Data is divided into 100 sec bins |
 |
 |
| Module-wise count rates for Quadrant C Data is divided into 100 sec bins |
 |
 |
| Module-wise count rates for Quadrant D Data is divided into 100 sec bins |
 |
 |
| Parameter | Plot |
|---|---|
| CZT HV Monitor | 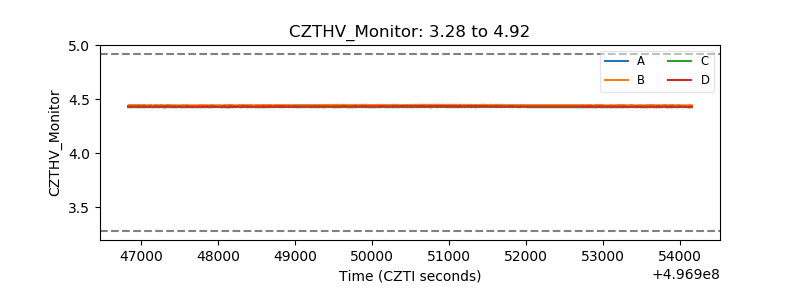 |
| D_VDD | 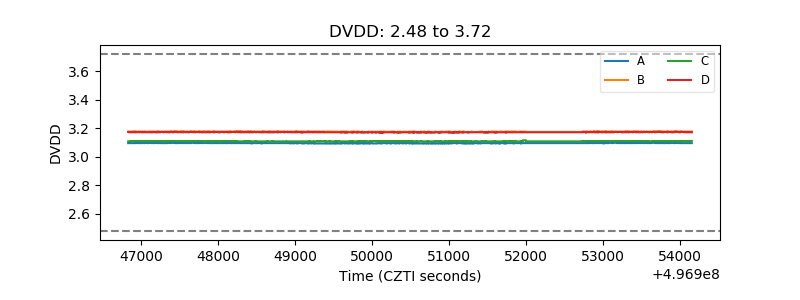 |
| Temperature 1 | 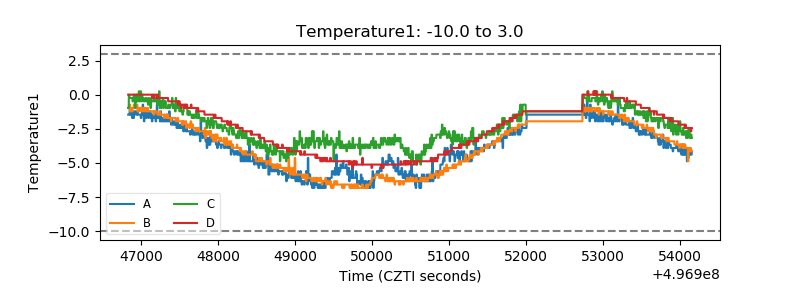 |
| Veto HV Monitor | 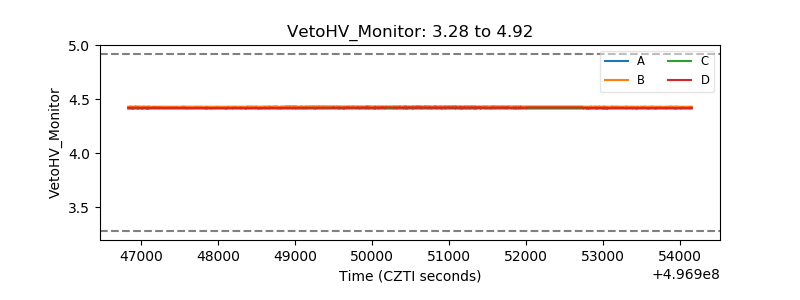 |
| Veto LLD | 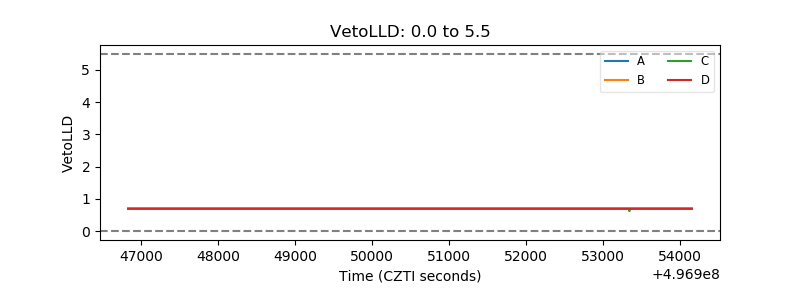 |
| Alpha Counter | 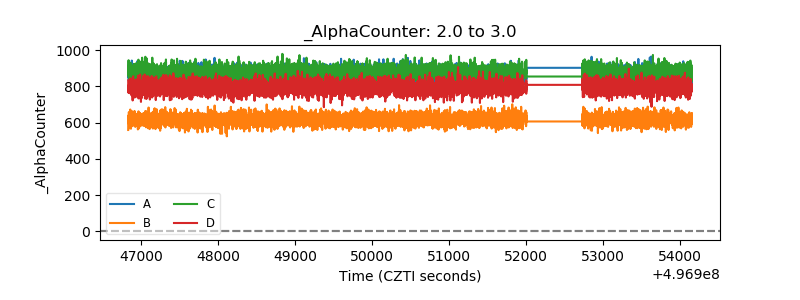 |
| _CPM_Rate | 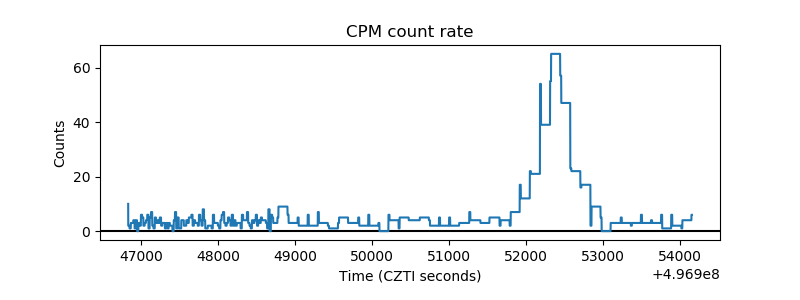 |
| CZT Counter | 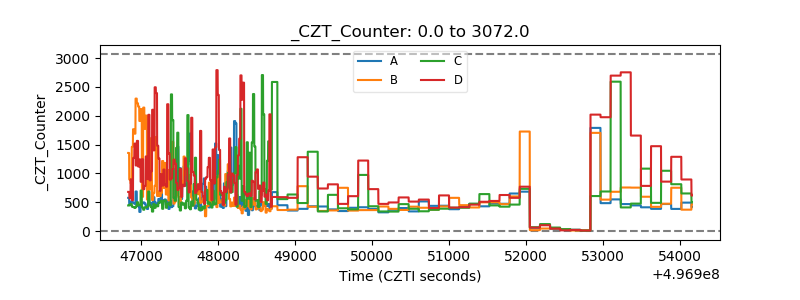 |
| +2.5 Volts monitor |  |
| +5 Volts monitor | 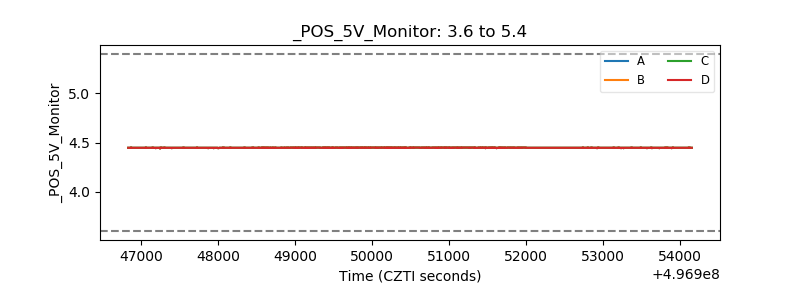 |
| _ROLL_ROT | 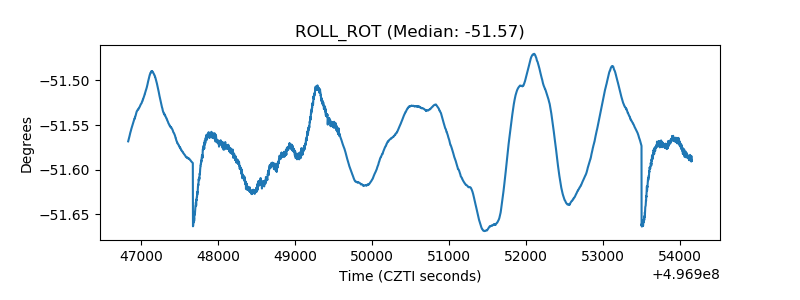 |
| _Roll_DEC | 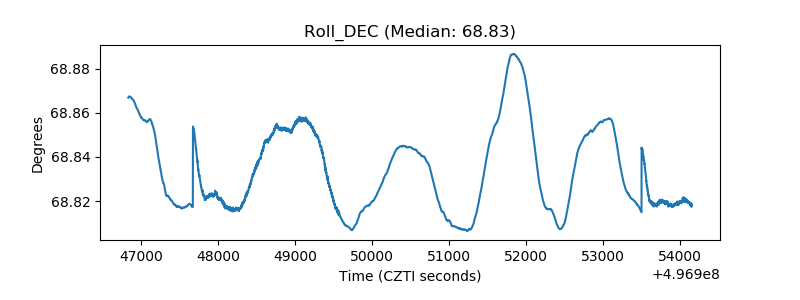 |
| _Roll_RA | 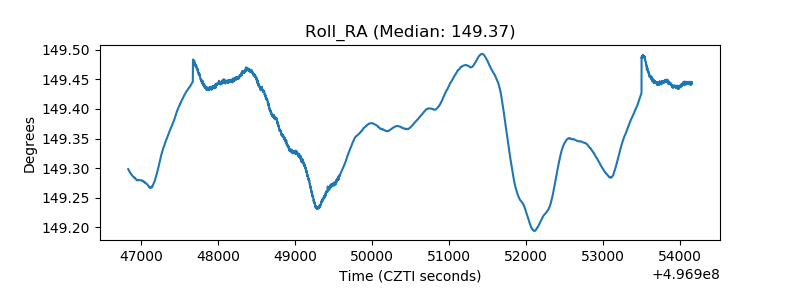 |
| Veto Counter | 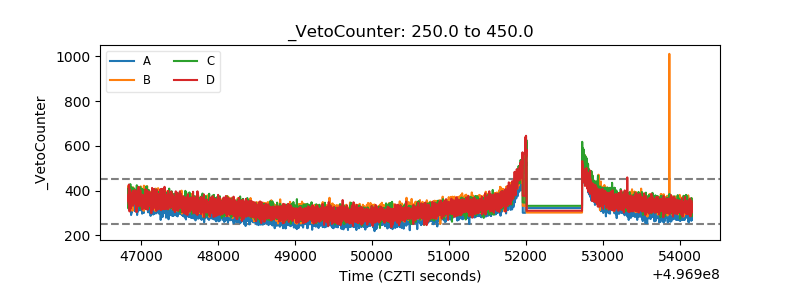 |