| Param | Original file | Final file |
|---|---|---|
| Filename | modeM0/AS1A14_012T01_9000006512_54142cztM0_level2.fits | modeM0/AS1A14_012T01_9000006512_54142cztM0_level2_quad_clean.evt |
| Size (bytes) | 562,659,840 | 105,600,960 |
| Size | 536.6 MB | 100.7 MB |
| Events in quadrant A | 3,572,988 | 715,957 |
| Events in quadrant B | 4,817,050 | 726,695 |
| Events in quadrant C | 4,739,222 | 642,858 |
| Events in quadrant D | 7,116,156 | 589,593 |
| Mode SS | |||
|---|---|---|---|
| Quadrant | BADHDUFLAG | Total packets | Discarded packets |
| A | 0 | 152 | 0 |
| B | 0 | 152 | 0 |
| C | 0 | 152 | 0 |
| D | 0 | 152 | 0 |
| Mode M0 | |||
|---|---|---|---|
| Quadrant | BADHDUFLAG | Total packets | Discarded packets |
| A | 0 | 16184 | 2 |
| B | 0 | 19891 | 2 |
| C | 0 | 19461 | 2 |
| D | 0 | 26455 | 2 |
| Mode M9 | |||
|---|---|---|---|
| Quadrant | BADHDUFLAG | Total packets | Discarded packets |
| A | 0 | 1 | 0 |
| B | 0 | 1 | 0 |
| C | 0 | 1 | 0 |
| D | 0 | 1 | 0 |
| Quadrant | Total seconds | Saturated seconds | Saturation percentage |
|---|---|---|---|
| A | 7505 | 88 | 1.172552% |
| B | 7505 | 539 | 7.181879% |
| C | 7506 | 454 | 6.048495% |
| D | 7505 | 774 | 10.313125% |
Noise dominated data is calculated using 1-second bins in cleaned event files. If a bin has >2000 counts, and if more than 50% of those come from <1% of pixels, then it is considered to be noise-dominated and hence unusable.
| Quadrant | # 1 sec bins | Bins with >0 counts | Bins with >2000 counts | High rate bins dominated by noise | Noise dominated (total time) | Noise dominated (detector-on time) | Marked lightcurve |
|---|---|---|---|---|---|---|---|
| A | 7584 | 7506 | 45 | 45 | 0.59% | 0.60% | 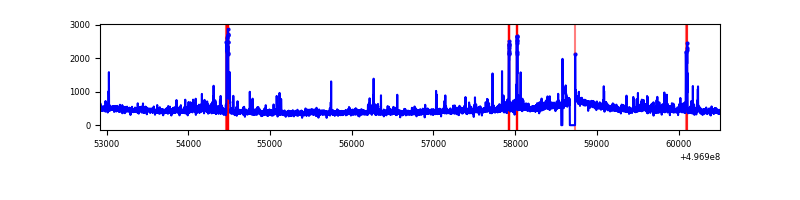 |
| B | 7585 | 7505 | 282 | 282 | 3.72% | 3.76% | 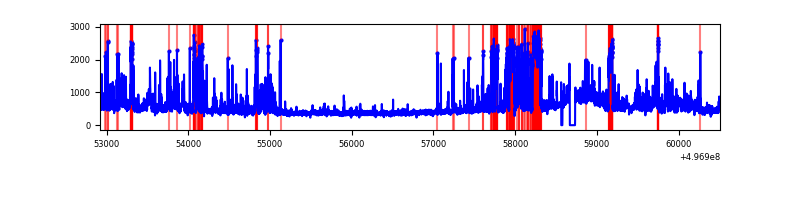 |
| C | 7586 | 7508 | 191 | 191 | 2.52% | 2.54% | 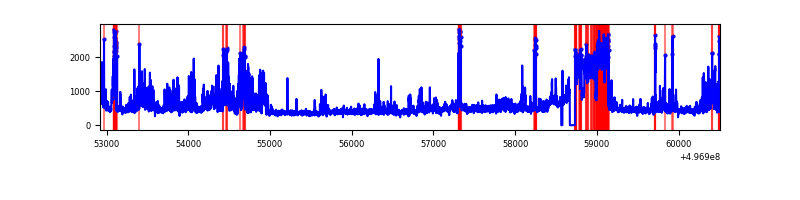 |
| D | 7585 | 7506 | 552 | 552 | 7.28% | 7.35% | 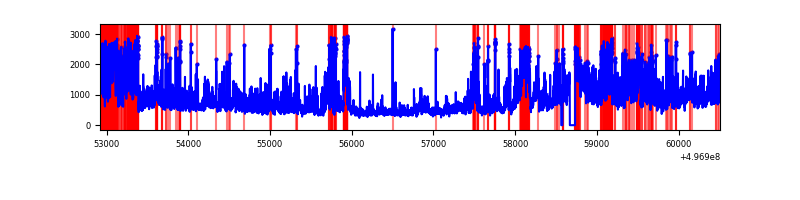 |
Top three noisy pixels from each quadrant. If the there are fewer than three noisy pixels in the level2.evt file, extra rows are filled as -1
| Pixel properties | Quadrant properties | ||||||
|---|---|---|---|---|---|---|---|
| Quadrant | DetID | PixID | Counts | Sigma | Mean | Median | Sigma |
| A | 15 | 174 | 197516 | 991.97 | 801 | 782 | 198.3 |
| A | 8 | 249 | 74926 | 373.85 | 801 | 782 | 198.3 |
| A | 3 | 14 | 67830 | 338.07 | 801 | 782 | 198.3 |
| B | 5 | 185 | 640857 | 3929.05 | 777 | 749 | 162.9 |
| B | 5 | 236 | 365869 | 2241.14 | 777 | 749 | 162.9 |
| B | 15 | 20 | 208957 | 1278.0 | 777 | 749 | 162.9 |
| C | 9 | 38 | 611345 | 2911.3 | 765 | 760 | 209.7 |
| C | 14 | 246 | 525064 | 2499.91 | 765 | 760 | 209.7 |
| C | 15 | 217 | 164608 | 781.24 | 765 | 760 | 209.7 |
| D | 8 | 176 | 1689889 | 7943.69 | 751 | 719 | 212.6 |
| D | 7 | 70 | 1140385 | 5359.53 | 751 | 719 | 212.6 |
| D | 2 | 62 | 585380 | 2749.5 | 751 | 719 | 212.6 |
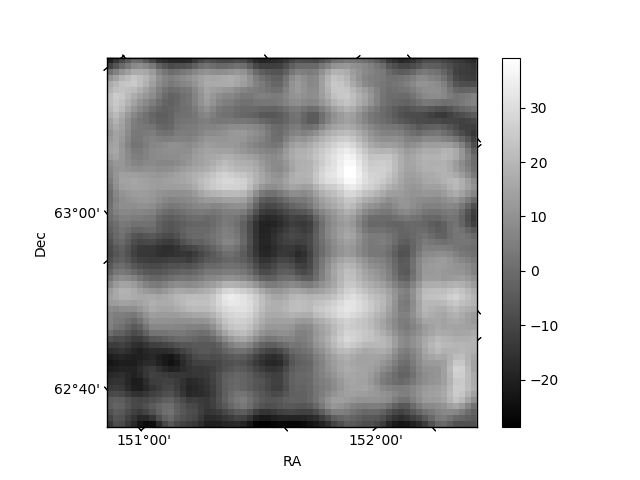
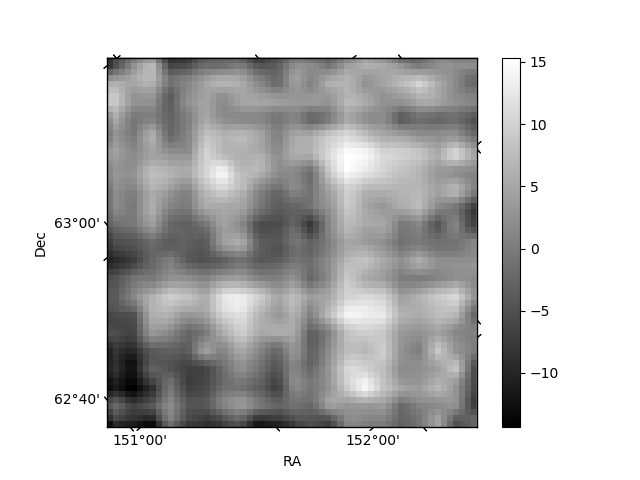
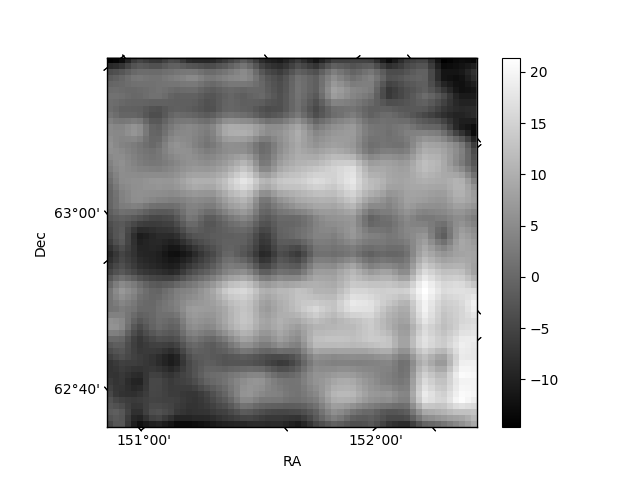
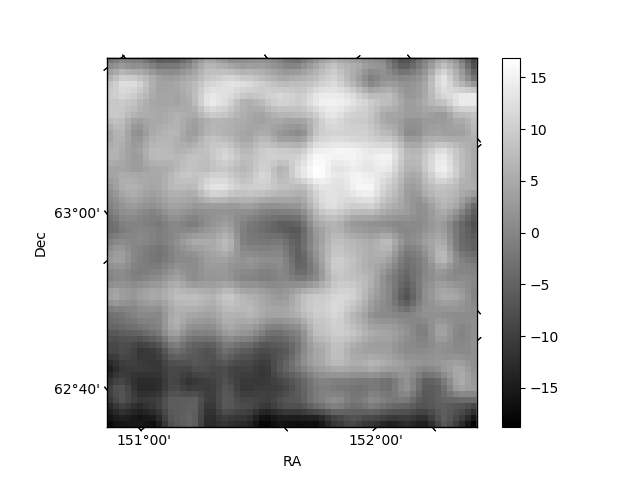
Histogram calculated using DETX and DETY for each event in the final _common_clean file
| Quadrant A | 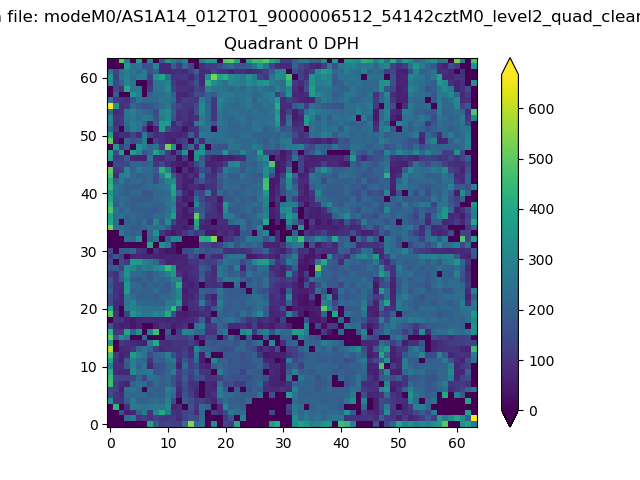 |
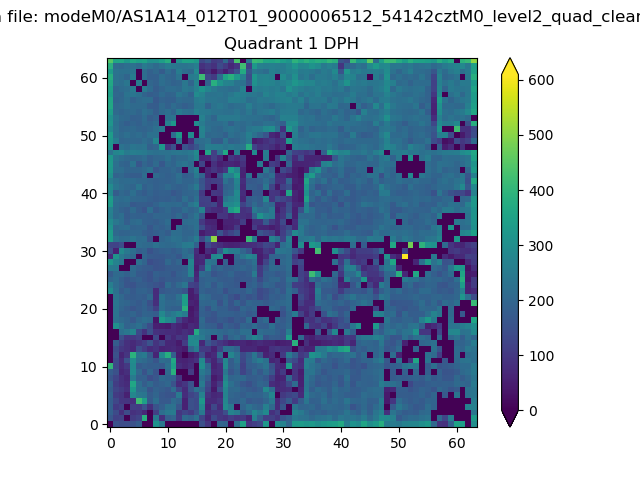 |
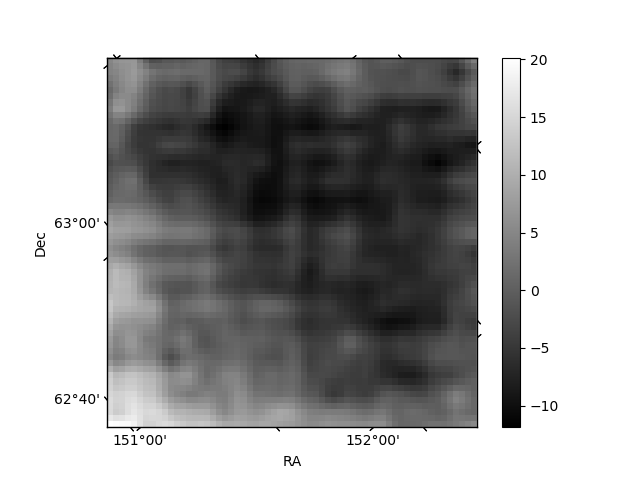
Quadrant B |
|---|---|---|---|
| Quadrant D | 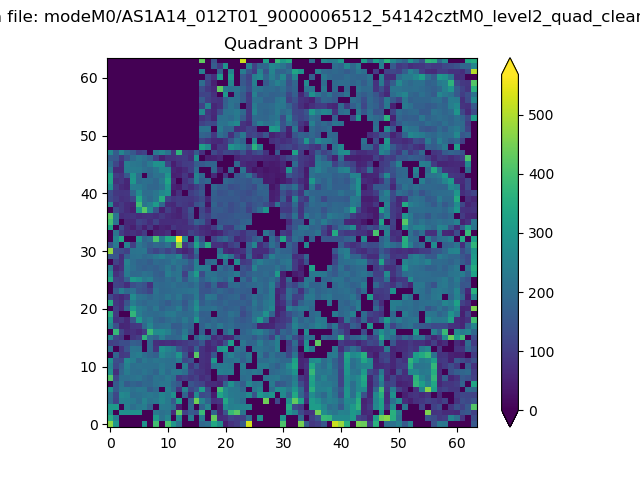 |
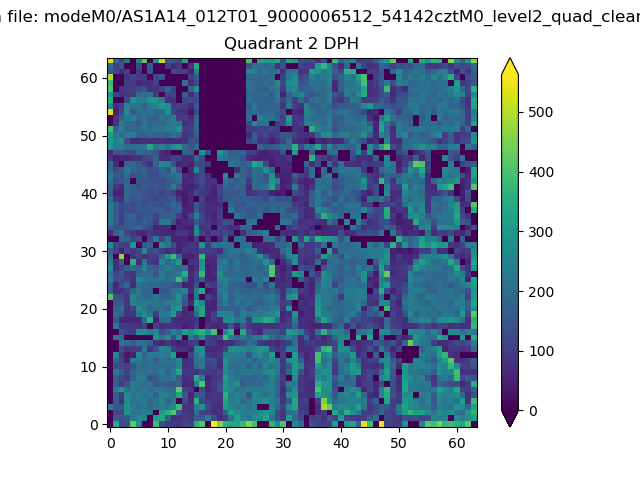 |
Quadrant C |
| Plot type | Count rate plots | Images |
|---|---|---|
| Comparison with Poisson distribution Blue bars denote a histogram of data divided into 1 sec bins. Red curve is a Poisson curve with rate = median count rate of data. |
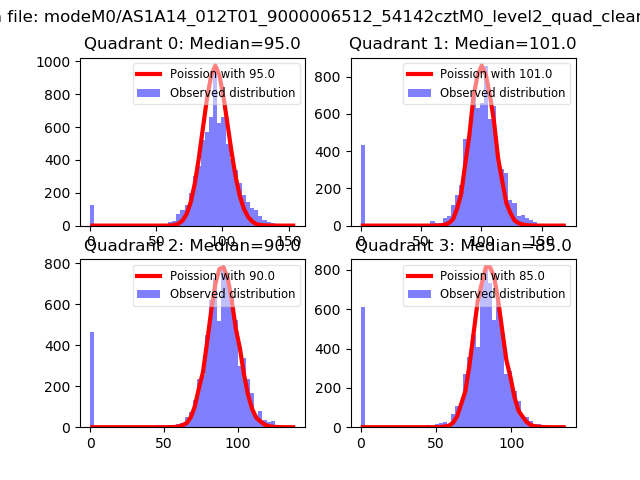 |
 |
| Quadrant-wise count rates Data is divided into 100 sec bins |
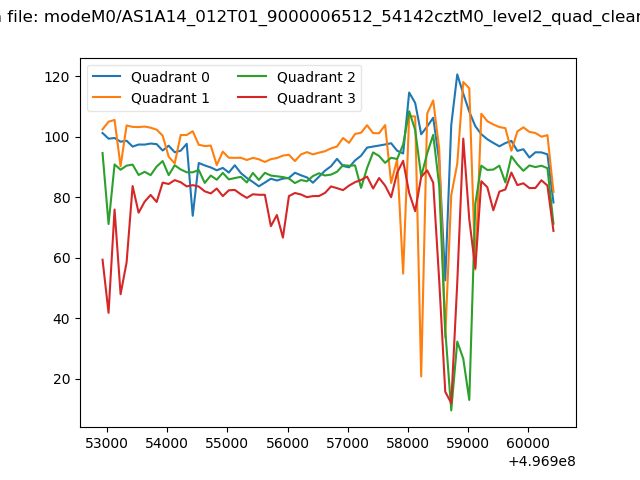 |
|
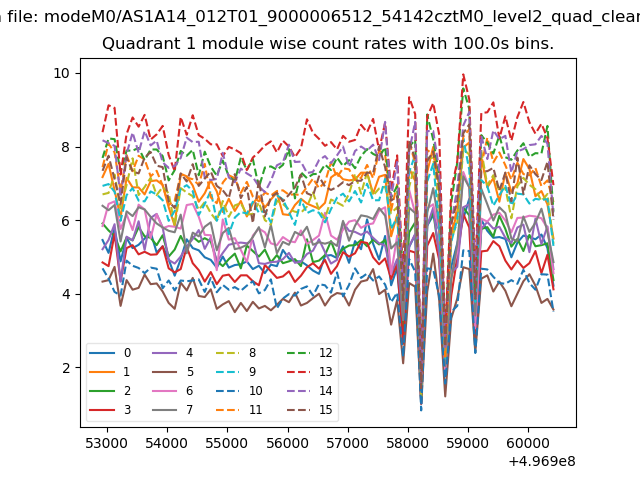
| Module-wise count rates for Quadrant A Data is divided into 100 sec bins |
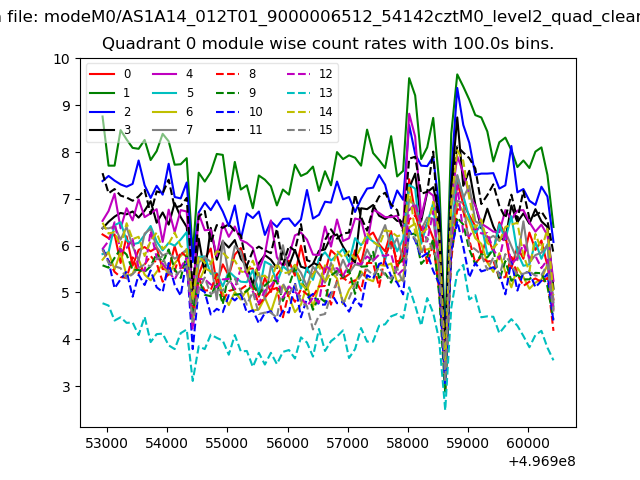 |
 |
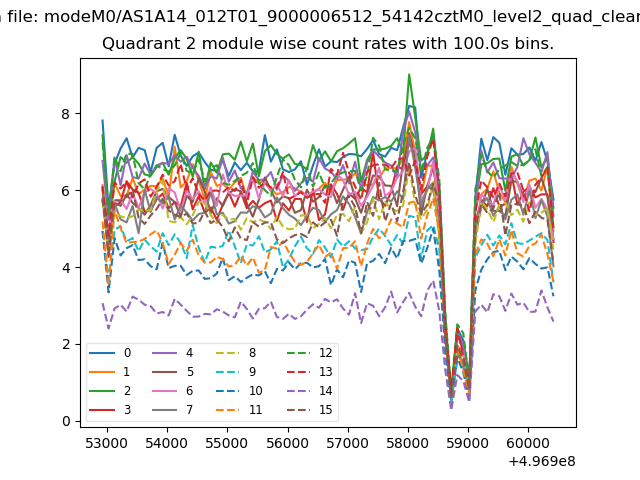
| Module-wise count rates for Quadrant B Data is divided into 100 sec bins |
 |
 |
| Module-wise count rates for Quadrant C Data is divided into 100 sec bins |
 |
 |
| Module-wise count rates for Quadrant D Data is divided into 100 sec bins |
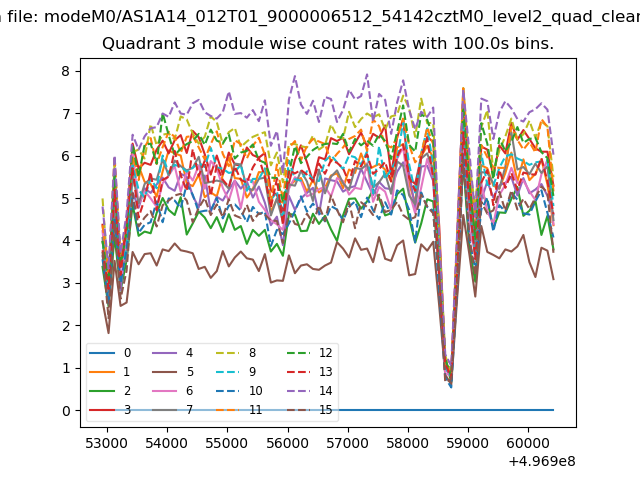 |
 |
| Parameter | Plot |
|---|---|
| CZT HV Monitor | 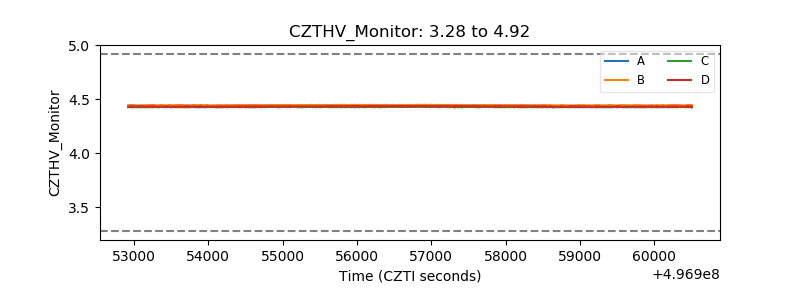 |
| D_VDD | 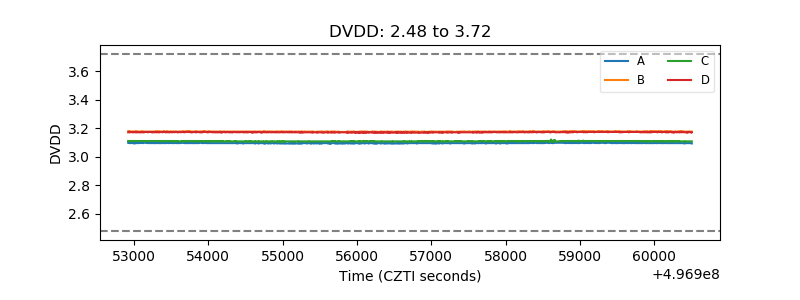 |
| Temperature 1 | 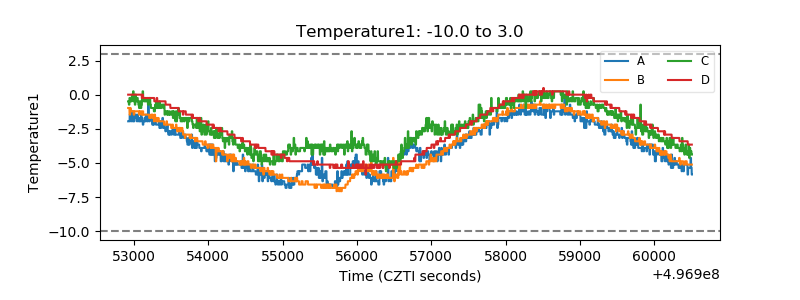 |
| Veto HV Monitor |  |
| Veto LLD | 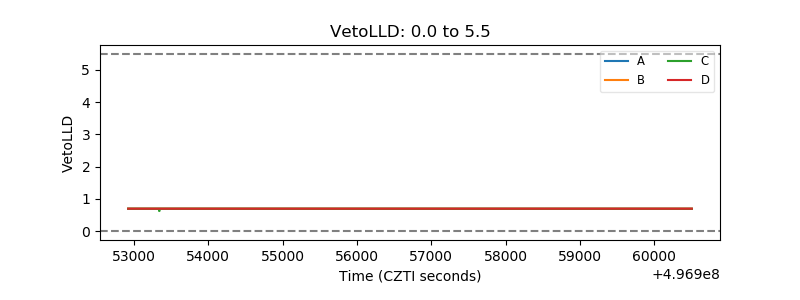 |
| Alpha Counter | 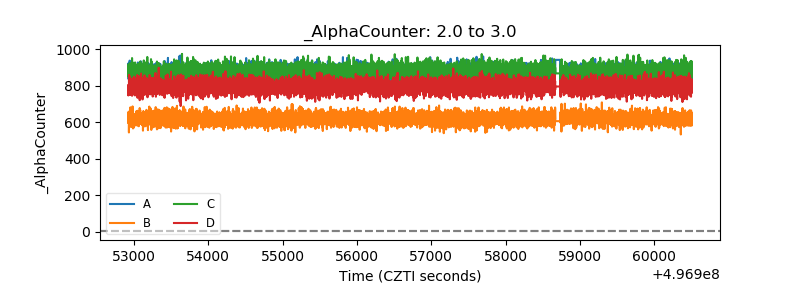 |
| _CPM_Rate | 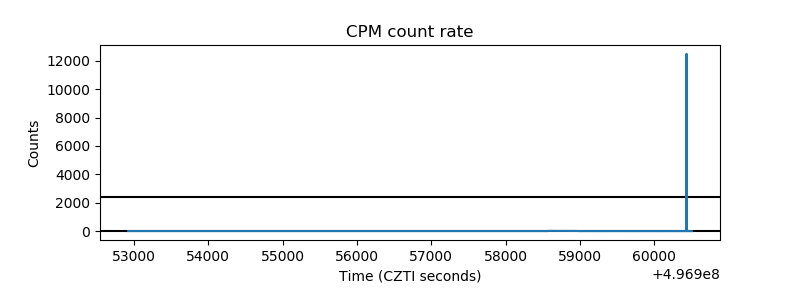 |
| CZT Counter | 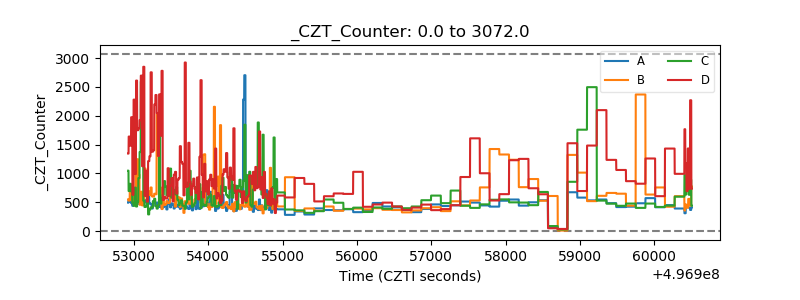 |
| +2.5 Volts monitor |  |
| +5 Volts monitor |  |
| _ROLL_ROT | 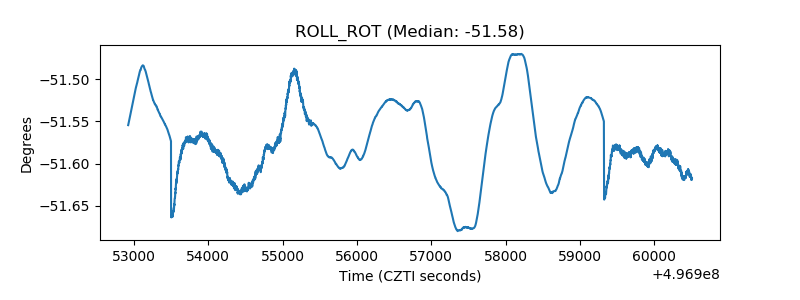 |
| _Roll_DEC | 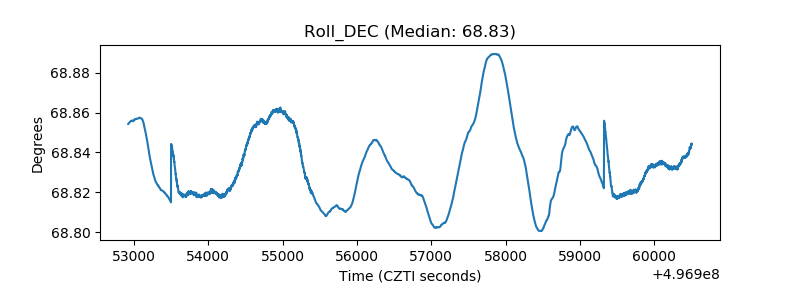 |
| _Roll_RA | 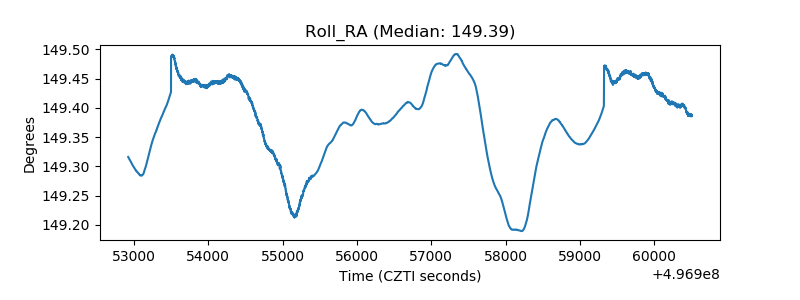 |
| Veto Counter | 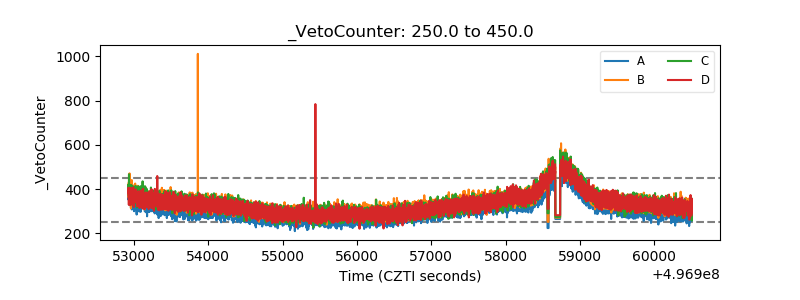 |