| Param | Original file | Final file |
|---|---|---|
| Filename | modeM0/AS1A14_012T01_9000006512_54143cztM0_level2.fits | modeM0/AS1A14_012T01_9000006512_54143cztM0_level2_quad_clean.evt |
| Size (bytes) | 681,367,680 | 109,831,680 |
| Size | 649.8 MB | 104.7 MB |
| Events in quadrant A | 4,664,191 | 740,974 |
| Events in quadrant B | 5,307,393 | 775,382 |
| Events in quadrant C | 4,416,370 | 698,202 |
| Events in quadrant D | 10,217,865 | 558,173 |
| Mode SS | |||
|---|---|---|---|
| Quadrant | BADHDUFLAG | Total packets | Discarded packets |
| A | 0 | 158 | 0 |
| B | 0 | 158 | 0 |
| C | 0 | 158 | 0 |
| D | 0 | 158 | 0 |
| Mode M0 | |||
|---|---|---|---|
| Quadrant | BADHDUFLAG | Total packets | Discarded packets |
| A | 0 | 19581 | 0 |
| B | 0 | 21421 | 5 |
| C | 0 | 18947 | 0 |
| D | 0 | 35928 | 0 |
| Quadrant | Total seconds | Saturated seconds | Saturation percentage |
|---|---|---|---|
| A | 7951 | 254 | 3.194567% |
| B | 7951 | 472 | 5.936360% |
| C | 7951 | 302 | 3.798264% |
| D | 7951 | 1680 | 21.129418% |
Noise dominated data is calculated using 1-second bins in cleaned event files. If a bin has >2000 counts, and if more than 50% of those come from <1% of pixels, then it is considered to be noise-dominated and hence unusable.
| Quadrant | # 1 sec bins | Bins with >0 counts | Bins with >2000 counts | High rate bins dominated by noise | Noise dominated (total time) | Noise dominated (detector-on time) | Marked lightcurve |
|---|---|---|---|---|---|---|---|
| A | 7950 | 7950 | 197 | 197 | 2.48% | 2.48% | 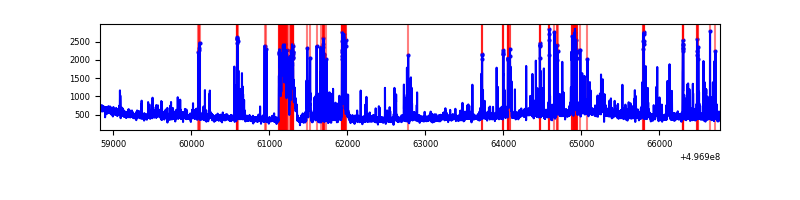 |
| B | 7950 | 7950 | 319 | 319 | 4.01% | 4.01% | 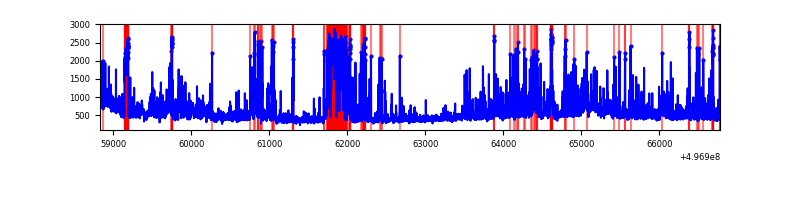 |
| C | 7950 | 7950 | 137 | 137 | 1.72% | 1.72% | 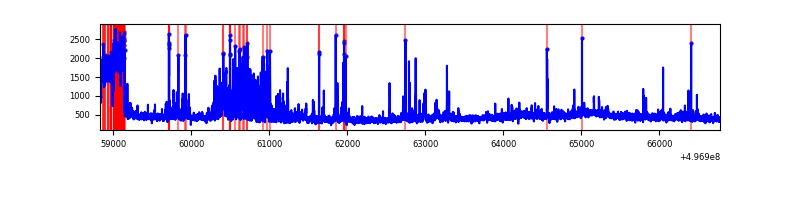 |
| D | 7950 | 7950 | 1573 | 1573 | 19.79% | 19.79% | 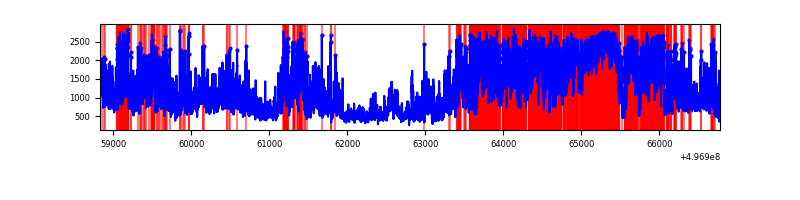 |
Top three noisy pixels from each quadrant. If the there are fewer than three noisy pixels in the level2.evt file, extra rows are filled as -1
| Pixel properties | Quadrant properties | ||||||
|---|---|---|---|---|---|---|---|
| Quadrant | DetID | PixID | Counts | Sigma | Mean | Median | Sigma |
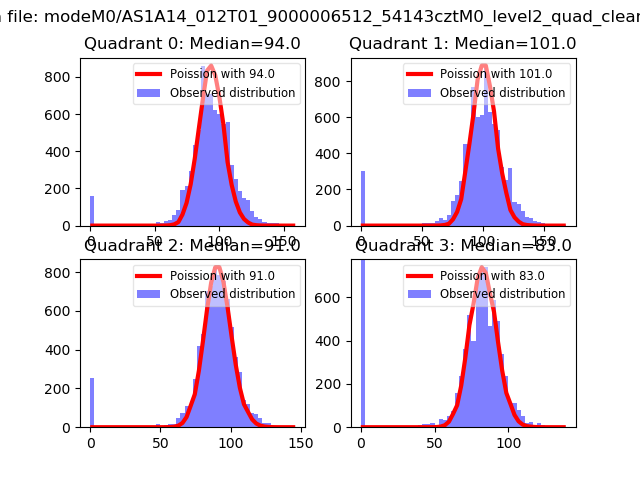
| A | 7 | 14 | 521633 | 2478.4 | 841 | 821 | 210.1 |
| A | 15 | 174 | 300367 | 1425.45 | 841 | 821 | 210.1 |
| A | 0 | 8 | 223132 | 1057.91 | 841 | 821 | 210.1 |
| B | 5 | 185 | 721447 | 4137.44 | 826 | 797 | 174.2 |
| B | 15 | 20 | 270611 | 1549.07 | 826 | 797 | 174.2 |
| B | 5 | 236 | 218351 | 1249.03 | 826 | 797 | 174.2 |
| C | 9 | 38 | 731174 | 3246.76 | 819 | 812 | 225.0 |
| C | 15 | 217 | 164636 | 728.26 | 819 | 812 | 225.0 |
| C | 11 | 244 | 73776 | 324.35 | 819 | 812 | 225.0 |
| D | 2 | 172 | 3354438 | 15595.88 | 755 | 720 | 215.0 |
| D | 7 | 70 | 2675281 | 12437.58 | 755 | 720 | 215.0 |
| D | 8 | 176 | 492145 | 2285.29 | 755 | 720 | 215.0 |
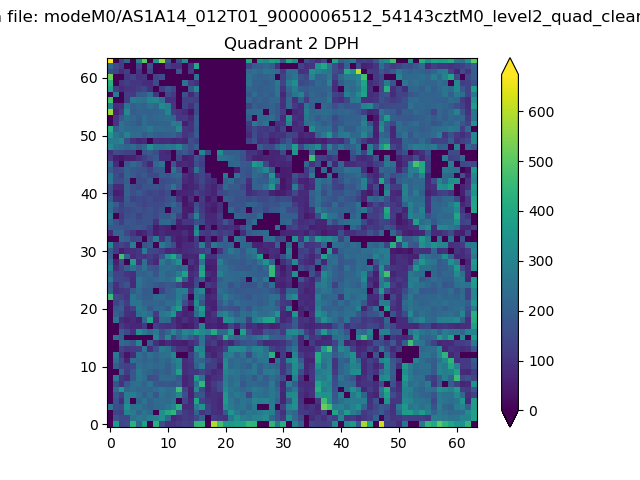
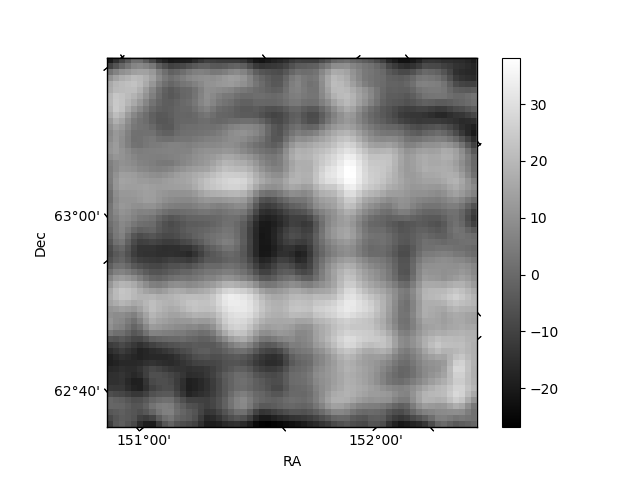
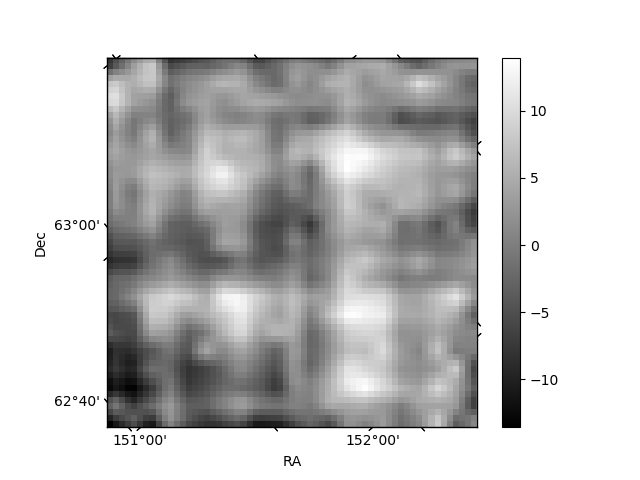
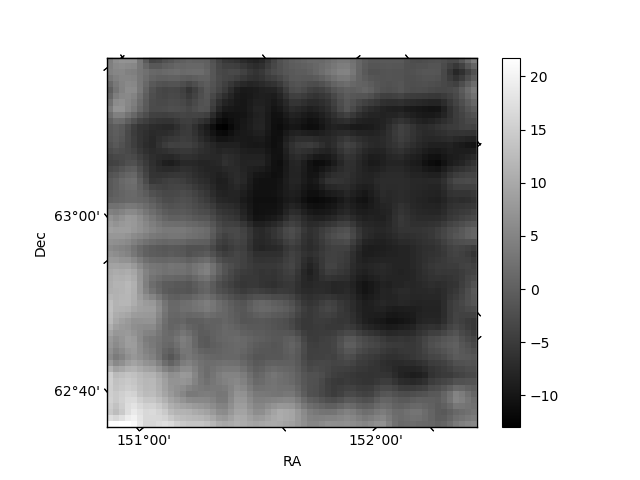
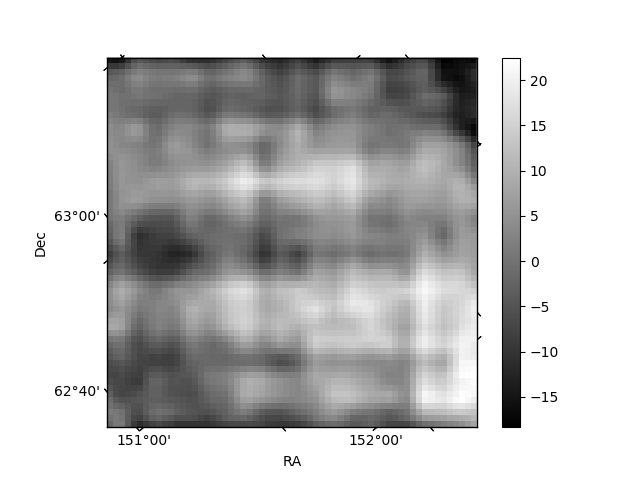
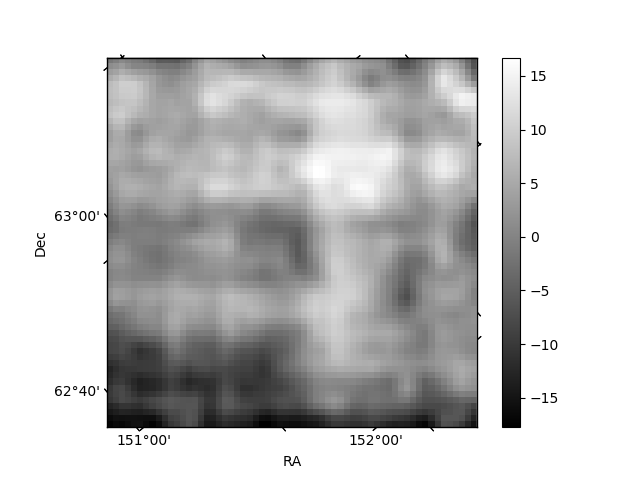
Histogram calculated using DETX and DETY for each event in the final _common_clean file
| Quadrant A | 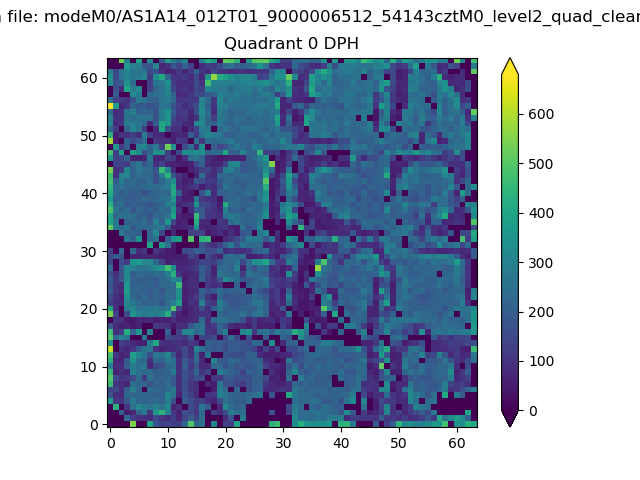 |
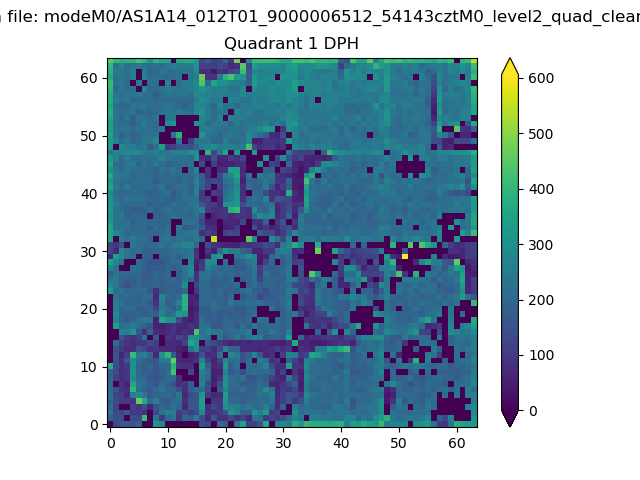 |
Quadrant B |
|---|---|---|---|
| Quadrant D | 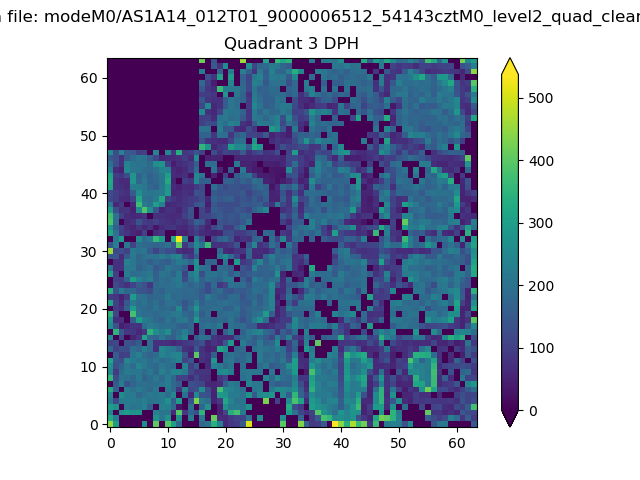 |
 |
Quadrant C |
| Plot type | Count rate plots | Images |
|---|---|---|
| Comparison with Poisson distribution Blue bars denote a histogram of data divided into 1 sec bins. Red curve is a Poisson curve with rate = median count rate of data. |
 |
 |
| Quadrant-wise count rates Data is divided into 100 sec bins |
 |
|
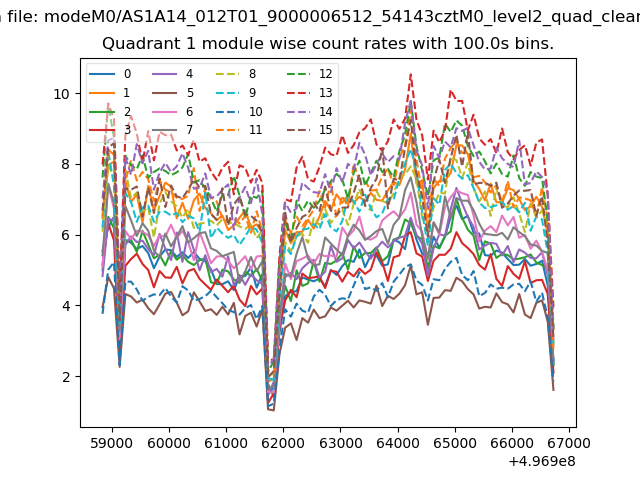
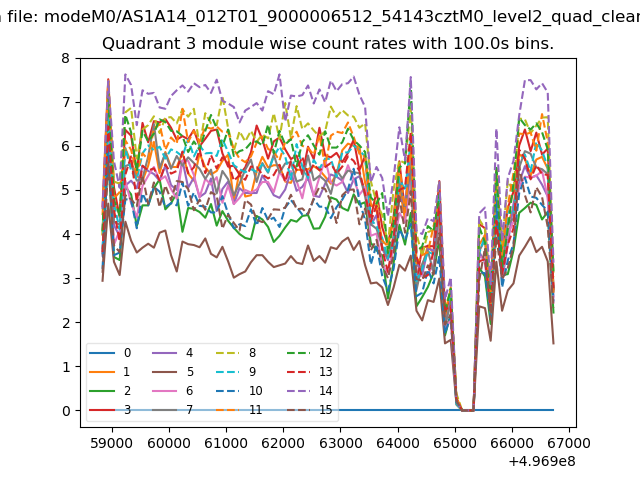
| Module-wise count rates for Quadrant A Data is divided into 100 sec bins |
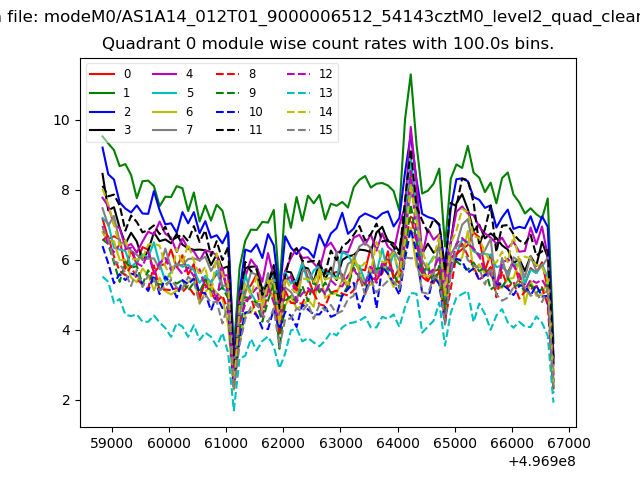 |
 |
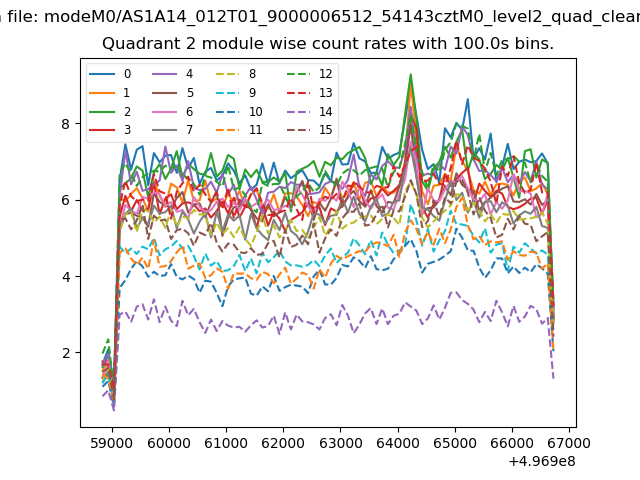
| Module-wise count rates for Quadrant B Data is divided into 100 sec bins |
 |
 |
| Module-wise count rates for Quadrant C Data is divided into 100 sec bins |
 |
 |
| Module-wise count rates for Quadrant D Data is divided into 100 sec bins |
 |
 |
| Parameter | Plot |
|---|---|
| CZT HV Monitor | 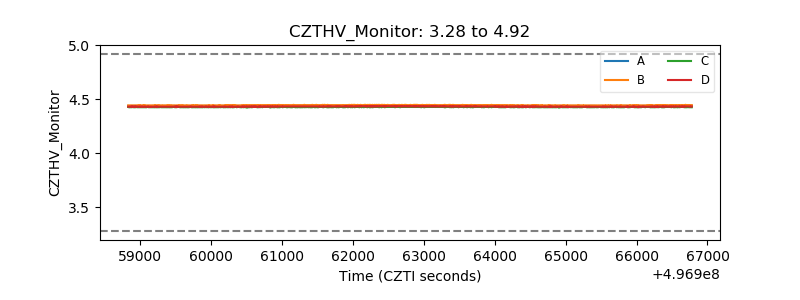 |
| D_VDD | 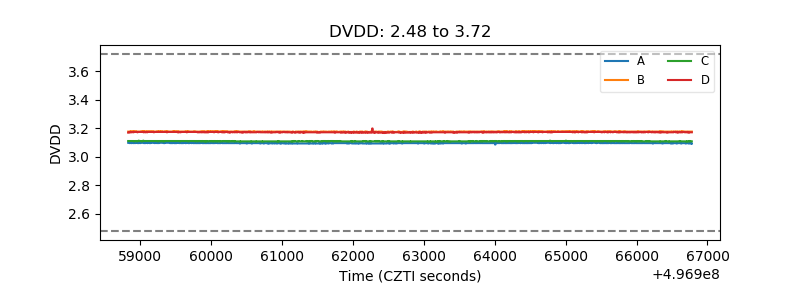 |
| Temperature 1 | 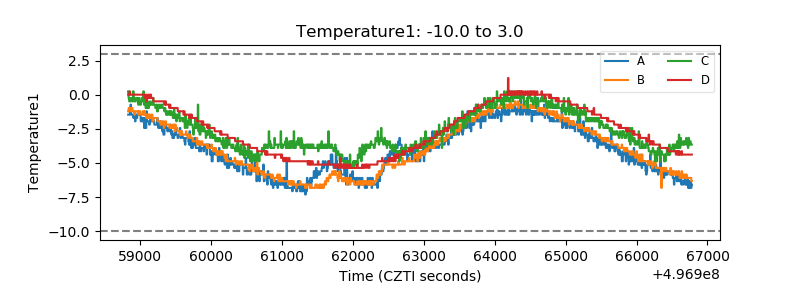 |
| Veto HV Monitor | 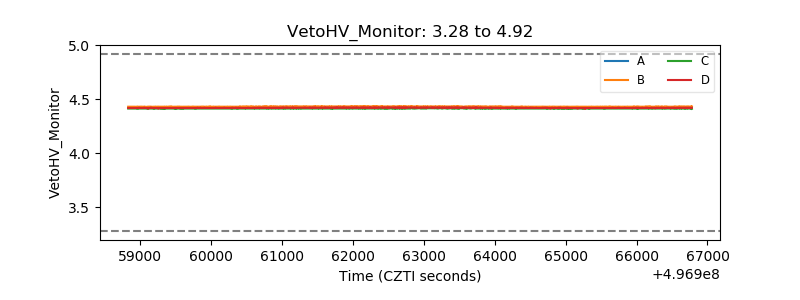 |
| Veto LLD | 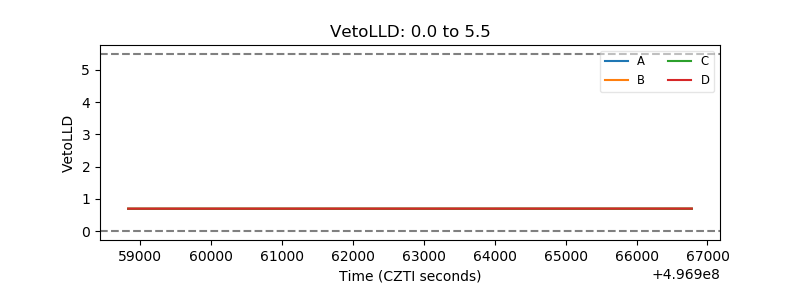 |
| Alpha Counter | 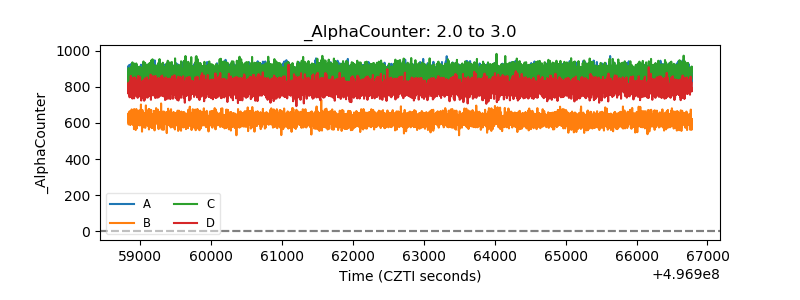 |
| _CPM_Rate | 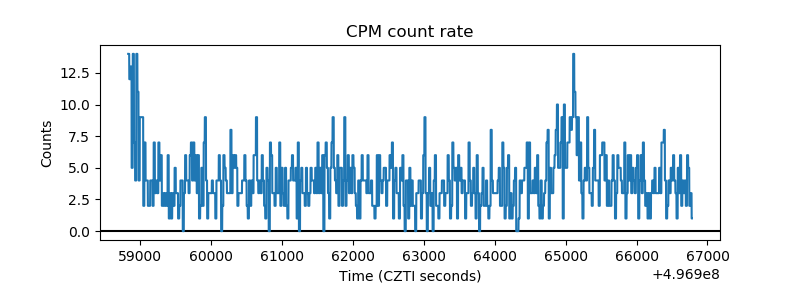 |
| CZT Counter | 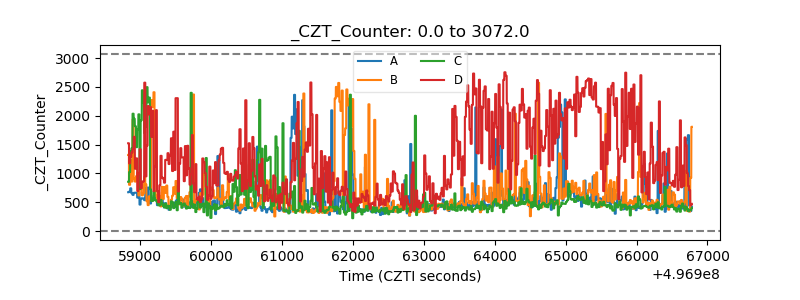 |
| +2.5 Volts monitor | 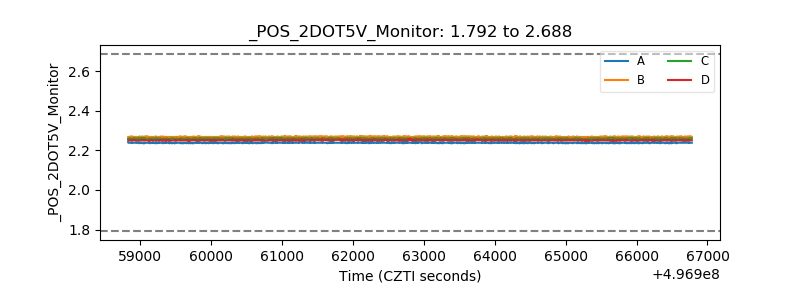 |
| +5 Volts monitor | 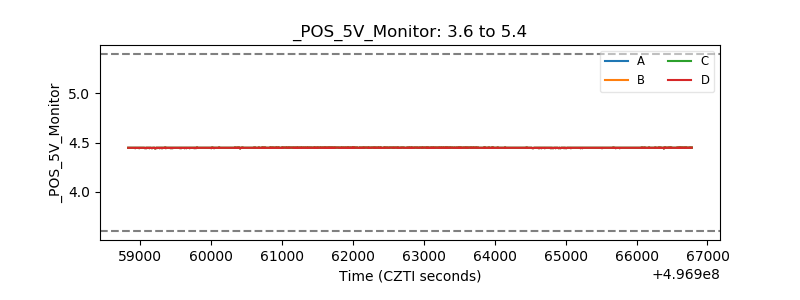 |
| _ROLL_ROT | 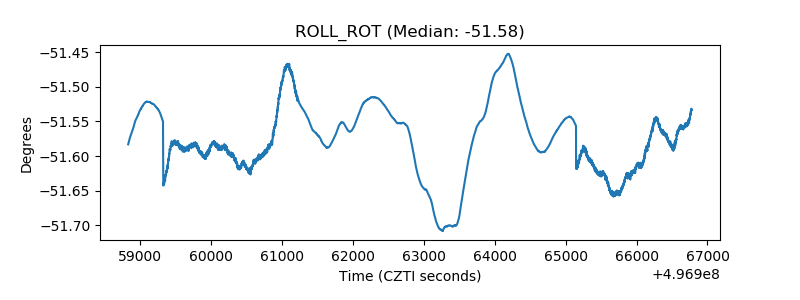 |
| _Roll_DEC | 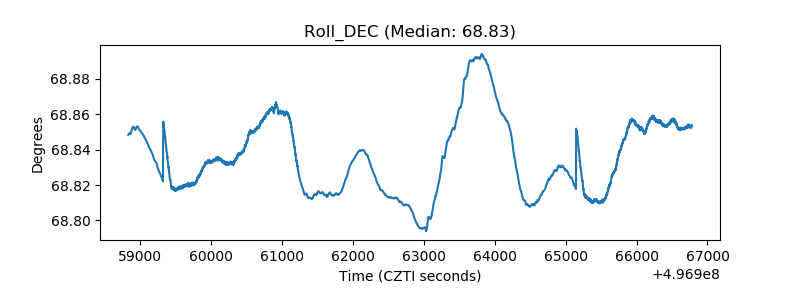 |
| _Roll_RA | 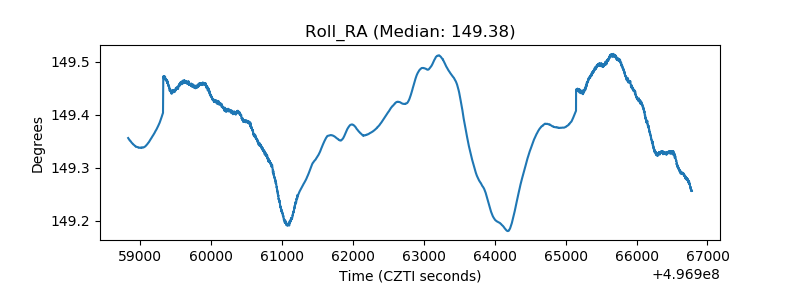 |
| Veto Counter | 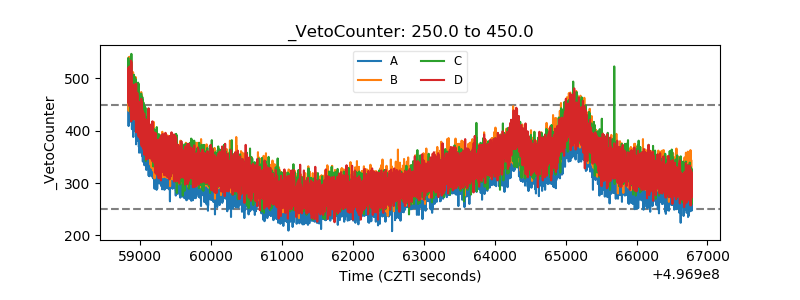 |