| Param | Original file | Final file |
|---|---|---|
| Filename | modeM0/AS1A14_012T01_9000006512_54144cztM0_level2.fits | modeM0/AS1A14_012T01_9000006512_54144cztM0_level2_quad_clean.evt |
| Size (bytes) | 765,077,760 | 117,564,480 |
| Size | 729.6 MB | 112.1 MB |
| Events in quadrant A | 4,485,593 | 827,922 |
| Events in quadrant B | 5,223,777 | 876,066 |
| Events in quadrant C | 3,810,206 | 803,368 |
| Events in quadrant D | 14,126,790 | 448,528 |
| Mode SS | |||
|---|---|---|---|
| Quadrant | BADHDUFLAG | Total packets | Discarded packets |
| A | 0 | 174 | 0 |
| B | 0 | 174 | 0 |
| C | 0 | 174 | 0 |
| D | 0 | 174 | 0 |
| Mode M0 | |||
|---|---|---|---|
| Quadrant | BADHDUFLAG | Total packets | Discarded packets |
| A | 0 | 19802 | 0 |
| B | 0 | 21785 | 0 |
| C | 0 | 18023 | 0 |
| D | 0 | 47967 | 2 |
| Quadrant | Total seconds | Saturated seconds | Saturation percentage |
|---|---|---|---|
| A | 8692 | 116 | 1.334561% |
| B | 8692 | 266 | 3.060285% |
| C | 8692 | 21 | 0.241601% |
| D | 8691 | 3708 | 42.664826% |
Noise dominated data is calculated using 1-second bins in cleaned event files. If a bin has >2000 counts, and if more than 50% of those come from <1% of pixels, then it is considered to be noise-dominated and hence unusable.
| Quadrant | # 1 sec bins | Bins with >0 counts | Bins with >2000 counts | High rate bins dominated by noise | Noise dominated (total time) | Noise dominated (detector-on time) | Marked lightcurve |
|---|---|---|---|---|---|---|---|
| A | 8691 | 8691 | 84 | 84 | 0.97% | 0.97% | 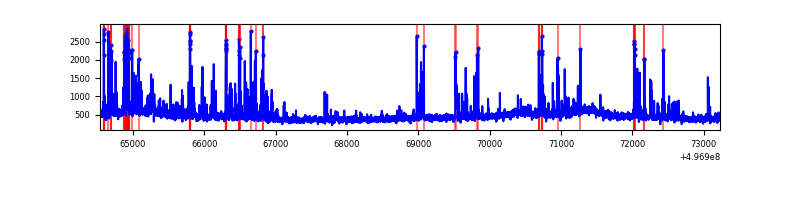 |
| B | 8691 | 8691 | 187 | 187 | 2.15% | 2.15% | 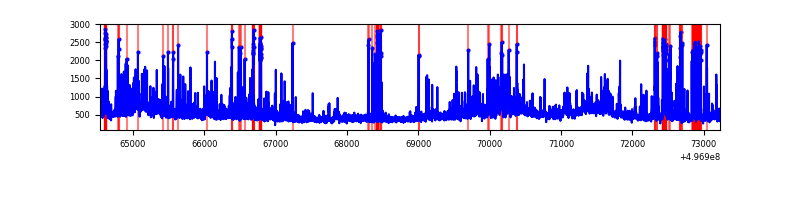 |
| C | 8691 | 8691 | 16 | 16 | 0.18% | 0.18% | 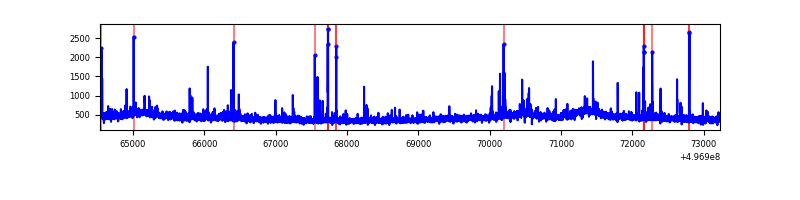 |
| D | 8691 | 8691 | 3615 | 3615 | 41.59% | 41.59% | 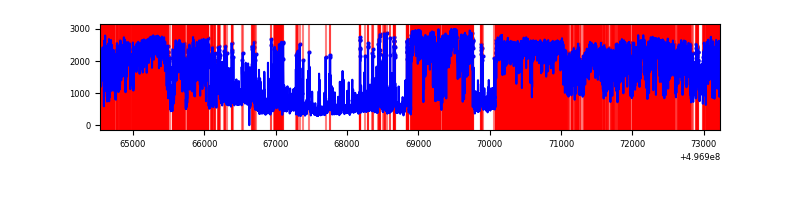 |
Top three noisy pixels from each quadrant. If the there are fewer than three noisy pixels in the level2.evt file, extra rows are filled as -1
| Pixel properties | Quadrant properties | ||||||
|---|---|---|---|---|---|---|---|
| Quadrant | DetID | PixID | Counts | Sigma | Mean | Median | Sigma |
| A | 15 | 174 | 313754 | 1347.81 | 928 | 903 | 232.1 |
| A | 0 | 8 | 187029 | 801.86 | 928 | 903 | 232.1 |
| A | 3 | 14 | 96426 | 411.53 | 928 | 903 | 232.1 |
| B | 5 | 236 | 392707 | 2023.1 | 913 | 879 | 193.7 |
| B | 15 | 20 | 252187 | 1297.56 | 913 | 879 | 193.7 |
| B | 4 | 171 | 206973 | 1064.11 | 913 | 879 | 193.7 |
| C | 14 | 254 | 48846 | 189.9 | 914 | 906 | 252.4 |
| C | 13 | 3 | 40825 | 158.13 | 914 | 906 | 252.4 |
| C | 12 | 252 | 33981 | 131.02 | 914 | 906 | 252.4 |
| D | 7 | 70 | 5772848 | 28559.17 | 712 | 679 | 202.1 |
| D | 2 | 172 | 2808009 | 13889.93 | 712 | 679 | 202.1 |
| D | 8 | 176 | 1907367 | 9433.79 | 712 | 679 | 202.1 |
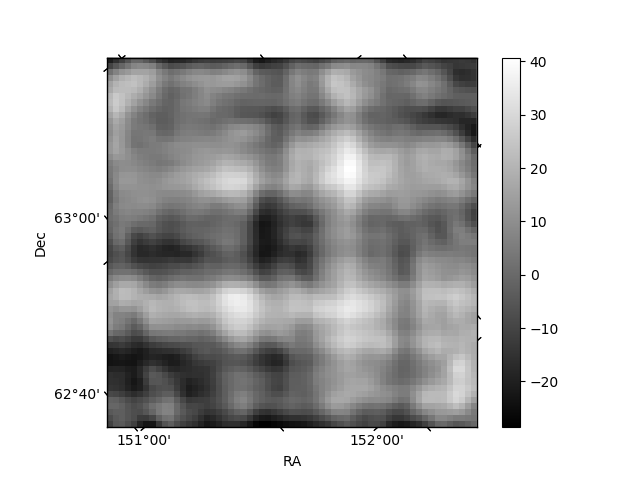
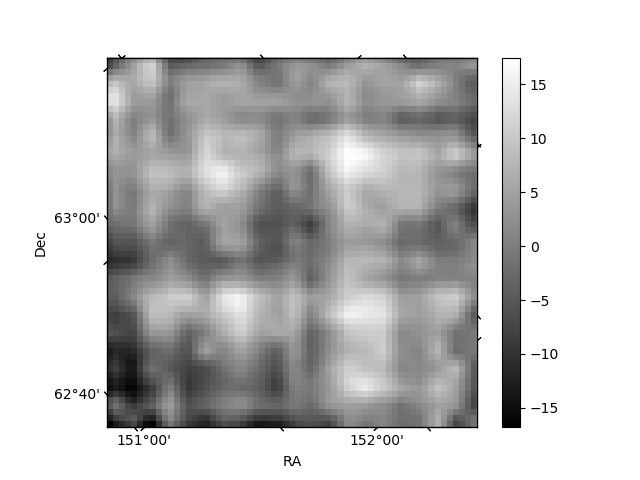
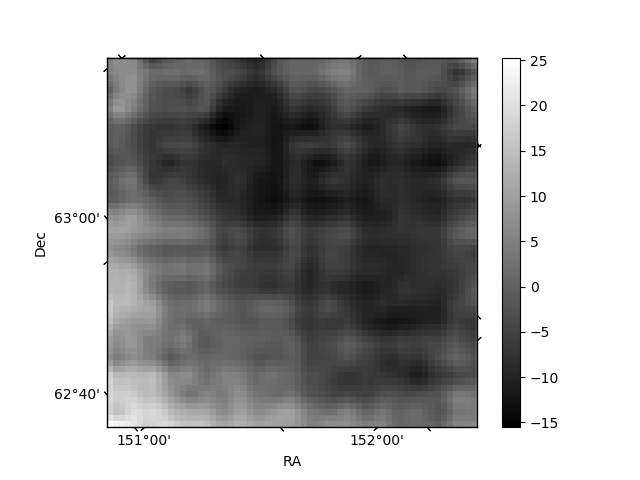
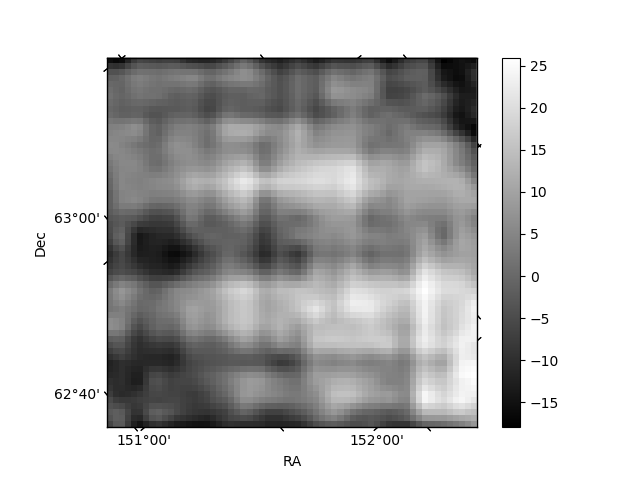
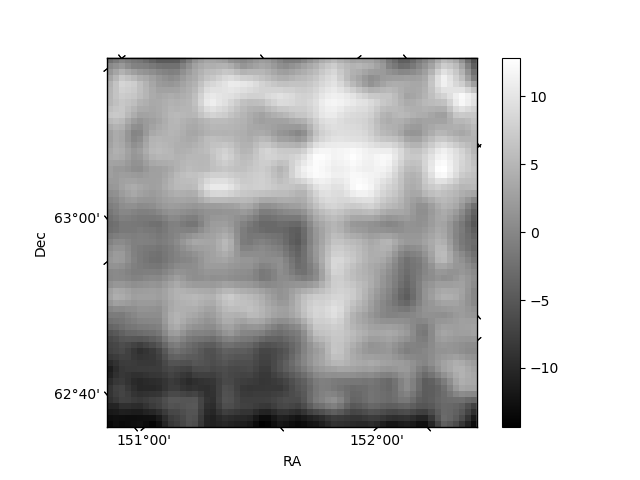
Histogram calculated using DETX and DETY for each event in the final _common_clean file
| Quadrant A | 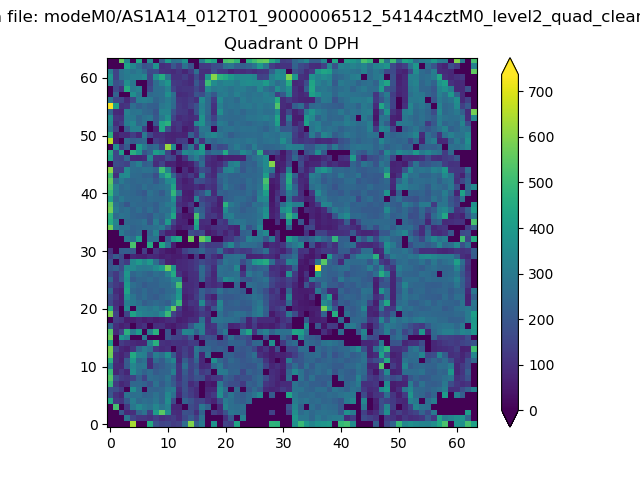 |
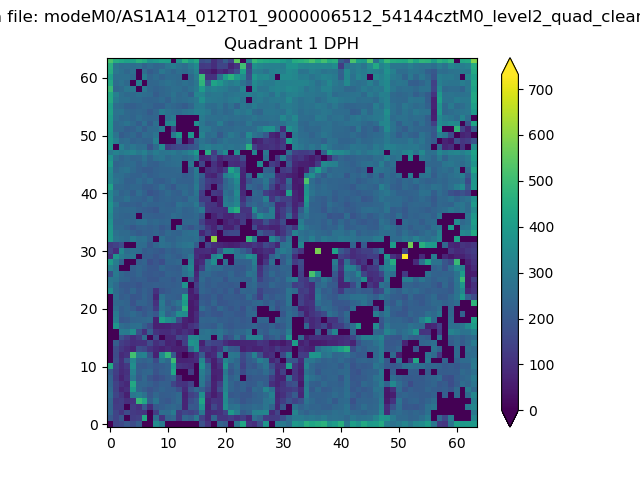 |
Quadrant B |
|---|---|---|---|
| Quadrant D | 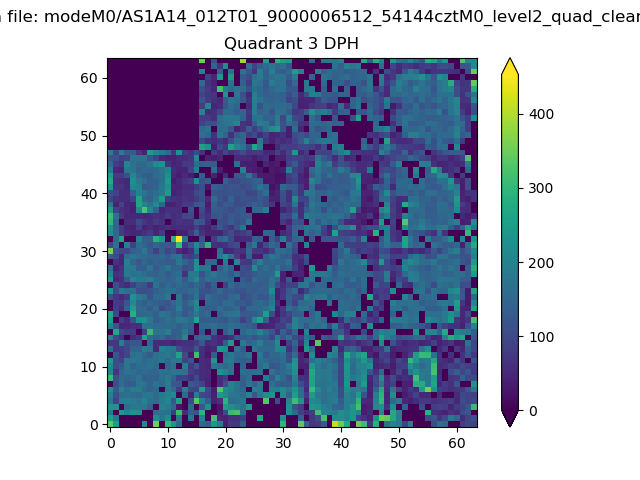 |
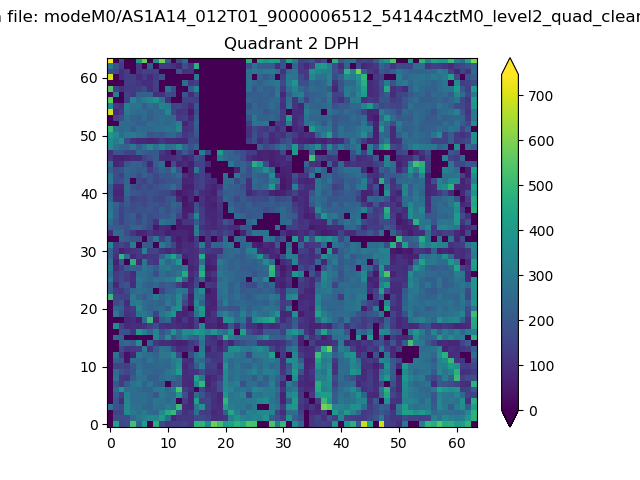 |
Quadrant C |
| Plot type | Count rate plots | Images |
|---|---|---|
| Comparison with Poisson distribution Blue bars denote a histogram of data divided into 1 sec bins. Red curve is a Poisson curve with rate = median count rate of data. |
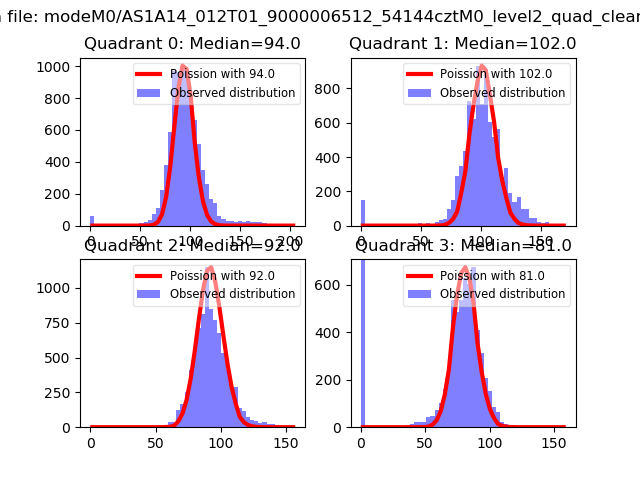 |
 |
| Quadrant-wise count rates Data is divided into 100 sec bins |
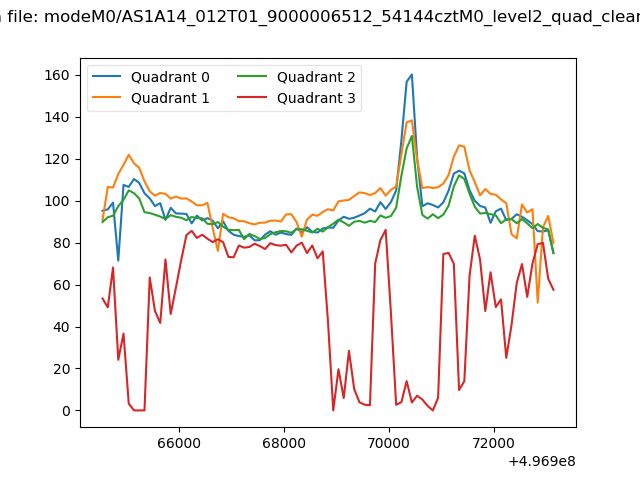 |
|
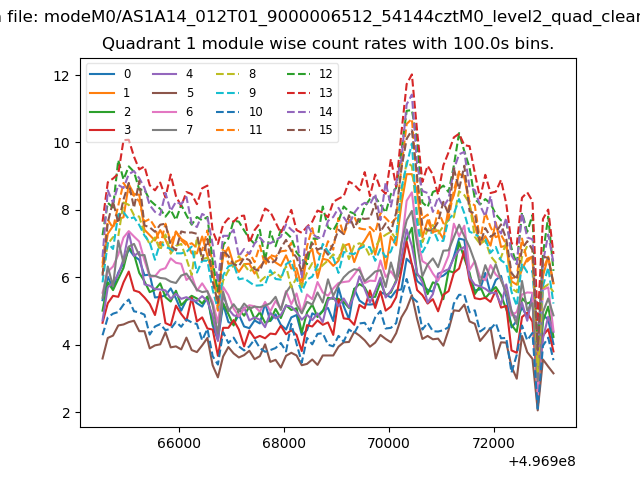
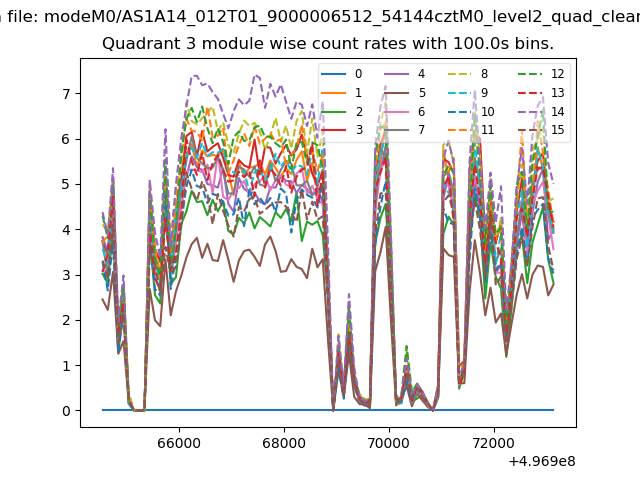
| Module-wise count rates for Quadrant A Data is divided into 100 sec bins |
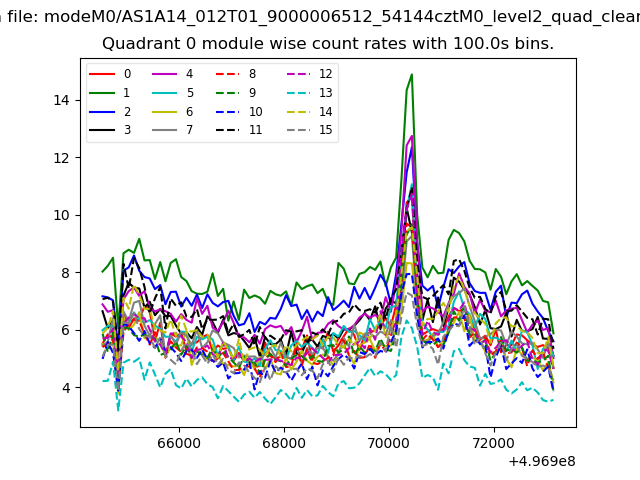 |
 |
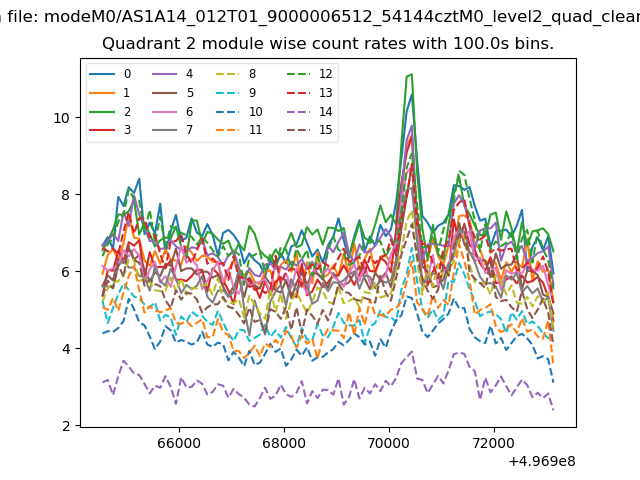
| Module-wise count rates for Quadrant B Data is divided into 100 sec bins |
 |
 |
| Module-wise count rates for Quadrant C Data is divided into 100 sec bins |
 |
 |
| Module-wise count rates for Quadrant D Data is divided into 100 sec bins |
 |
 |
| Parameter | Plot |
|---|---|
| CZT HV Monitor | 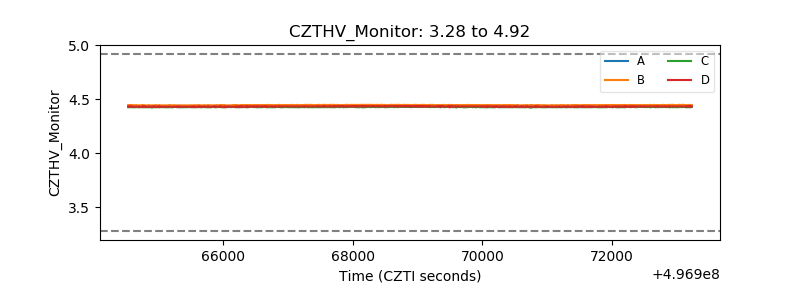 |
| D_VDD | 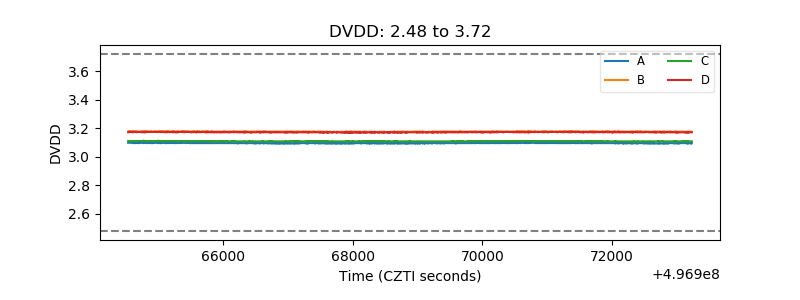 |
| Temperature 1 | 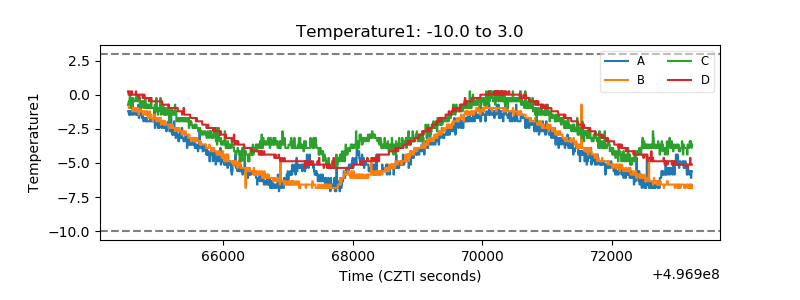 |
| Veto HV Monitor | 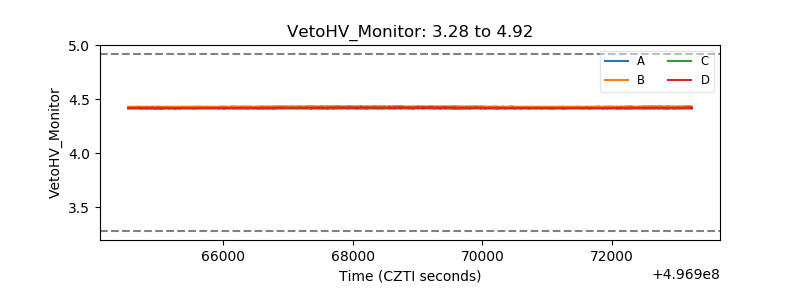 |
| Veto LLD | 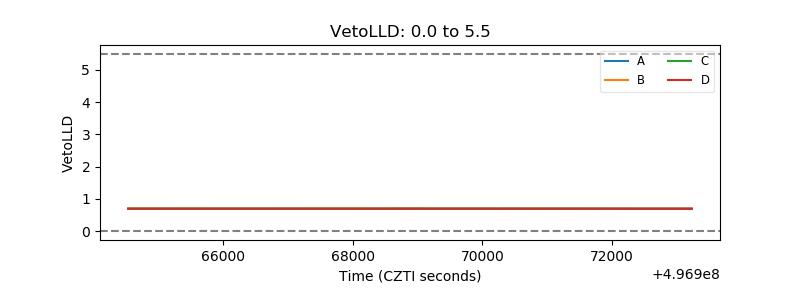 |
| Alpha Counter | 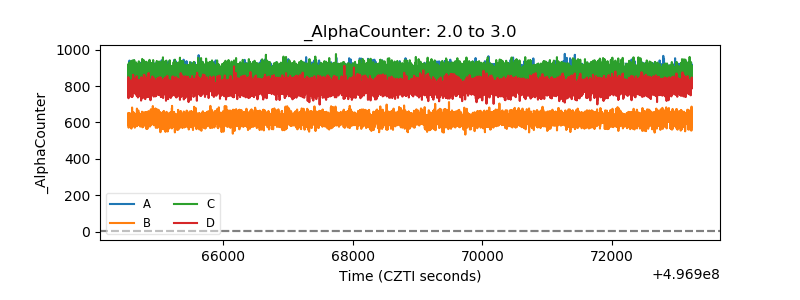 |
| _CPM_Rate | 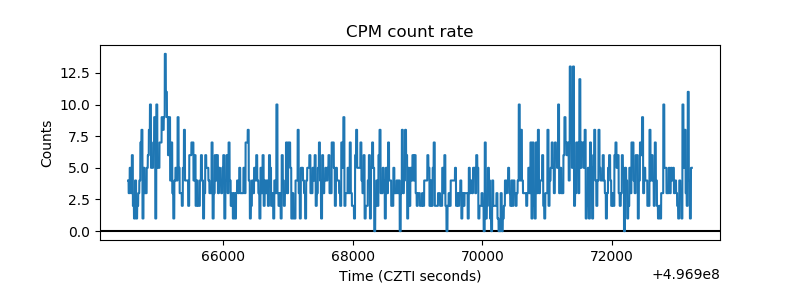 |
| CZT Counter | 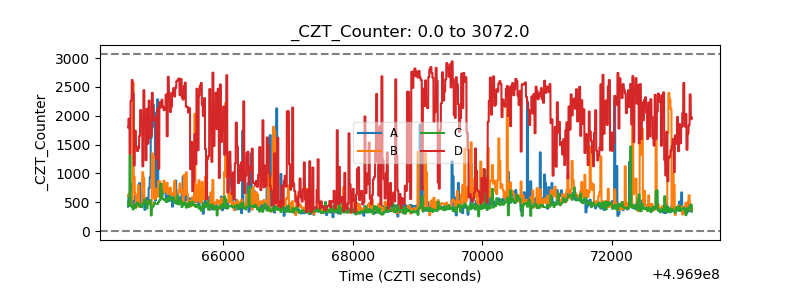 |
| +2.5 Volts monitor | 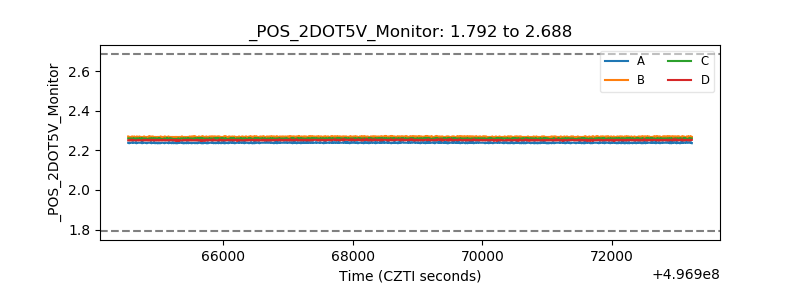 |
| +5 Volts monitor |  |
| _ROLL_ROT | 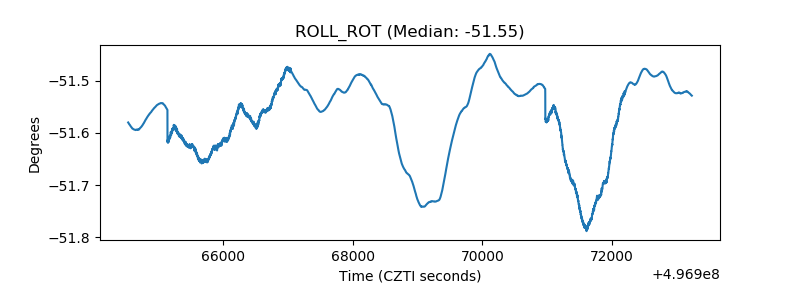 |
| _Roll_DEC | 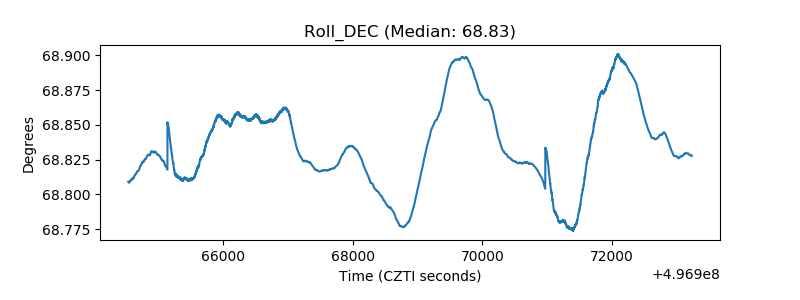 |
| _Roll_RA | 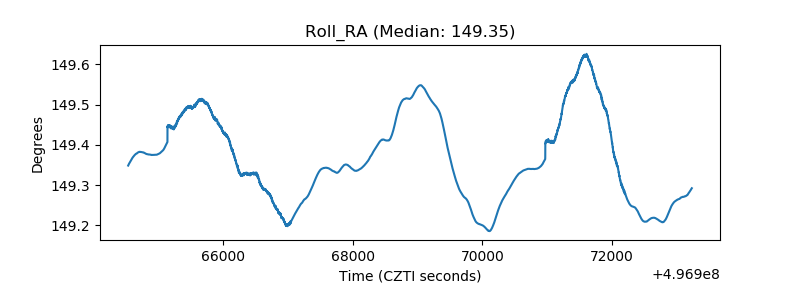 |
| Veto Counter | 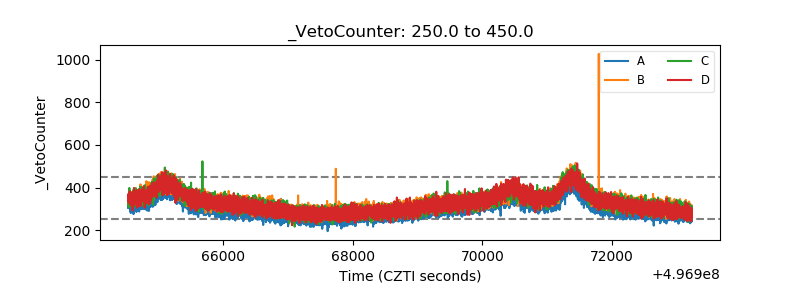 |