| Param | Original file | Final file |
|---|---|---|
| Filename | modeM0/AS1A14_012T01_9000006512_54147cztM0_level2.fits | modeM0/AS1A14_012T01_9000006512_54147cztM0_level2_quad_clean.evt |
| Size (bytes) | 1,750,907,520 | 260,415,360 |
| Size | 1.6 GB | 248.4 MB |
| Events in quadrant A | 10,267,668 | 1,793,425 |
| Events in quadrant B | 13,716,829 | 1,840,741 |
| Events in quadrant C | 11,512,298 | 1,678,814 |
| Events in quadrant D | 27,794,297 | 1,213,355 |
| Mode SS | |||
|---|---|---|---|
| Quadrant | BADHDUFLAG | Total packets | Discarded packets |
| A | 0 | 400 | 0 |
| B | 0 | 400 | 0 |
| C | 0 | 400 | 0 |
| D | 0 | 400 | 0 |
| Mode M0 | |||
|---|---|---|---|
| Quadrant | BADHDUFLAG | Total packets | Discarded packets |
| A | 0 | 45225 | 3 |
| B | 0 | 54814 | 4 |
| C | 0 | 49491 | 3 |
| D | 0 | 96278 | 3 |
| Mode M9 | |||
|---|---|---|---|
| Quadrant | BADHDUFLAG | Total packets | Discarded packets |
| A | 0 | 12 | 0 |
| B | 0 | 12 | 0 |
| C | 0 | 12 | 0 |
| D | 0 | 12 | 0 |
| Quadrant | Total seconds | Saturated seconds | Saturation percentage |
|---|---|---|---|
| A | 19703 | 360 | 1.827133% |
| B | 19702 | 1288 | 6.537407% |
| C | 19703 | 987 | 5.009389% |
| D | 19703 | 5289 | 26.843628% |
Noise dominated data is calculated using 1-second bins in cleaned event files. If a bin has >2000 counts, and if more than 50% of those come from <1% of pixels, then it is considered to be noise-dominated and hence unusable.
| Quadrant | # 1 sec bins | Bins with >0 counts | Bins with >2000 counts | High rate bins dominated by noise | Noise dominated (total time) | Noise dominated (detector-on time) | Marked lightcurve |
|---|---|---|---|---|---|---|---|
| A | 20893 | 19706 | 225 | 225 | 1.08% | 1.14% | 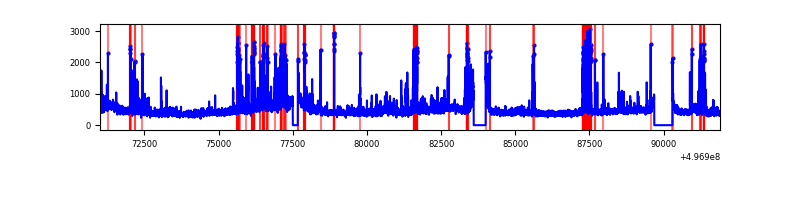 |
| B | 20892 | 19705 | 934 | 934 | 4.47% | 4.74% | 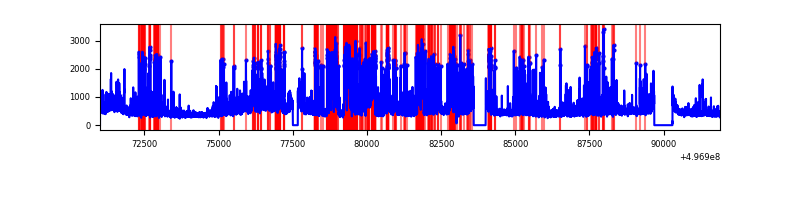 |
| C | 20893 | 19706 | 1011 | 1011 | 4.84% | 5.13% | 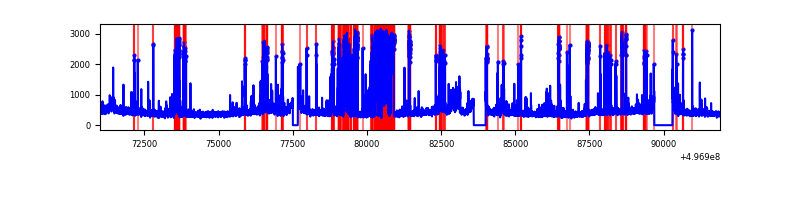 |
| D | 20893 | 19706 | 5545 | 5545 | 26.54% | 28.14% | 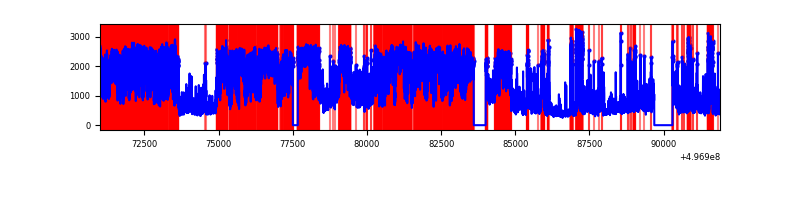 |
Top three noisy pixels from each quadrant. If the there are fewer than three noisy pixels in the level2.evt file, extra rows are filled as -1
| Pixel properties | Quadrant properties | ||||||
|---|---|---|---|---|---|---|---|
| Quadrant | DetID | PixID | Counts | Sigma | Mean | Median | Sigma |
| A | 15 | 174 | 833380 | 1643.57 | 2064 | 2014 | 505.8 |
| A | 10 | 253 | 353916 | 695.69 | 2064 | 2014 | 505.8 |
| A | 3 | 14 | 256460 | 503.03 | 2064 | 2014 | 505.8 |
| B | 5 | 185 | 2967524 | 6900.77 | 2016 | 1941 | 429.7 |
| B | 4 | 171 | 566397 | 1313.46 | 2016 | 1941 | 429.7 |
| B | 15 | 20 | 519612 | 1204.6 | 2016 | 1941 | 429.7 |
| C | 1 | 241 | 2809807 | 5164.15 | 1987 | 1965 | 543.7 |
| C | 15 | 233 | 189670 | 345.22 | 1987 | 1965 | 543.7 |
| C | 1 | 16 | 107958 | 194.94 | 1987 | 1965 | 543.7 |
| D | 7 | 70 | 16497300 | 31640.46 | 1840 | 1752 | 521.3 |
| D | 8 | 176 | 930696 | 1781.83 | 1840 | 1752 | 521.3 |
| D | 2 | 172 | 743935 | 1423.6 | 1840 | 1752 | 521.3 |
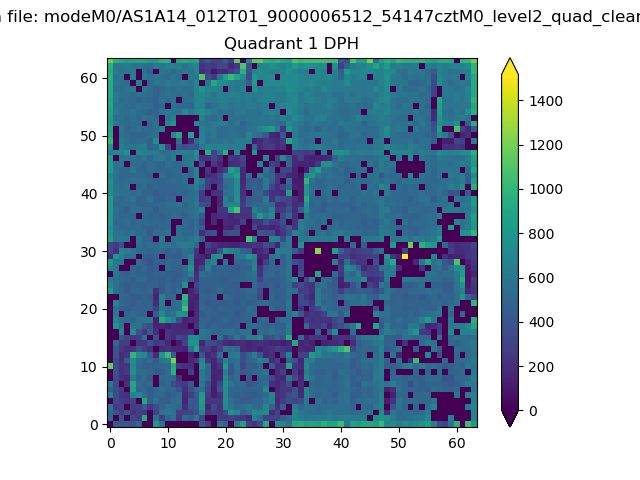
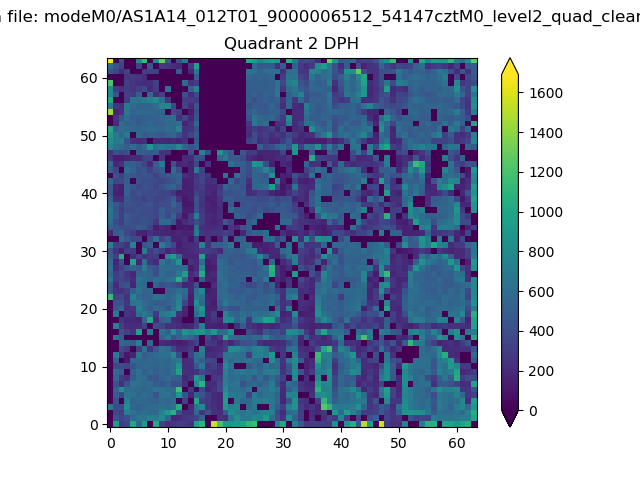
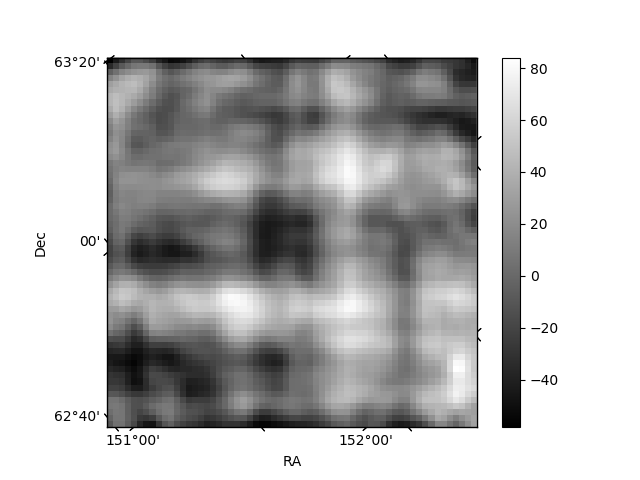
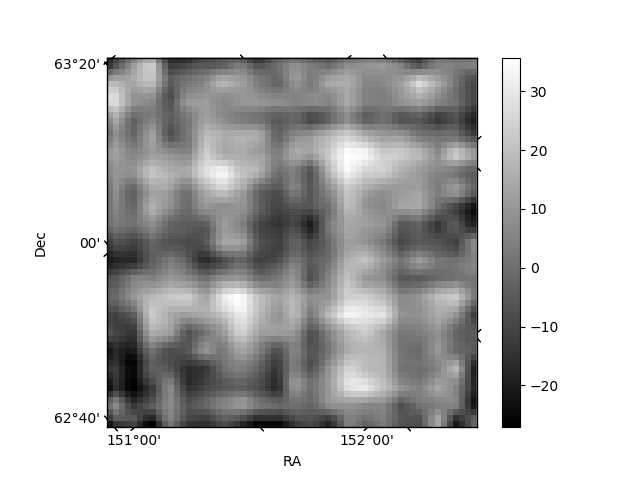
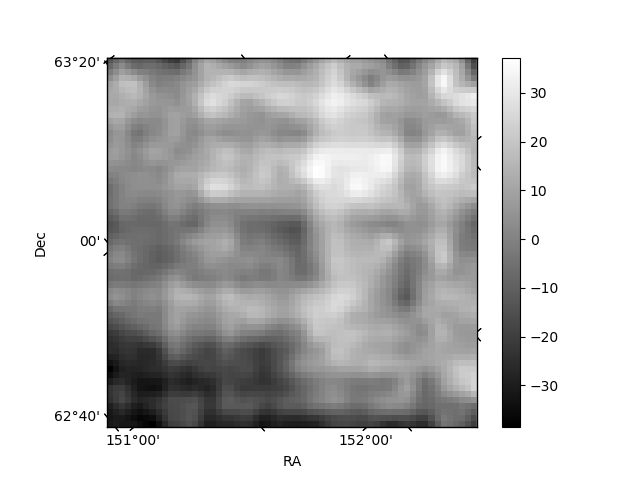
Histogram calculated using DETX and DETY for each event in the final _common_clean file
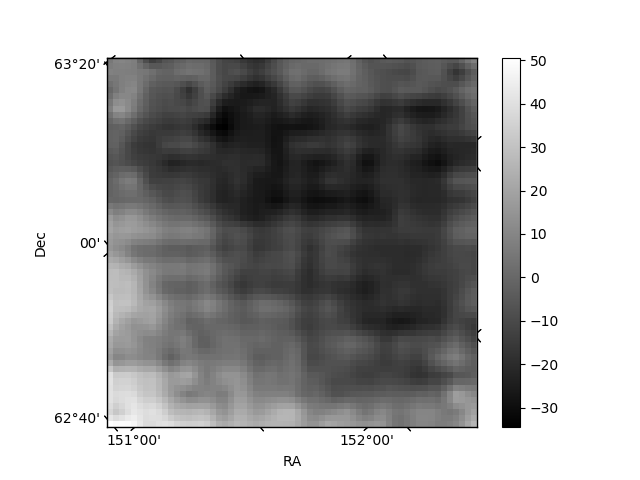
| Quadrant A |  |
 |
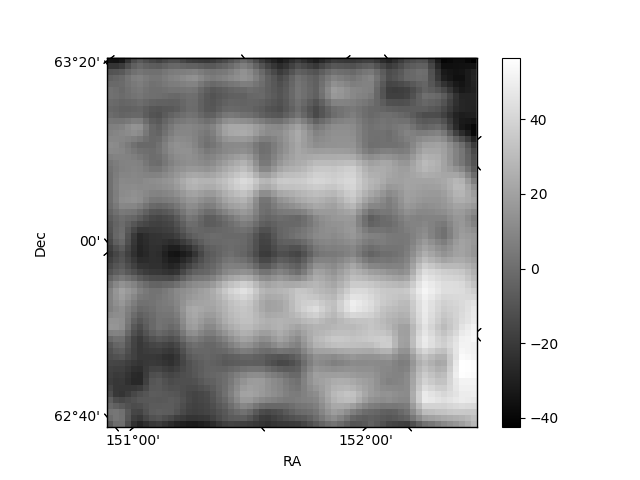
Quadrant B |
|---|---|---|---|
| Quadrant D | 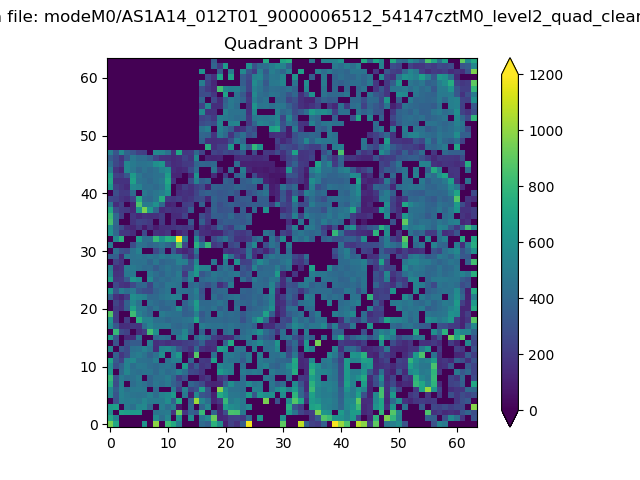 |
 |
Quadrant C |
| Plot type | Count rate plots | Images |
|---|---|---|
| Comparison with Poisson distribution Blue bars denote a histogram of data divided into 1 sec bins. Red curve is a Poisson curve with rate = median count rate of data. |
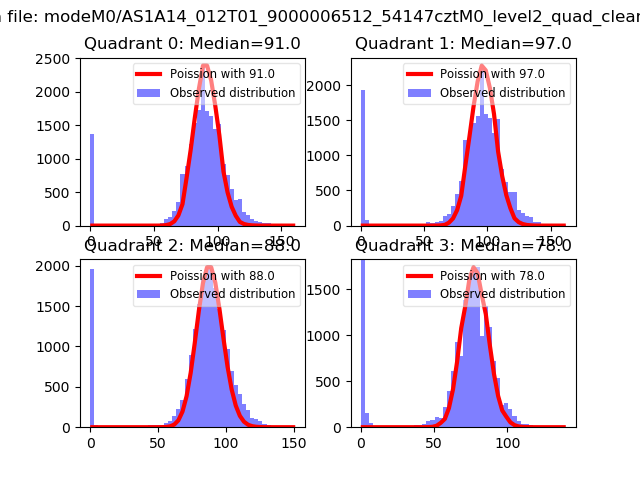 |
 |
| Quadrant-wise count rates Data is divided into 100 sec bins |
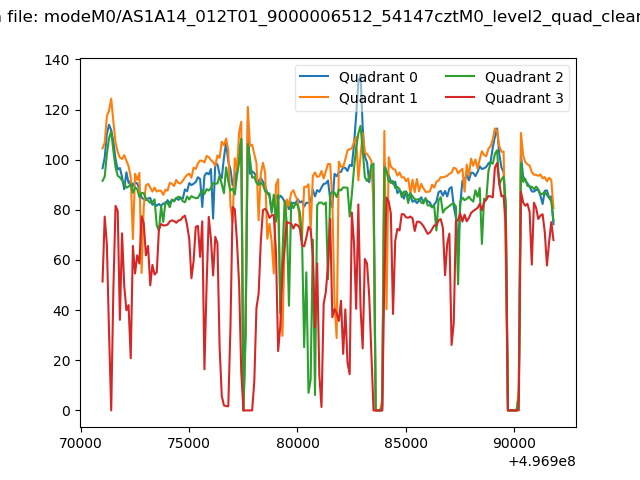 |
|
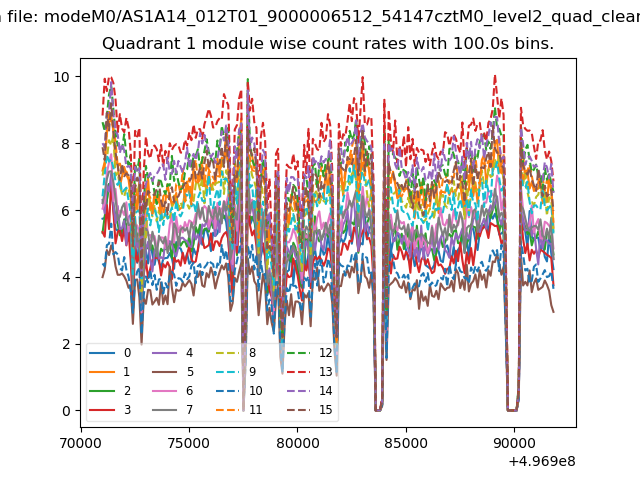
| Module-wise count rates for Quadrant A Data is divided into 100 sec bins |
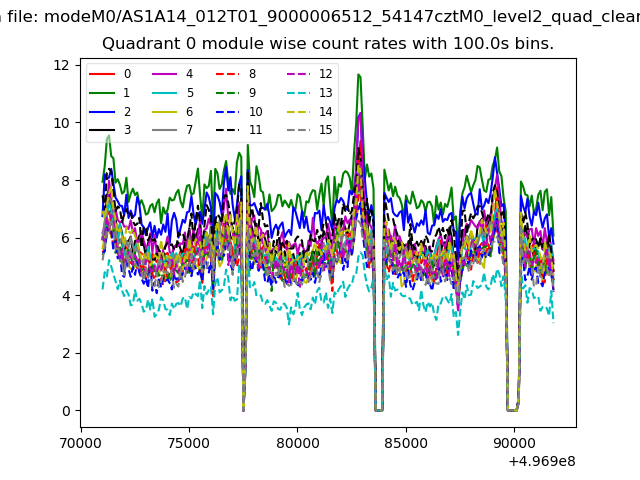 |
 |
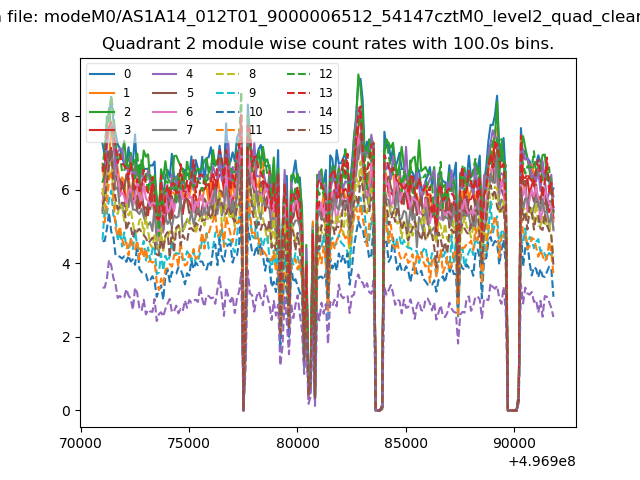
| Module-wise count rates for Quadrant B Data is divided into 100 sec bins |
 |
 |
| Module-wise count rates for Quadrant C Data is divided into 100 sec bins |
 |
 |
| Module-wise count rates for Quadrant D Data is divided into 100 sec bins |
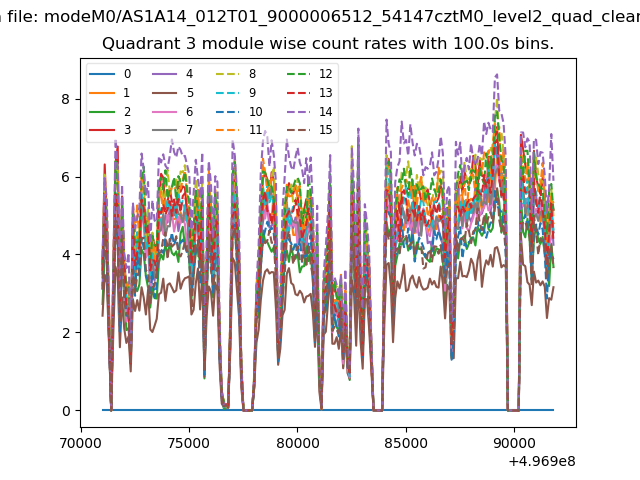 |
 |
| Parameter | Plot |
|---|---|
| CZT HV Monitor | 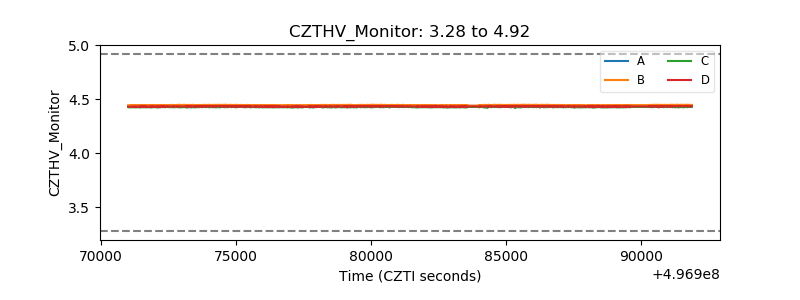 |
| D_VDD | 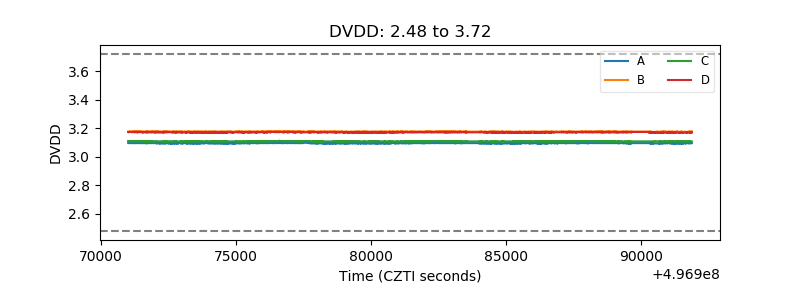 |
| Temperature 1 | 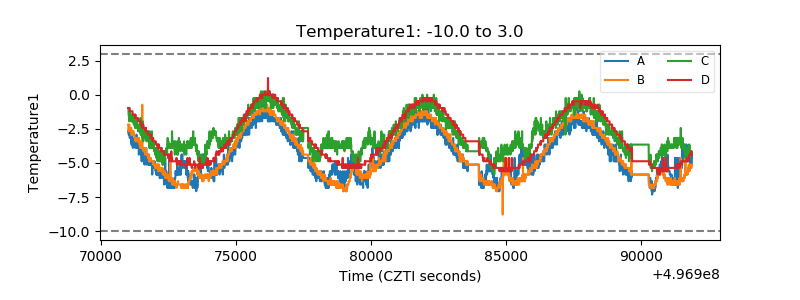 |
| Veto HV Monitor | 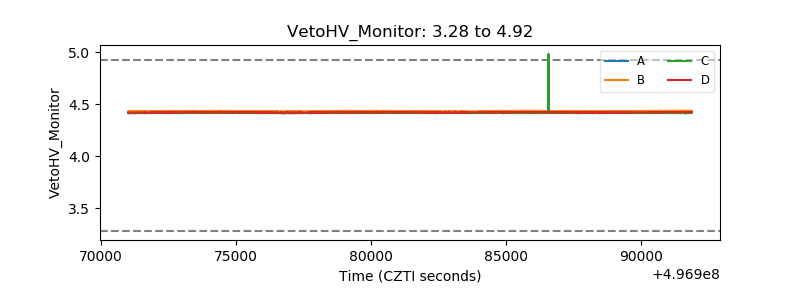 |
| Veto LLD | 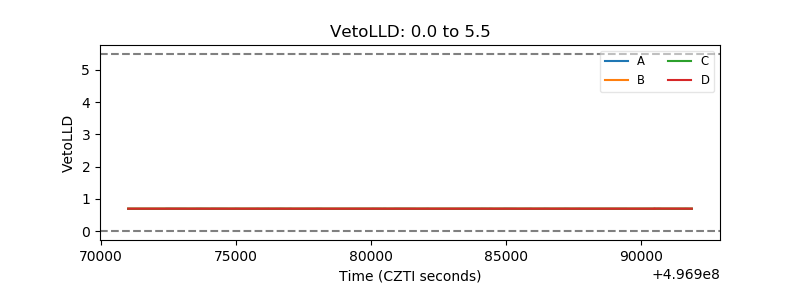 |
| Alpha Counter | 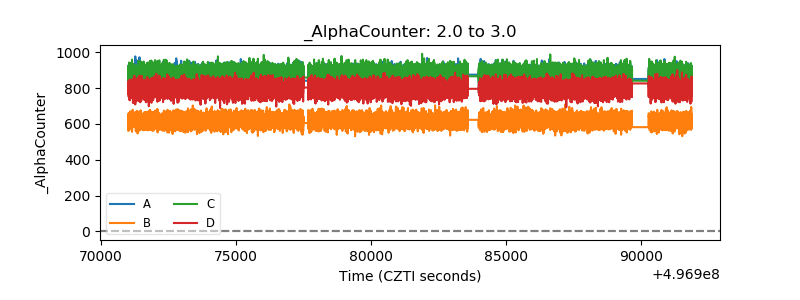 |
| _CPM_Rate | 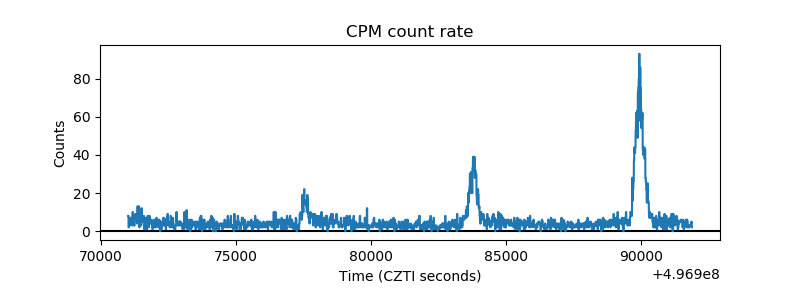 |
| CZT Counter | 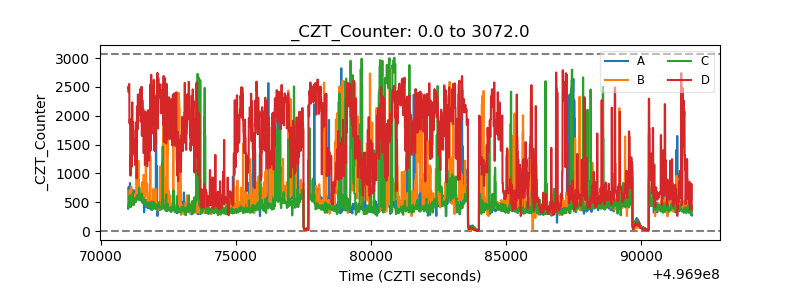 |
| +2.5 Volts monitor | 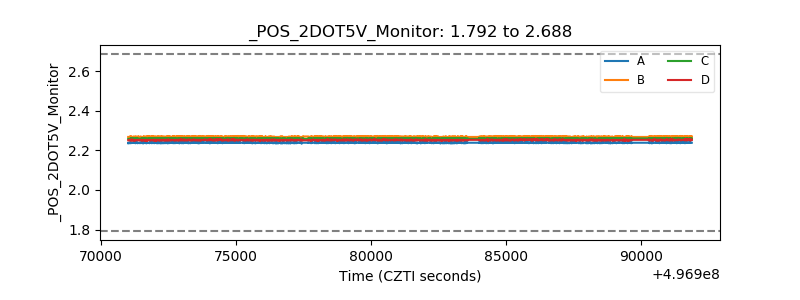 |
| +5 Volts monitor |  |
| _ROLL_ROT | 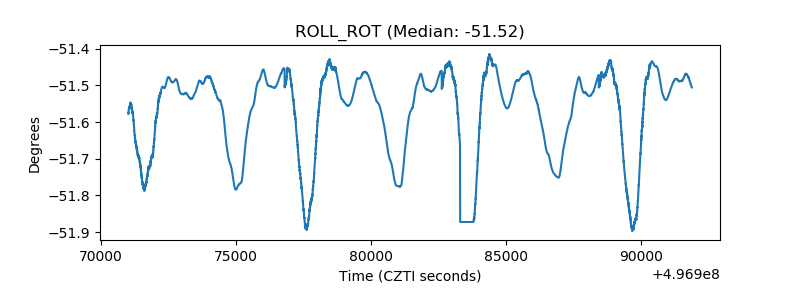 |
| _Roll_DEC | 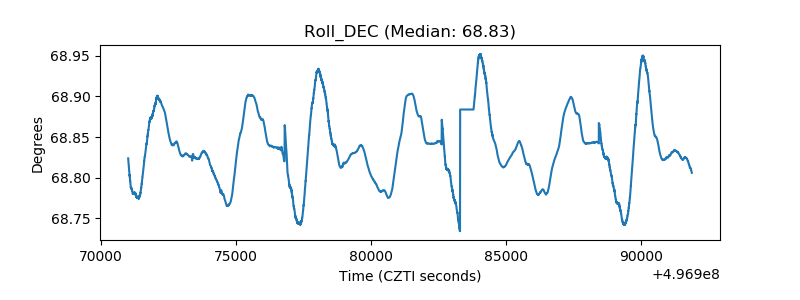 |
| _Roll_RA | 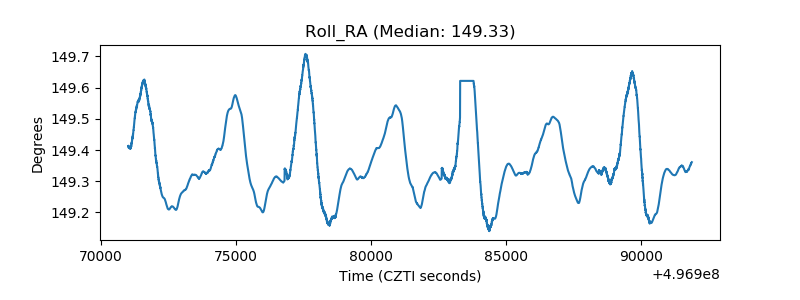 |
| Veto Counter | 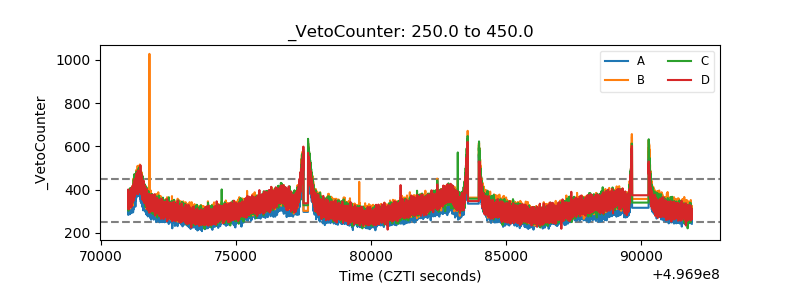 |