| Param | Original file | Final file |
|---|---|---|
| Filename | modeM0/AS1A14_012T01_9000006512_54150cztM0_level2.fits | modeM0/AS1A14_012T01_9000006512_54150cztM0_level2_quad_clean.evt |
| Size (bytes) | 506,232,000 | 81,524,160 |
| Size | 482.8 MB | 77.7 MB |
| Events in quadrant A | 3,488,184 | 572,590 |
| Events in quadrant B | 2,945,391 | 613,421 |
| Events in quadrant C | 5,506,393 | 448,574 |
| Events in quadrant D | 6,329,468 | 412,492 |
| Mode SS | |||
|---|---|---|---|
| Quadrant | BADHDUFLAG | Total packets | Discarded packets |
| A | 0 | 122 | 0 |
| B | 0 | 122 | 0 |
| C | 0 | 122 | 0 |
| D | 0 | 122 | 0 |
| Mode M0 | |||
|---|---|---|---|
| Quadrant | BADHDUFLAG | Total packets | Discarded packets |
| A | 0 | 14798 | 1 |
| B | 0 | 13195 | 1 |
| C | 0 | 21102 | 1 |
| D | 0 | 22994 | 1 |
| Mode M9 | |||
|---|---|---|---|
| Quadrant | BADHDUFLAG | Total packets | Discarded packets |
| A | 0 | 9 | 0 |
| B | 0 | 9 | 0 |
| C | 0 | 9 | 0 |
| D | 0 | 9 | 0 |
| Quadrant | Total seconds | Saturated seconds | Saturation percentage |
|---|---|---|---|
| A | 6037 | 200 | 3.312904% |
| B | 6037 | 88 | 1.457678% |
| C | 6036 | 1127 | 18.671306% |
| D | 6036 | 1290 | 21.371769% |
Noise dominated data is calculated using 1-second bins in cleaned event files. If a bin has >2000 counts, and if more than 50% of those come from <1% of pixels, then it is considered to be noise-dominated and hence unusable.
| Quadrant | # 1 sec bins | Bins with >0 counts | Bins with >2000 counts | High rate bins dominated by noise | Noise dominated (total time) | Noise dominated (detector-on time) | Marked lightcurve |
|---|---|---|---|---|---|---|---|
| A | 6972 | 6038 | 167 | 167 | 2.40% | 2.77% | 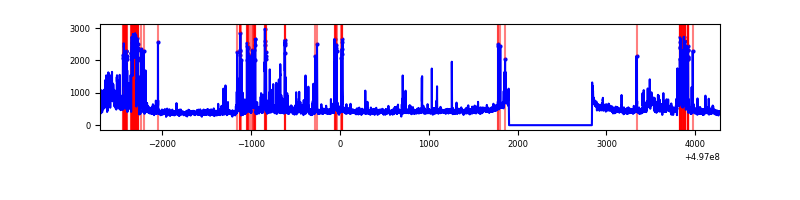 |
| B | 6972 | 6038 | 31 | 31 | 0.44% | 0.51% | 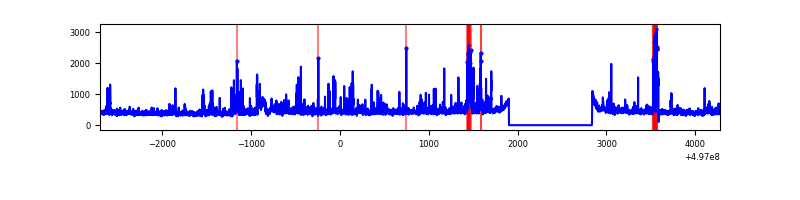 |
| C | 6971 | 6037 | 1135 | 1135 | 16.28% | 18.80% | 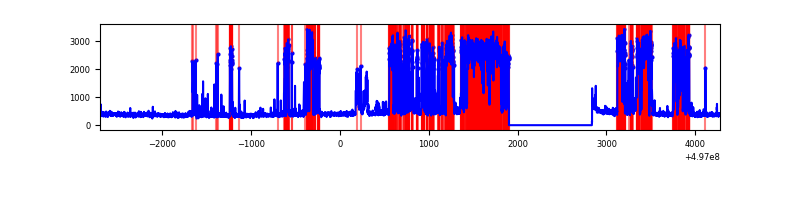 |
| D | 6971 | 6037 | 1234 | 1234 | 17.70% | 20.44% | 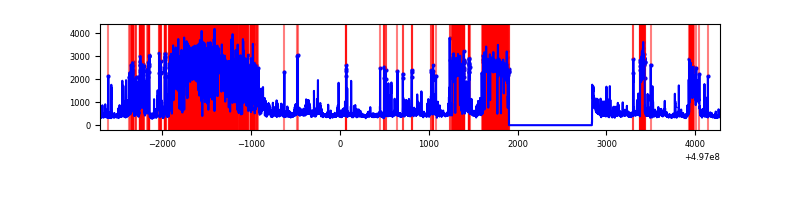 |
Top three noisy pixels from each quadrant. If the there are fewer than three noisy pixels in the level2.evt file, extra rows are filled as -1
| Pixel properties | Quadrant properties | ||||||
|---|---|---|---|---|---|---|---|
| Quadrant | DetID | PixID | Counts | Sigma | Mean | Median | Sigma |
| A | 15 | 174 | 668568 | 4309.01 | 624 | 610 | 155.0 |
| A | 7 | 29 | 200176 | 1287.4 | 624 | 610 | 155.0 |
| A | 0 | 8 | 71361 | 456.42 | 624 | 610 | 155.0 |
| B | 5 | 236 | 209599 | 1582.77 | 616 | 596 | 132.0 |
| B | 5 | 185 | 85880 | 645.85 | 616 | 596 | 132.0 |
| B | 10 | 245 | 60842 | 456.24 | 616 | 596 | 132.0 |
| C | 1 | 241 | 3073015 | 20482.51 | 537 | 532 | 150.0 |
| C | 0 | 224 | 147001 | 976.43 | 537 | 532 | 150.0 |
| C | 9 | 53 | 77791 | 515.04 | 537 | 532 | 150.0 |
| D | 8 | 176 | 2268126 | 14872.62 | 533 | 509 | 152.5 |
| D | 13 | 21 | 937485 | 6145.34 | 533 | 509 | 152.5 |
| D | 10 | 181 | 269460 | 1763.97 | 533 | 509 | 152.5 |
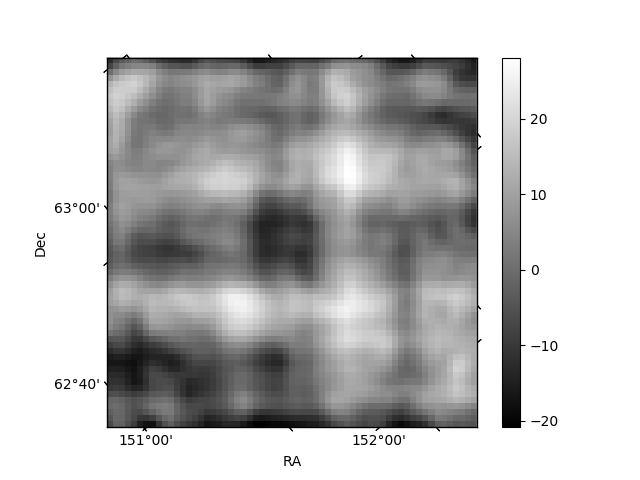
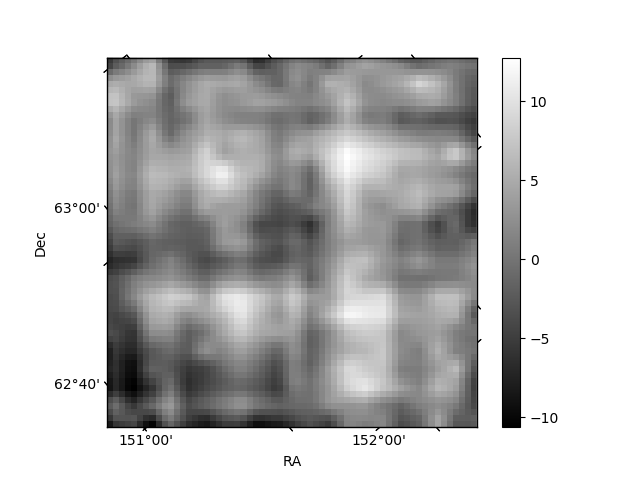
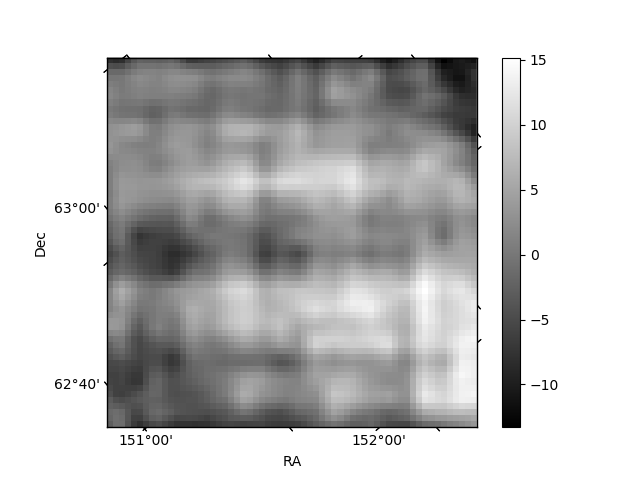
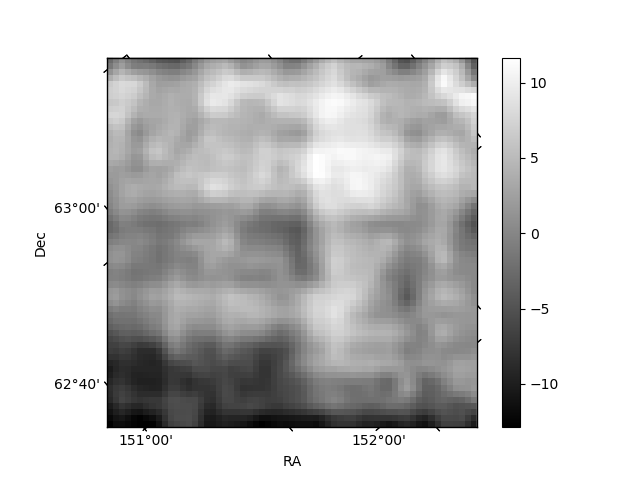
Histogram calculated using DETX and DETY for each event in the final _common_clean file
| Quadrant A | 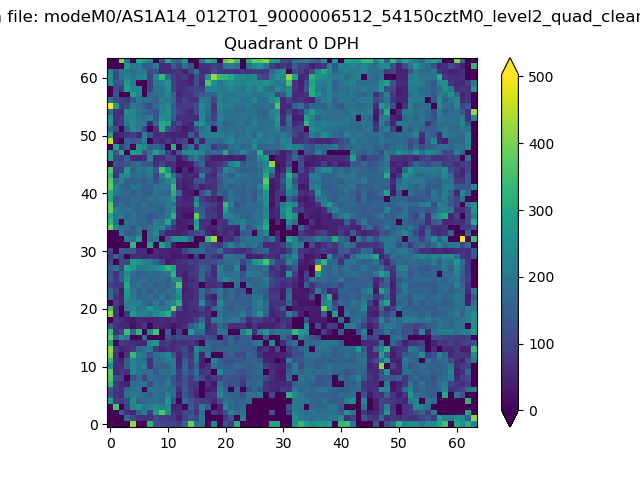 |
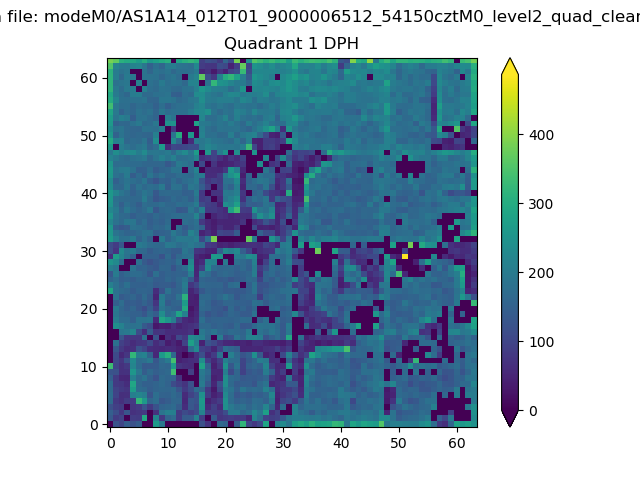 |
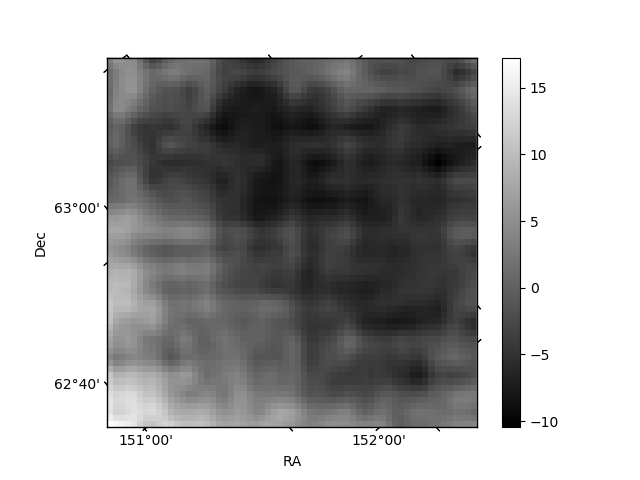
Quadrant B |
|---|---|---|---|
| Quadrant D | 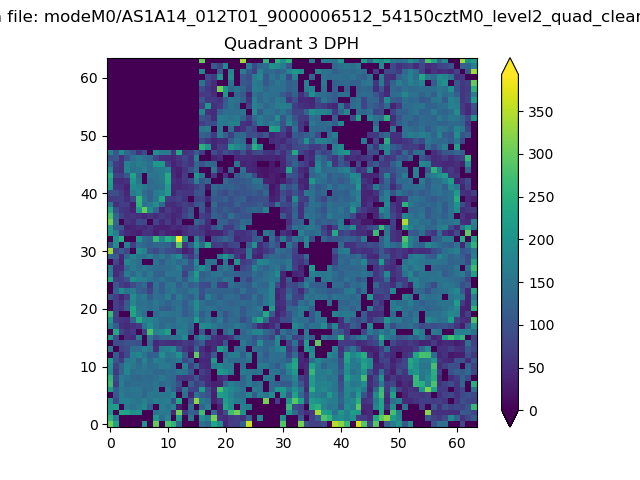 |
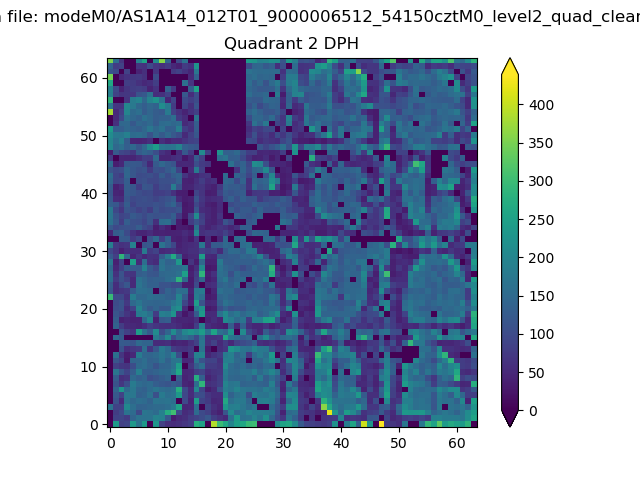 |
Quadrant C |
| Plot type | Count rate plots | Images |
|---|---|---|
| Comparison with Poisson distribution Blue bars denote a histogram of data divided into 1 sec bins. Red curve is a Poisson curve with rate = median count rate of data. |
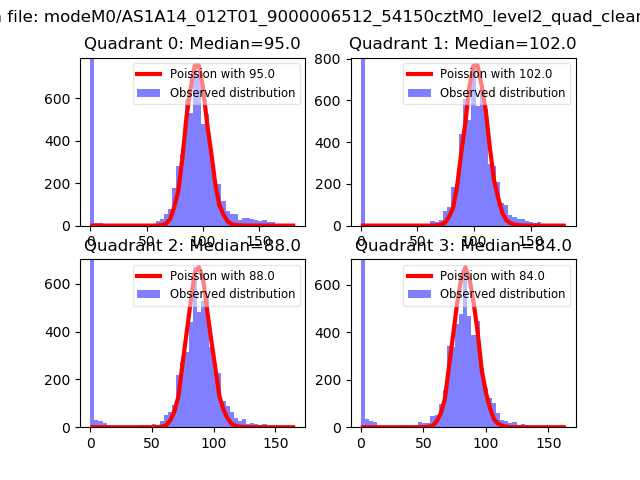 |
 |
| Quadrant-wise count rates Data is divided into 100 sec bins |
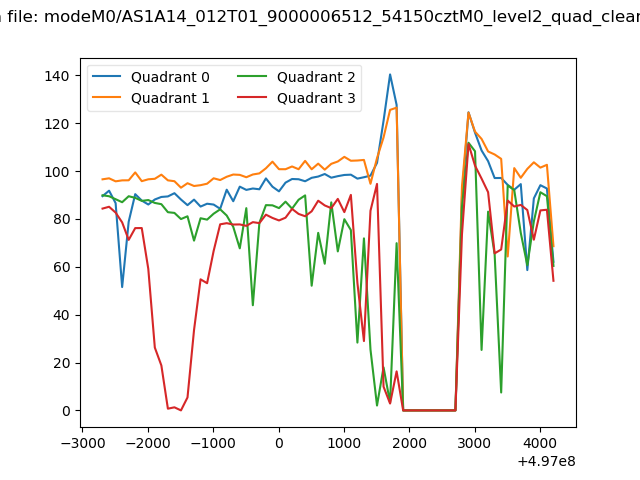 |
|
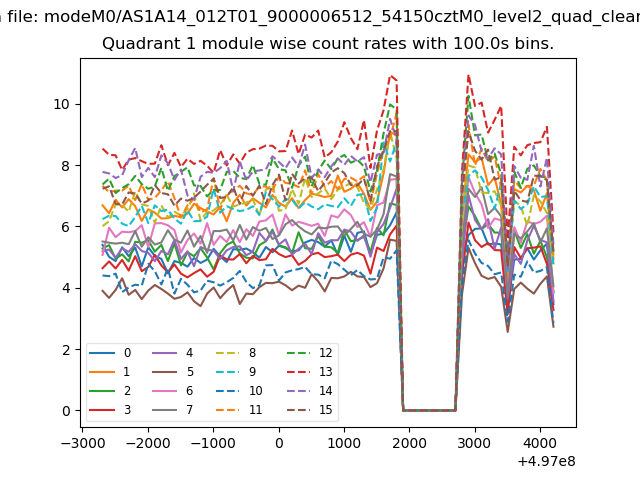
| Module-wise count rates for Quadrant A Data is divided into 100 sec bins |
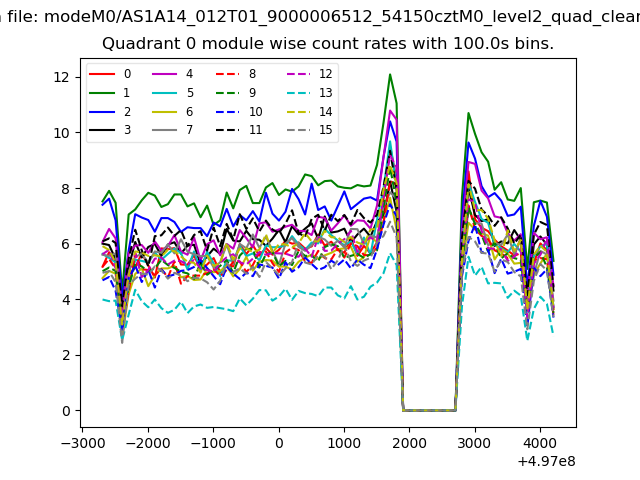 |
 |
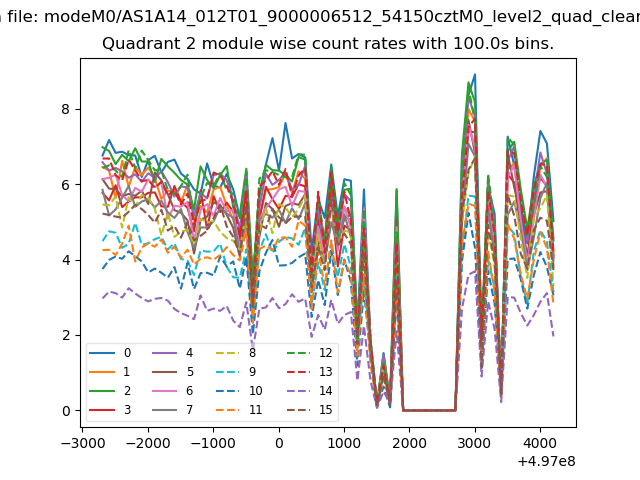
| Module-wise count rates for Quadrant B Data is divided into 100 sec bins |
 |
 |
| Module-wise count rates for Quadrant C Data is divided into 100 sec bins |
 |
 |
| Module-wise count rates for Quadrant D Data is divided into 100 sec bins |
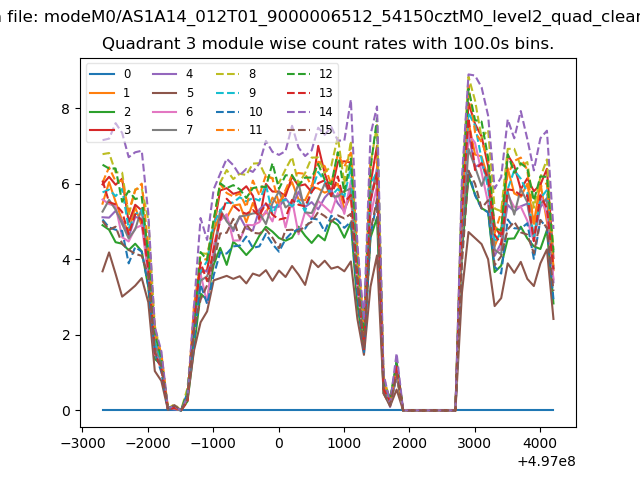 |
 |
| Parameter | Plot |
|---|---|
| CZT HV Monitor |  |
| D_VDD | 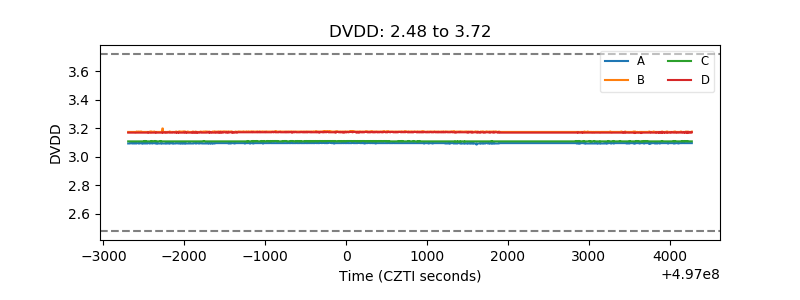 |
| Temperature 1 | 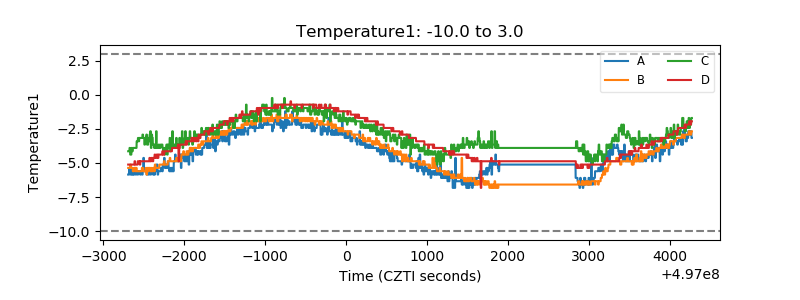 |
| Veto HV Monitor | 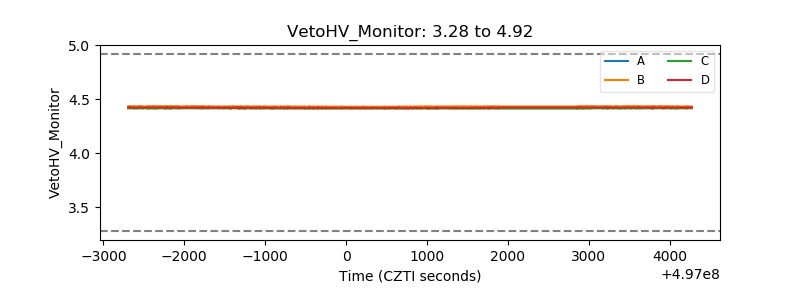 |
| Veto LLD | 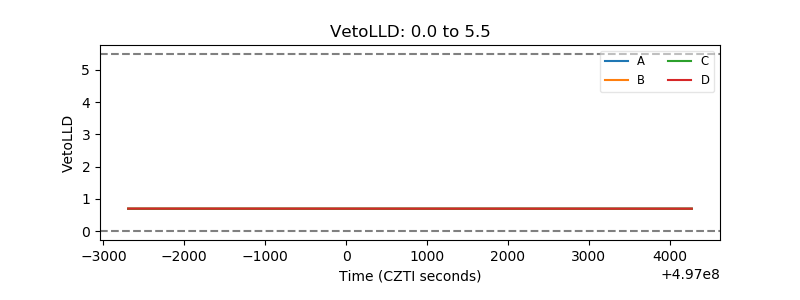 |
| Alpha Counter | 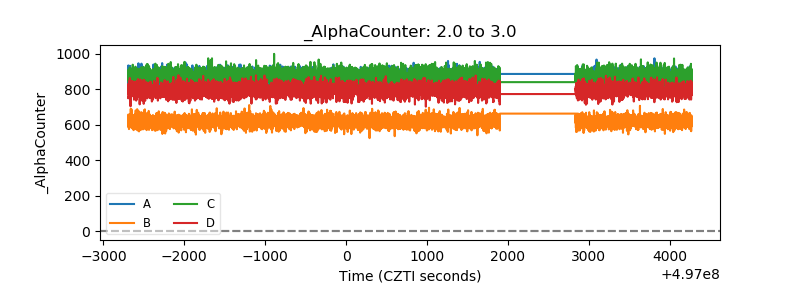 |
| _CPM_Rate | 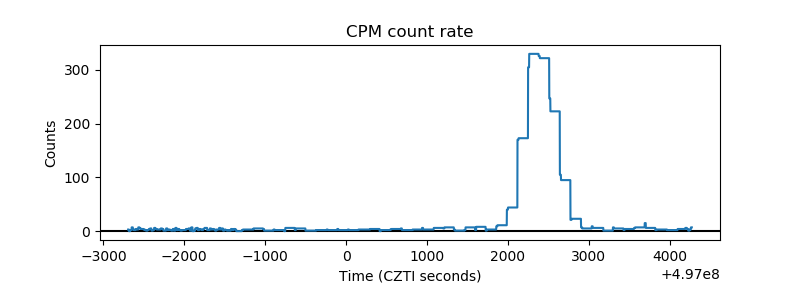 |
| CZT Counter | 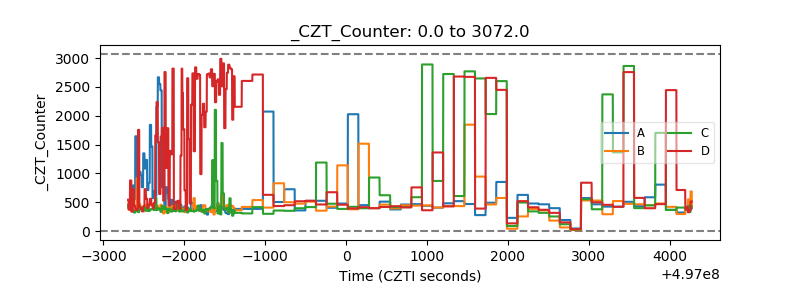 |
| +2.5 Volts monitor |  |
| +5 Volts monitor |  |
| _ROLL_ROT | 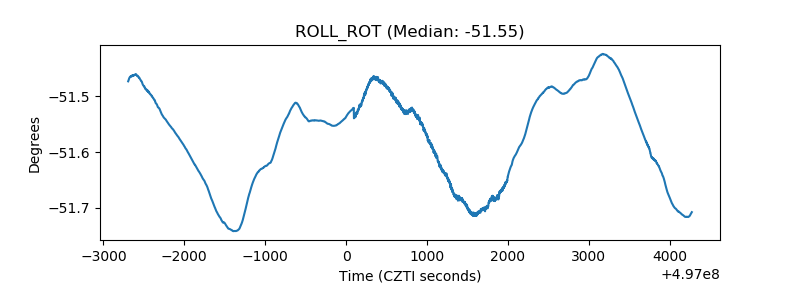 |
| _Roll_DEC | 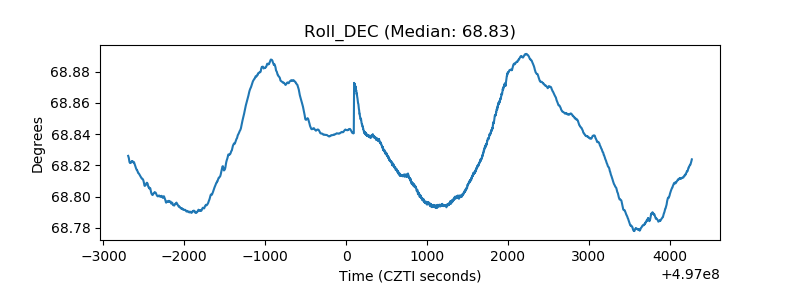 |
| _Roll_RA | 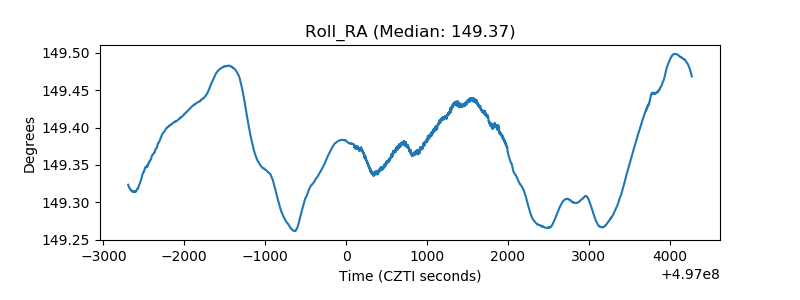 |
| Veto Counter | 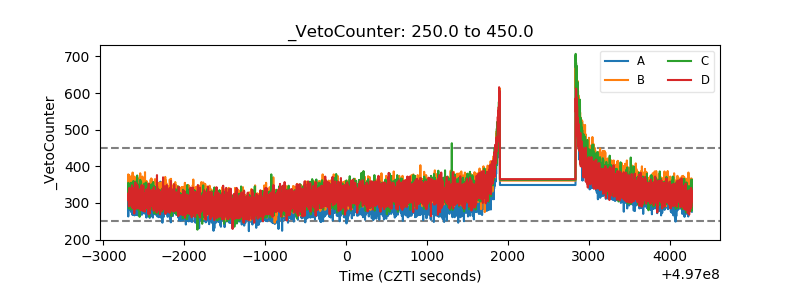 |