| Param | Original file | Final file |
|---|---|---|
| Filename | modeM0/AS1A14_012T01_9000006512_54152cztM0_level2.fits | modeM0/AS1A14_012T01_9000006512_54152cztM0_level2_quad_clean.evt |
| Size (bytes) | 414,138,240 | 90,889,920 |
| Size | 395.0 MB | 86.7 MB |
| Events in quadrant A | 3,747,229 | 591,914 |
| Events in quadrant B | 3,624,928 | 635,374 |
| Events in quadrant C | 2,617,670 | 577,062 |
| Events in quadrant D | 4,861,923 | 518,355 |
| Mode SS | |||
|---|---|---|---|
| Quadrant | BADHDUFLAG | Total packets | Discarded packets |
| A | 0 | 126 | 0 |
| B | 0 | 126 | 0 |
| C | 0 | 126 | 0 |
| D | 0 | 126 | 0 |
| Mode M0 | |||
|---|---|---|---|
| Quadrant | BADHDUFLAG | Total packets | Discarded packets |
| A | 0 | 15402 | 2 |
| B | 0 | 15070 | 2 |
| C | 0 | 12547 | 2 |
| D | 0 | 18733 | 2 |
| Mode M9 | |||
|---|---|---|---|
| Quadrant | BADHDUFLAG | Total packets | Discarded packets |
| A | 0 | 11 | 0 |
| B | 0 | 11 | 0 |
| C | 0 | 11 | 0 |
| D | 0 | 11 | 0 |
| Quadrant | Total seconds | Saturated seconds | Saturation percentage |
|---|---|---|---|
| A | 6149 | 245 | 3.984388% |
| B | 6149 | 245 | 3.984388% |
| C | 6149 | 30 | 0.487884% |
| D | 6150 | 332 | 5.398374% |
Noise dominated data is calculated using 1-second bins in cleaned event files. If a bin has >2000 counts, and if more than 50% of those come from <1% of pixels, then it is considered to be noise-dominated and hence unusable.
| Quadrant | # 1 sec bins | Bins with >0 counts | Bins with >2000 counts | High rate bins dominated by noise | Noise dominated (total time) | Noise dominated (detector-on time) | Marked lightcurve |
|---|---|---|---|---|---|---|---|
| A | 7279 | 6150 | 195 | 195 | 2.68% | 3.17% | 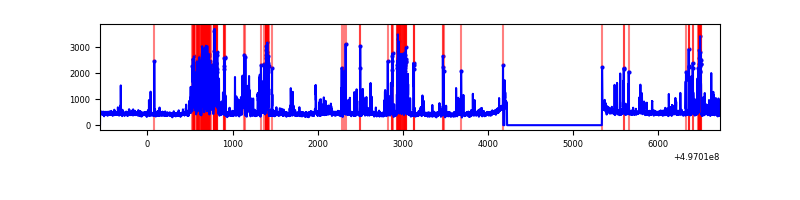 |
| B | 7279 | 6150 | 181 | 181 | 2.49% | 2.94% | 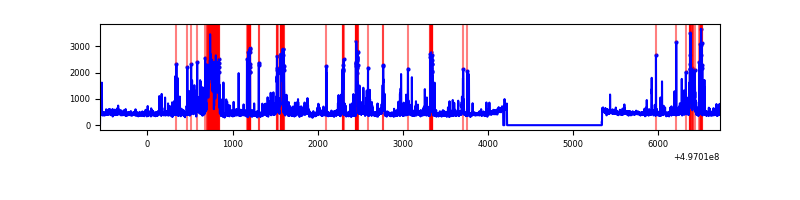 |
| C | 7279 | 6150 | 2 | 2 | 0.03% | 0.03% | 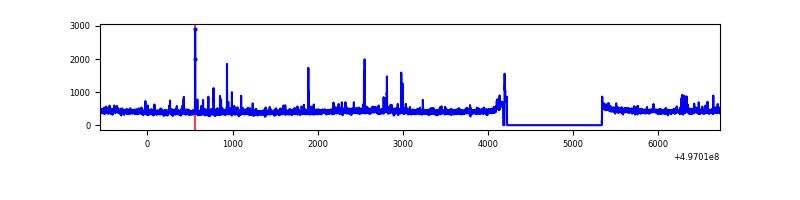 |
| D | 7280 | 6151 | 357 | 357 | 4.90% | 5.80% | 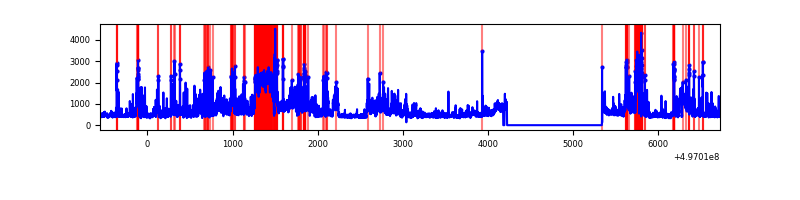 |
Top three noisy pixels from each quadrant. If the there are fewer than three noisy pixels in the level2.evt file, extra rows are filled as -1
| Pixel properties | Quadrant properties | ||||||
|---|---|---|---|---|---|---|---|
| Quadrant | DetID | PixID | Counts | Sigma | Mean | Median | Sigma |
| A | 15 | 174 | 409612 | 2583.93 | 645 | 631 | 158.3 |
| A | 0 | 8 | 371566 | 2343.56 | 645 | 631 | 158.3 |
| A | 7 | 29 | 161409 | 1015.79 | 645 | 631 | 158.3 |
| B | 5 | 185 | 329851 | 2402.34 | 635 | 614 | 137.0 |
| B | 4 | 171 | 222463 | 1618.76 | 635 | 614 | 137.0 |
| B | 10 | 245 | 206807 | 1504.52 | 635 | 614 | 137.0 |
| C | 1 | 16 | 30381 | 169.75 | 631 | 624 | 175.3 |
| C | 3 | 242 | 20780 | 114.98 | 631 | 624 | 175.3 |
| C | 1 | 241 | 16829 | 92.44 | 631 | 624 | 175.3 |
| D | 7 | 70 | 844253 | 4762.56 | 621 | 593 | 177.1 |
| D | 10 | 181 | 662377 | 3735.85 | 621 | 593 | 177.1 |
| D | 8 | 176 | 518058 | 2921.15 | 621 | 593 | 177.1 |
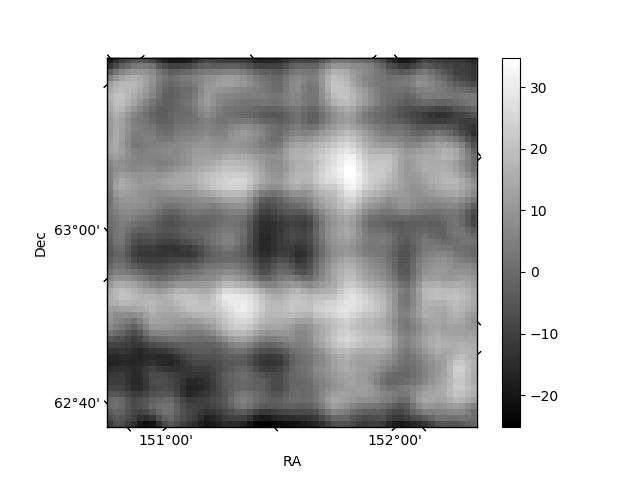
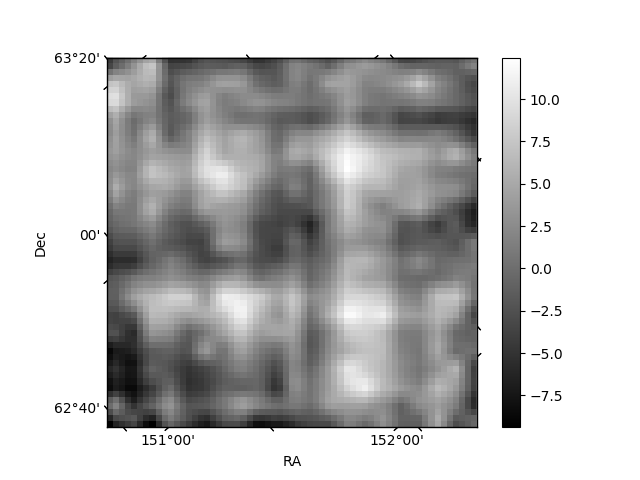
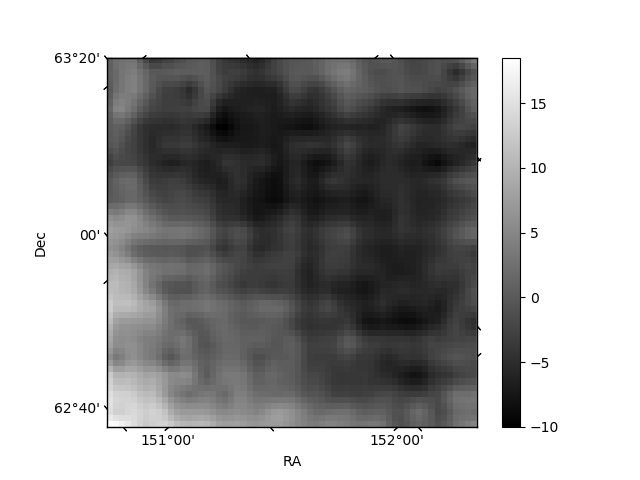
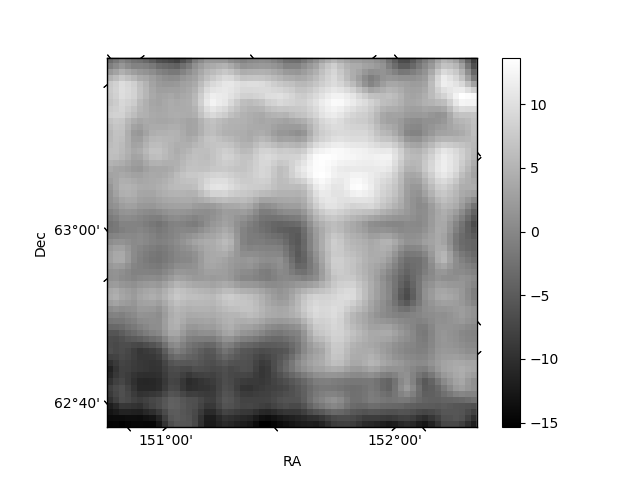
Histogram calculated using DETX and DETY for each event in the final _common_clean file
| Quadrant A | 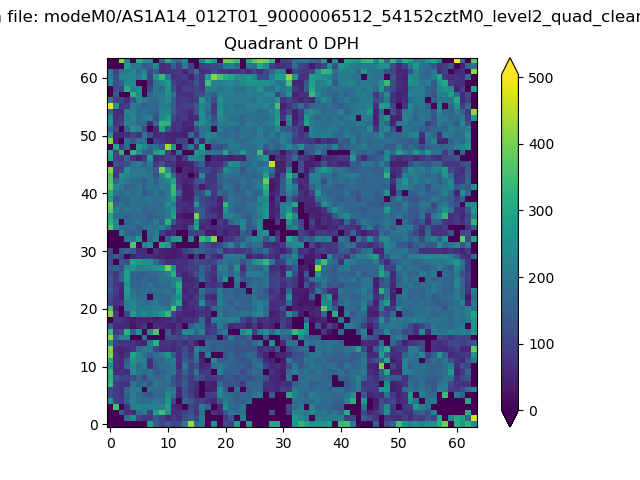 |
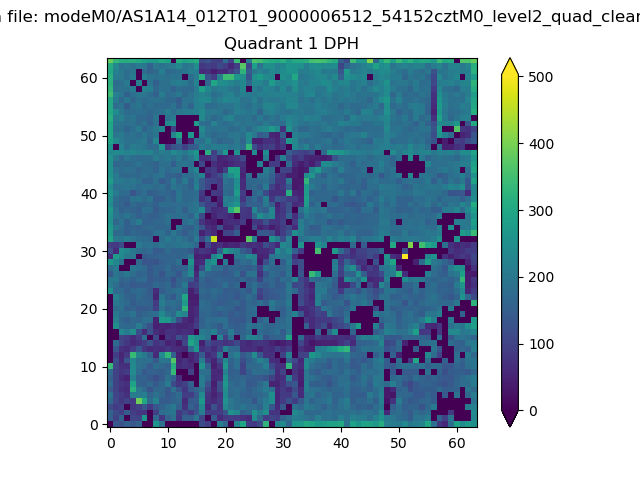 |
Quadrant B |
|---|---|---|---|
| Quadrant D | 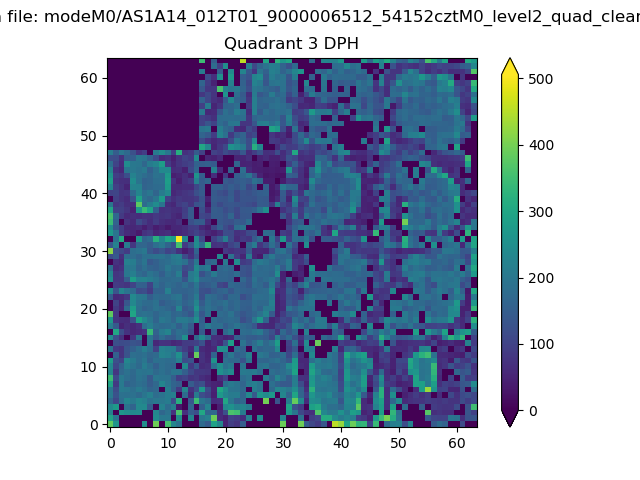 |
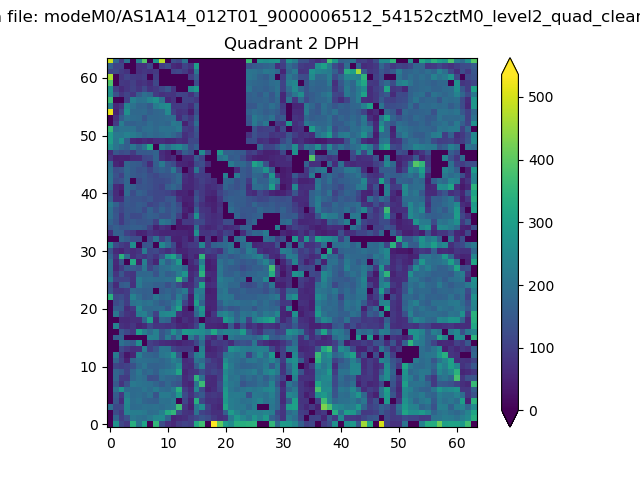 |
Quadrant C |
| Plot type | Count rate plots | Images |
|---|---|---|
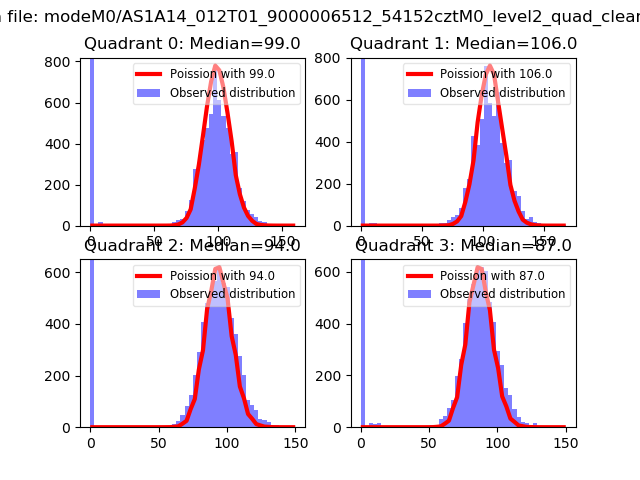
| Comparison with Poisson distribution Blue bars denote a histogram of data divided into 1 sec bins. Red curve is a Poisson curve with rate = median count rate of data. |
 |
 |
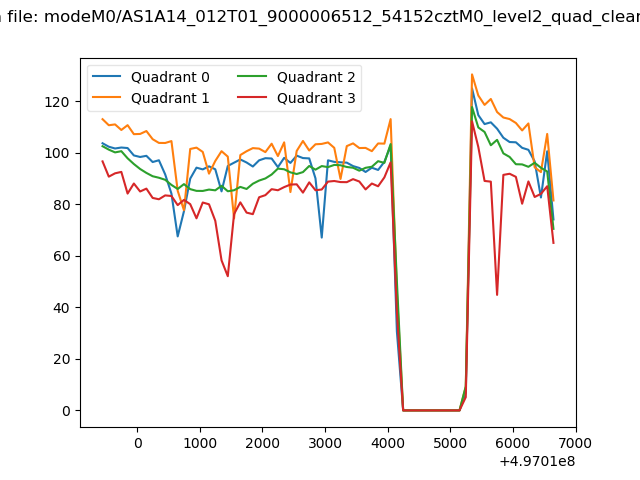
| Quadrant-wise count rates Data is divided into 100 sec bins |
 |
|
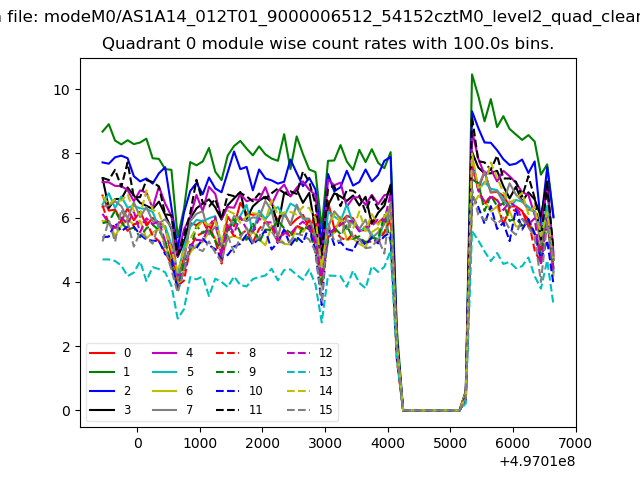
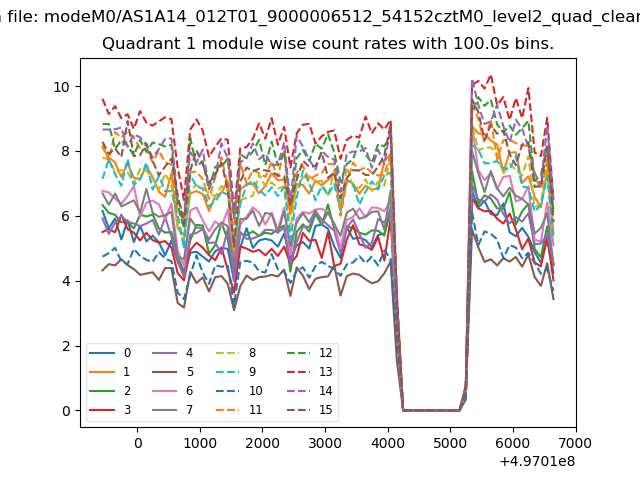
| Module-wise count rates for Quadrant A Data is divided into 100 sec bins |
 |
 |
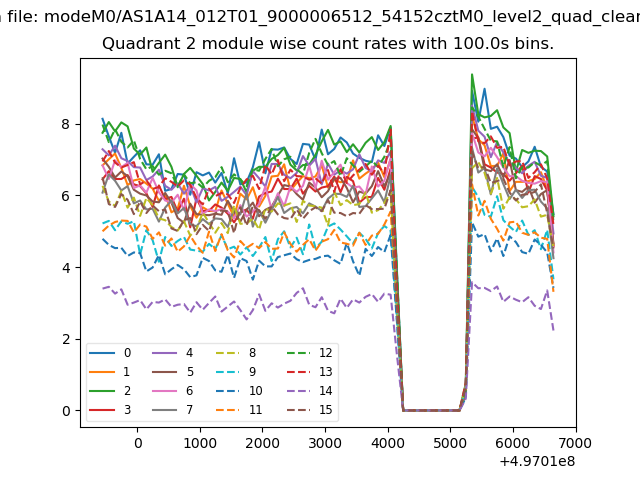
| Module-wise count rates for Quadrant B Data is divided into 100 sec bins |
 |
 |
| Module-wise count rates for Quadrant C Data is divided into 100 sec bins |
 |
 |
| Module-wise count rates for Quadrant D Data is divided into 100 sec bins |
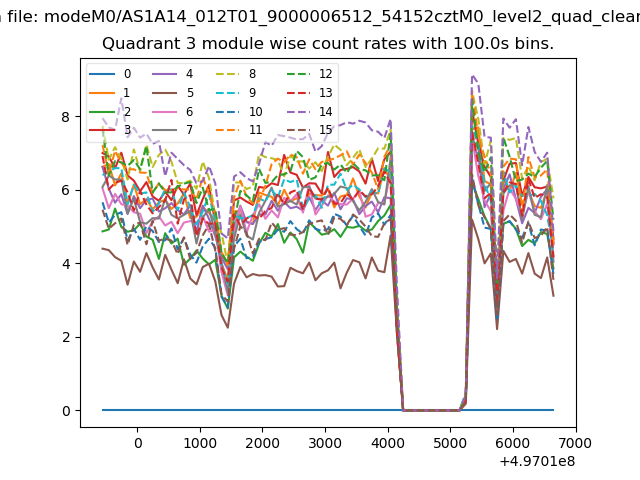 |
 |
| Parameter | Plot |
|---|---|
| CZT HV Monitor | 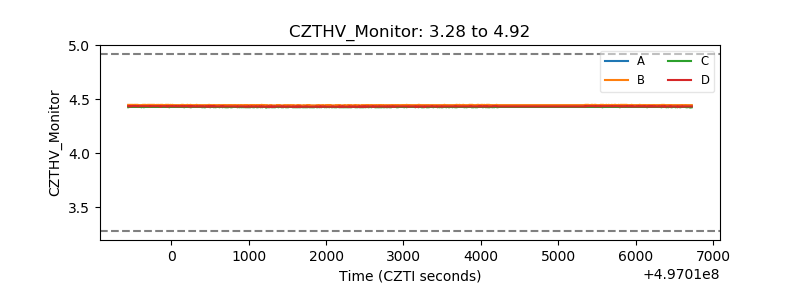 |
| D_VDD | 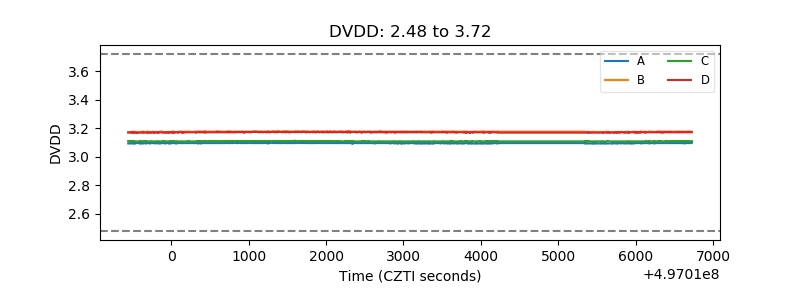 |
| Temperature 1 | 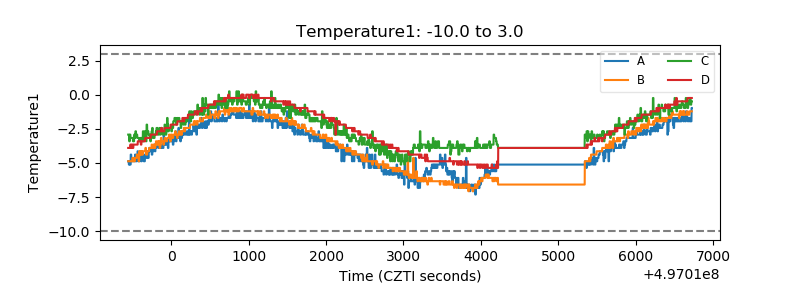 |
| Veto HV Monitor | 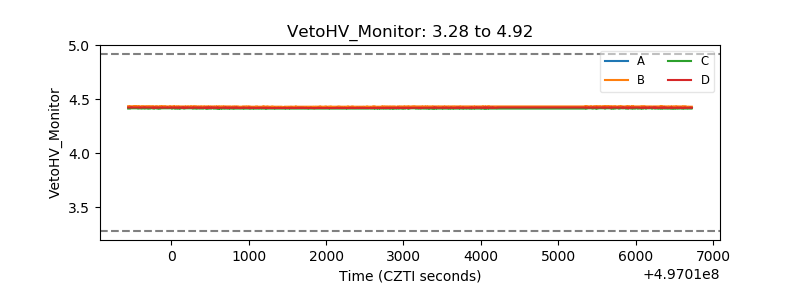 |
| Veto LLD | 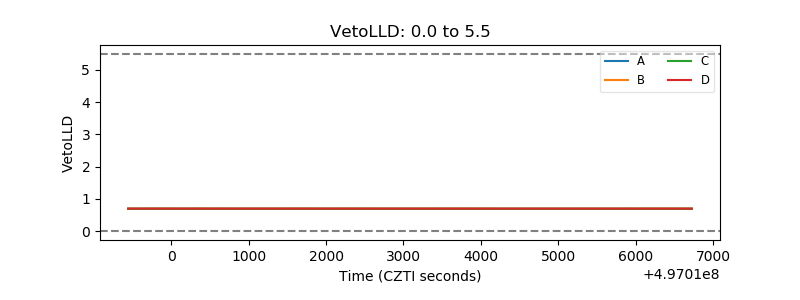 |
| Alpha Counter | 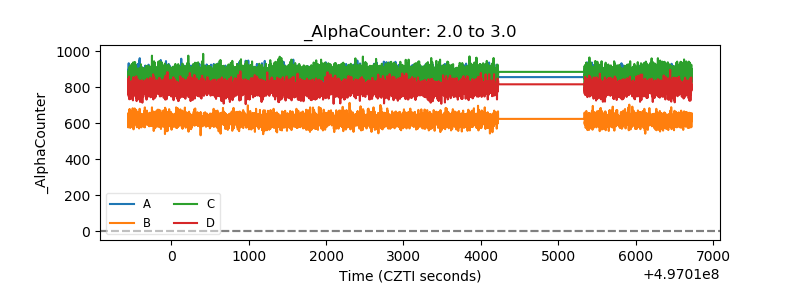 |
| _CPM_Rate | 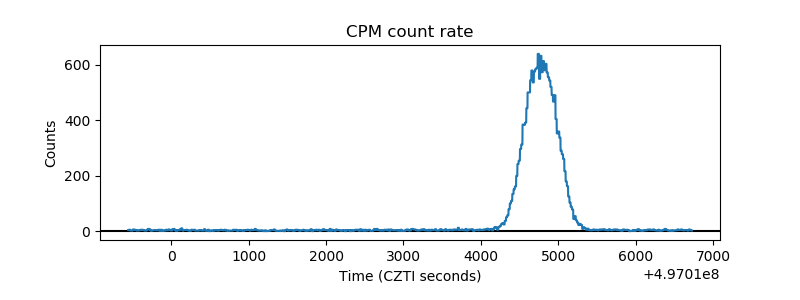 |
| CZT Counter | 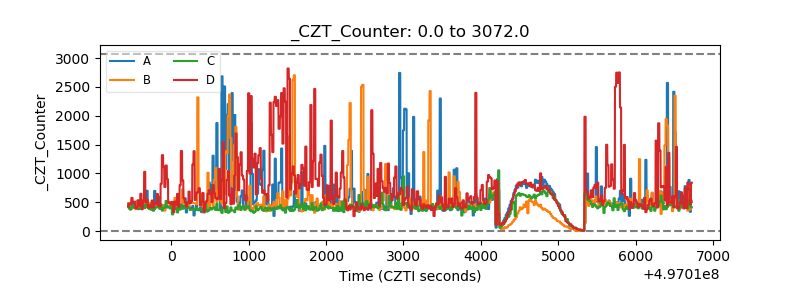 |
| +2.5 Volts monitor |  |
| +5 Volts monitor |  |
| _ROLL_ROT | 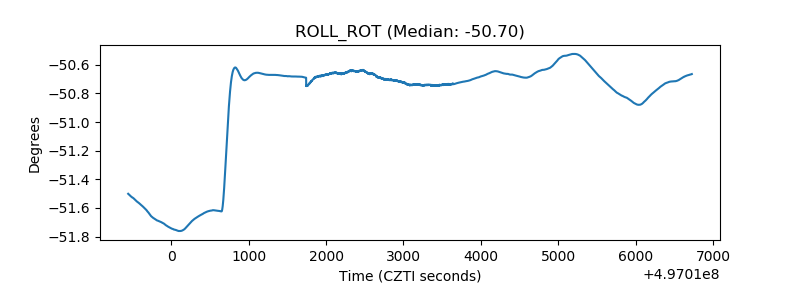 |
| _Roll_DEC | 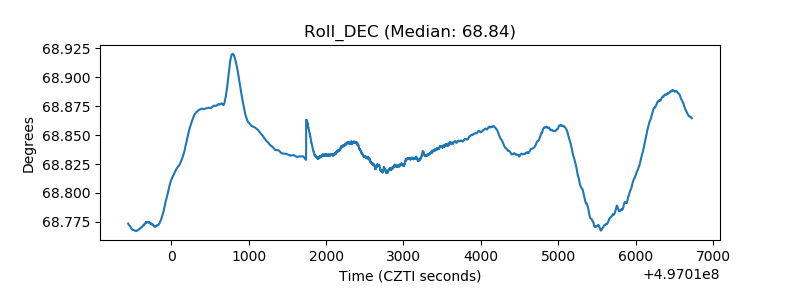 |
| _Roll_RA | 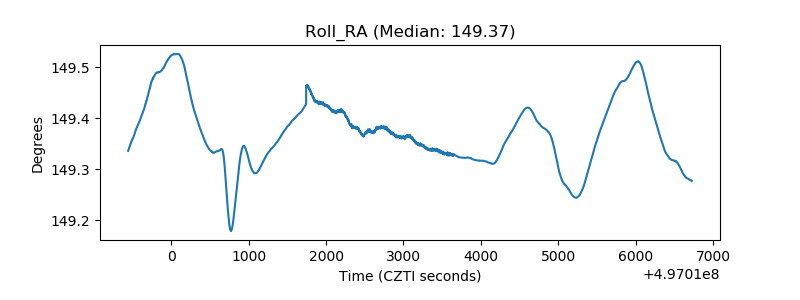 |
| Veto Counter | 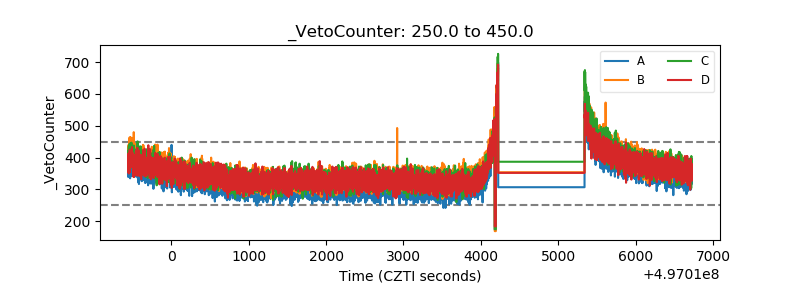 |