| Param | Original file | Final file |
|---|---|---|
| Filename | modeM0/AS1A14_012T01_9000006512_54154cztM0_level2.fits | modeM0/AS1A14_012T01_9000006512_54154cztM0_level2_quad_clean.evt |
| Size (bytes) | 473,451,840 | 87,131,520 |
| Size | 451.5 MB | 83.1 MB |
| Events in quadrant A | 5,350,797 | 510,782 |
| Events in quadrant B | 3,427,001 | 646,928 |
| Events in quadrant C | 2,858,580 | 581,476 |
| Events in quadrant D | 5,400,118 | 460,515 |
| Mode SS | |||
|---|---|---|---|
| Quadrant | BADHDUFLAG | Total packets | Discarded packets |
| A | 0 | 128 | 0 |
| B | 0 | 128 | 0 |
| C | 0 | 128 | 0 |
| D | 0 | 128 | 0 |
| Mode M0 | |||
|---|---|---|---|
| Quadrant | BADHDUFLAG | Total packets | Discarded packets |
| A | 0 | 20371 | 1 |
| B | 0 | 14735 | 1 |
| C | 0 | 13130 | 2 |
| D | 0 | 20501 | 1 |
| Mode M9 | |||
|---|---|---|---|
| Quadrant | BADHDUFLAG | Total packets | Discarded packets |
| A | 0 | 10 | 0 |
| B | 0 | 10 | 0 |
| C | 0 | 10 | 0 |
| D | 0 | 10 | 0 |
| Quadrant | Total seconds | Saturated seconds | Saturation percentage |
|---|---|---|---|
| A | 6282 | 1118 | 17.796880% |
| B | 6283 | 201 | 3.199109% |
| C | 6282 | 52 | 0.827762% |
| D | 6282 | 1047 | 16.666667% |
Noise dominated data is calculated using 1-second bins in cleaned event files. If a bin has >2000 counts, and if more than 50% of those come from <1% of pixels, then it is considered to be noise-dominated and hence unusable.
| Quadrant | # 1 sec bins | Bins with >0 counts | Bins with >2000 counts | High rate bins dominated by noise | Noise dominated (total time) | Noise dominated (detector-on time) | Marked lightcurve |
|---|---|---|---|---|---|---|---|
| A | 7332 | 6282 | 741 | 741 | 10.11% | 11.80% | 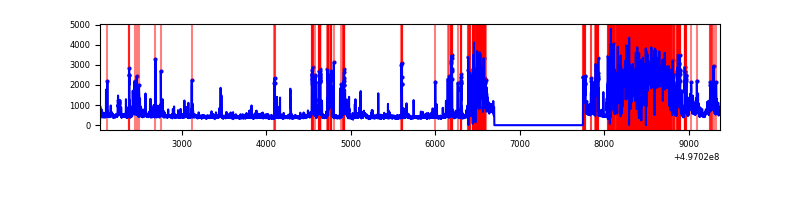 |
| B | 7333 | 6284 | 77 | 77 | 1.05% | 1.23% | 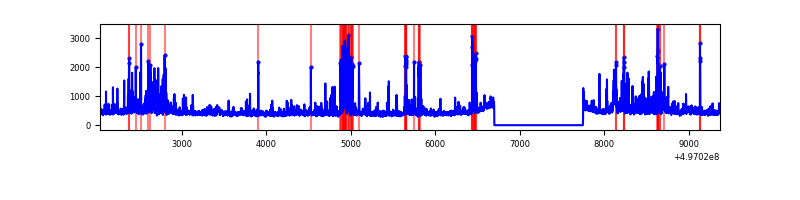 |
| C | 7332 | 6283 | 4 | 4 | 0.05% | 0.06% | 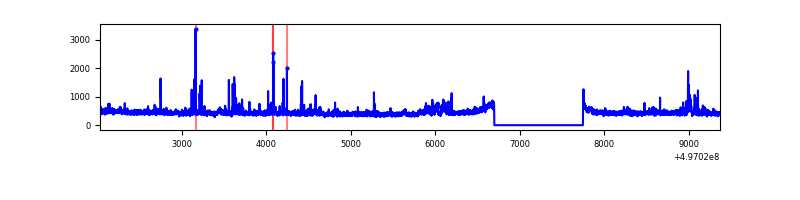 |
| D | 7332 | 6283 | 649 | 649 | 8.85% | 10.33% | 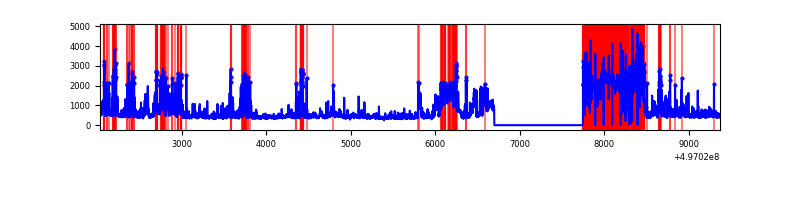 |
Top three noisy pixels from each quadrant. If the there are fewer than three noisy pixels in the level2.evt file, extra rows are filled as -1
| Pixel properties | Quadrant properties | ||||||
|---|---|---|---|---|---|---|---|
| Quadrant | DetID | PixID | Counts | Sigma | Mean | Median | Sigma |
| A | 7 | 29 | 2161677 | 14639.07 | 593 | 579 | 147.6 |
| A | 4 | 249 | 342630 | 2317.02 | 593 | 579 | 147.6 |
| A | 15 | 174 | 324271 | 2192.66 | 593 | 579 | 147.6 |
| B | 4 | 171 | 193829 | 1397.71 | 654 | 631 | 138.2 |
| B | 6 | 255 | 148679 | 1071.07 | 654 | 631 | 138.2 |
| B | 10 | 245 | 125364 | 902.39 | 654 | 631 | 138.2 |
| C | 3 | 242 | 85295 | 473.74 | 652 | 644 | 178.7 |
| C | 1 | 241 | 58441 | 323.46 | 652 | 644 | 178.7 |
| C | 12 | 252 | 51601 | 285.18 | 652 | 644 | 178.7 |
| D | 8 | 176 | 2088441 | 12804.85 | 572 | 545 | 163.1 |
| D | 10 | 181 | 547682 | 3355.53 | 572 | 545 | 163.1 |
| D | 3 | 12 | 179844 | 1099.62 | 572 | 545 | 163.1 |
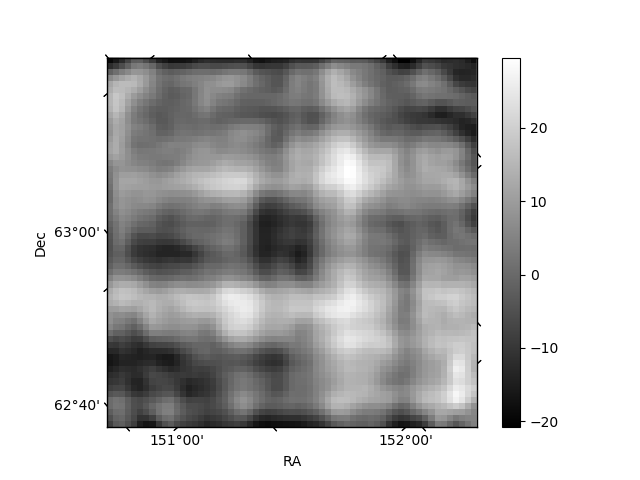
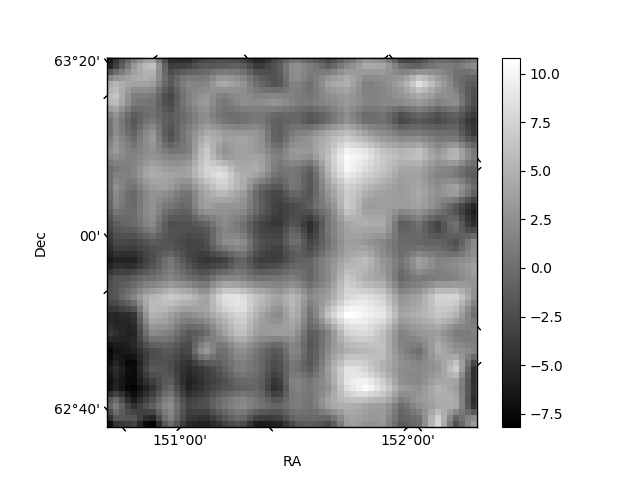
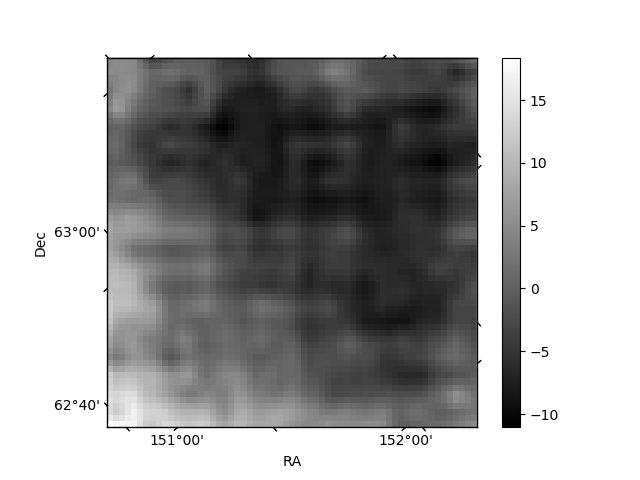
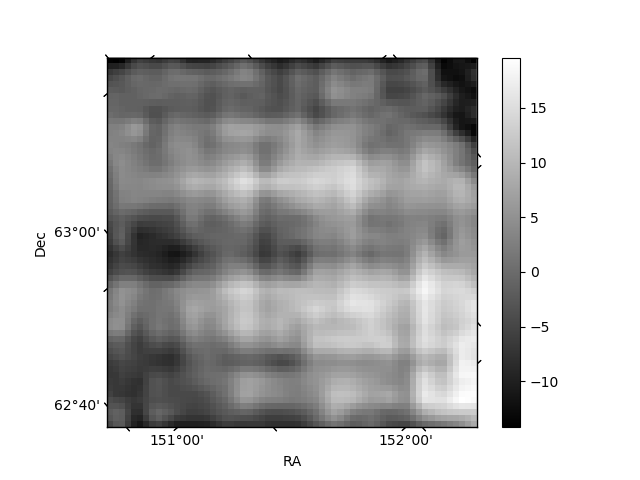
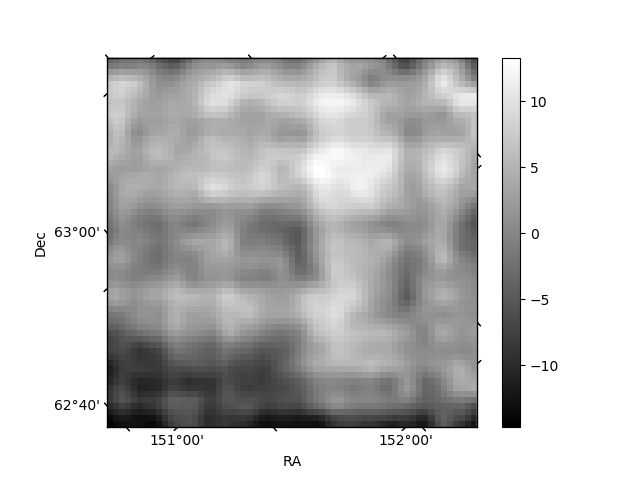
Histogram calculated using DETX and DETY for each event in the final _common_clean file
| Quadrant A | 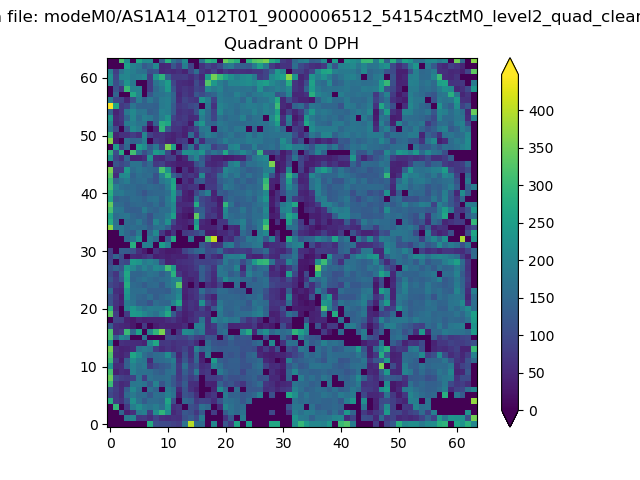 |
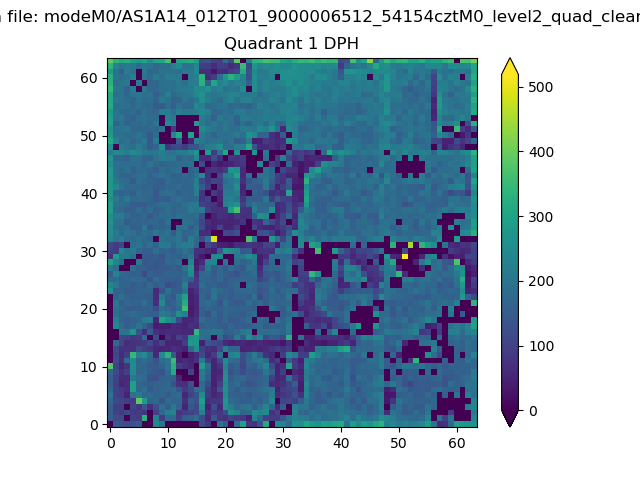 |
Quadrant B |
|---|---|---|---|
| Quadrant D | 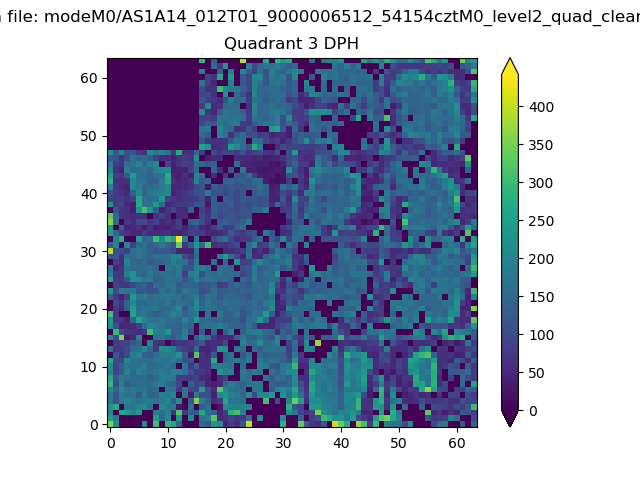 |
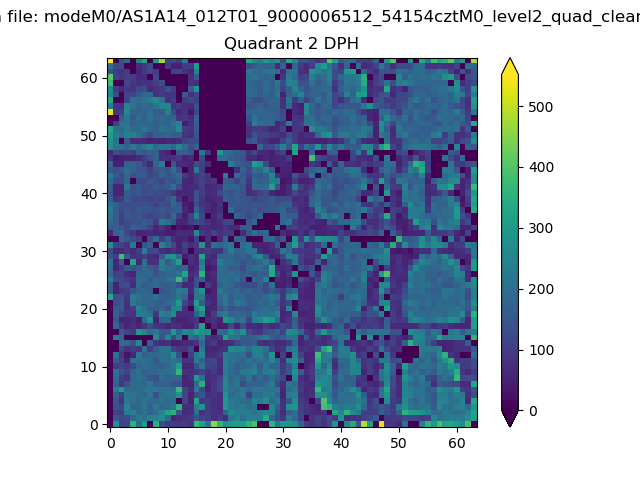 |
Quadrant C |
| Plot type | Count rate plots | Images |
|---|---|---|
| Comparison with Poisson distribution Blue bars denote a histogram of data divided into 1 sec bins. Red curve is a Poisson curve with rate = median count rate of data. |
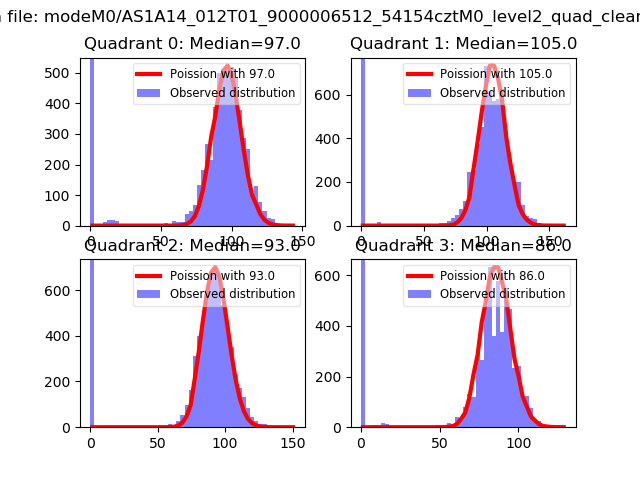 |
 |
| Quadrant-wise count rates Data is divided into 100 sec bins |
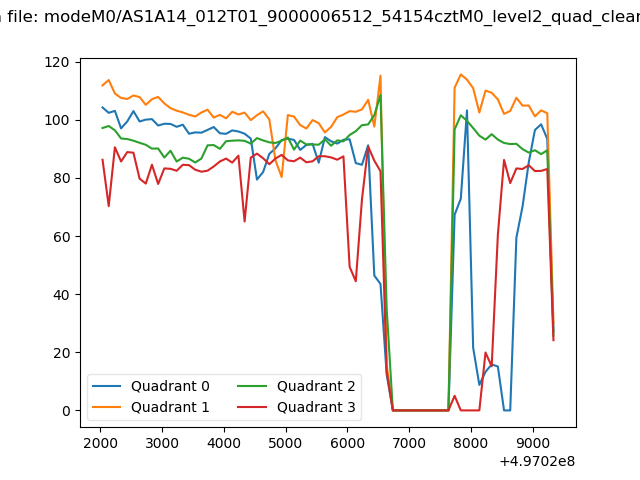 |
|
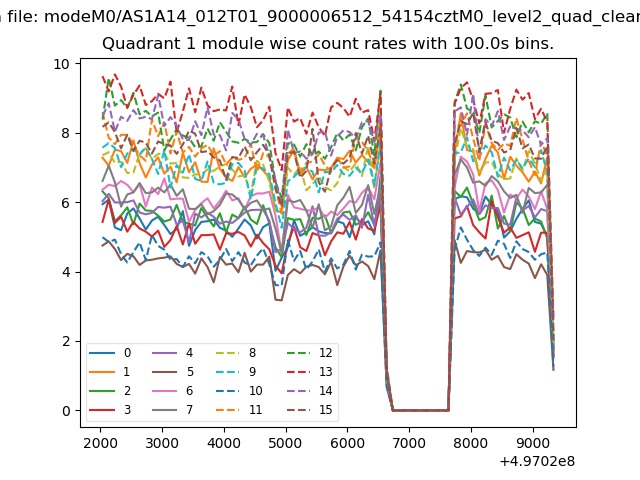
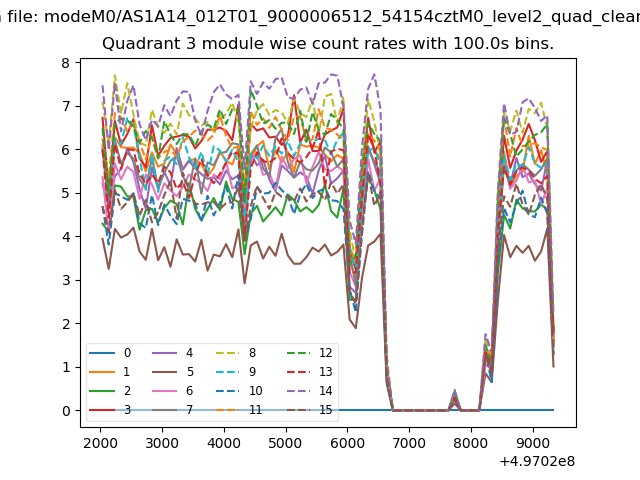
| Module-wise count rates for Quadrant A Data is divided into 100 sec bins |
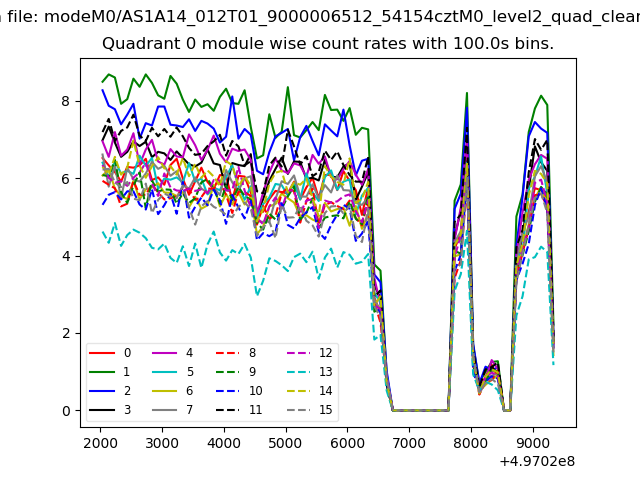 |
 |
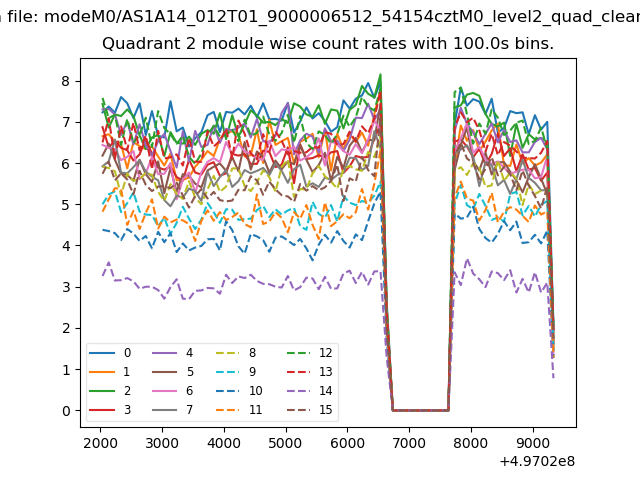
| Module-wise count rates for Quadrant B Data is divided into 100 sec bins |
 |
 |
| Module-wise count rates for Quadrant C Data is divided into 100 sec bins |
 |
 |
| Module-wise count rates for Quadrant D Data is divided into 100 sec bins |
 |
 |
| Parameter | Plot |
|---|---|
| CZT HV Monitor | 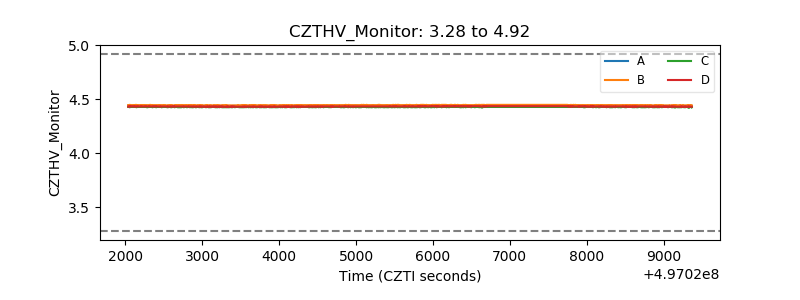 |
| D_VDD | 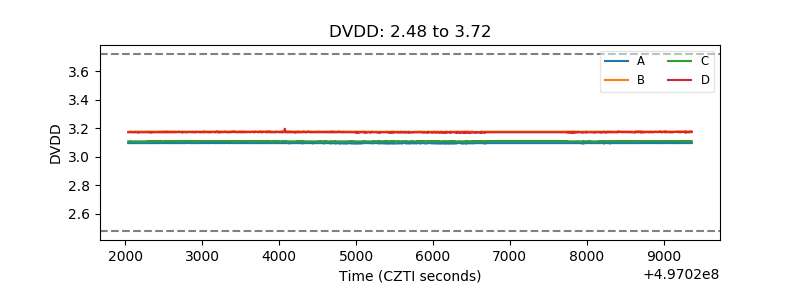 |
| Temperature 1 | 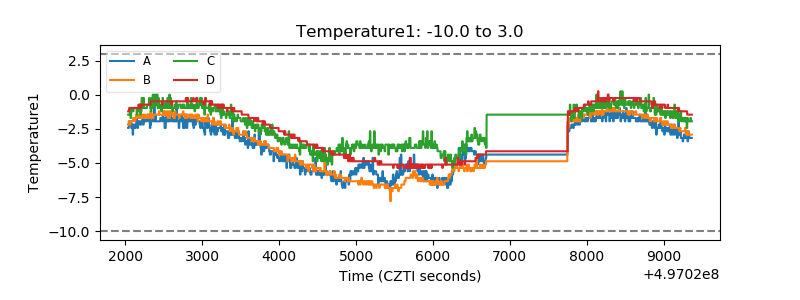 |
| Veto HV Monitor | 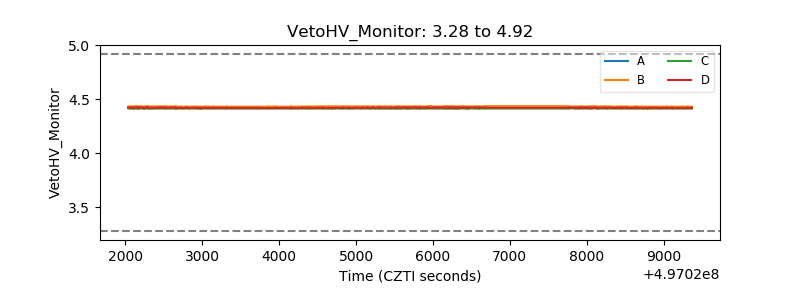 |
| Veto LLD | 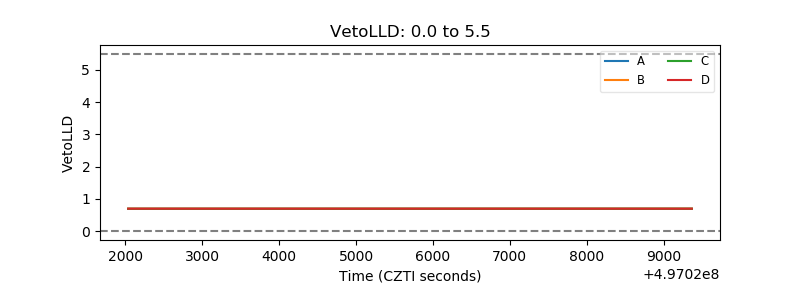 |
| Alpha Counter | 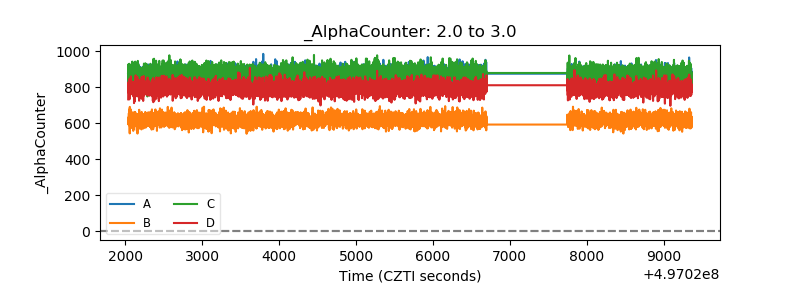 |
| _CPM_Rate | 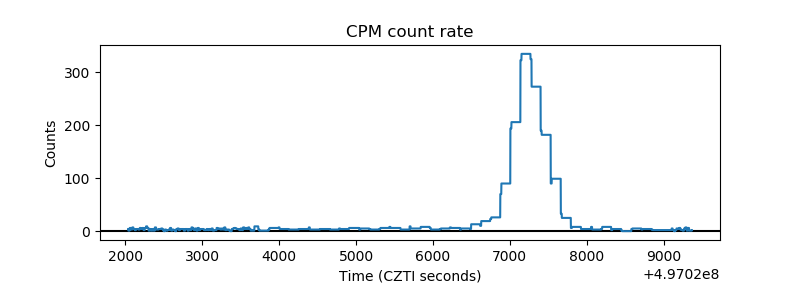 |
| CZT Counter | 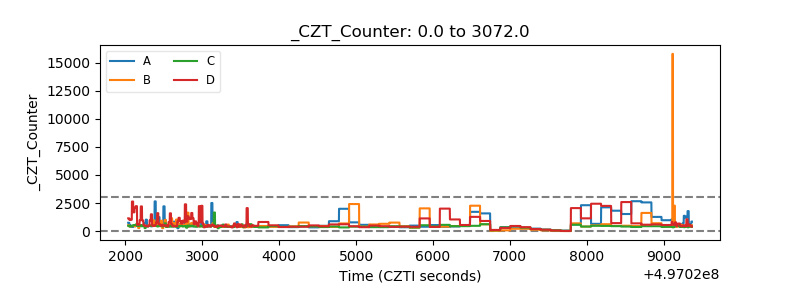 |
| +2.5 Volts monitor | 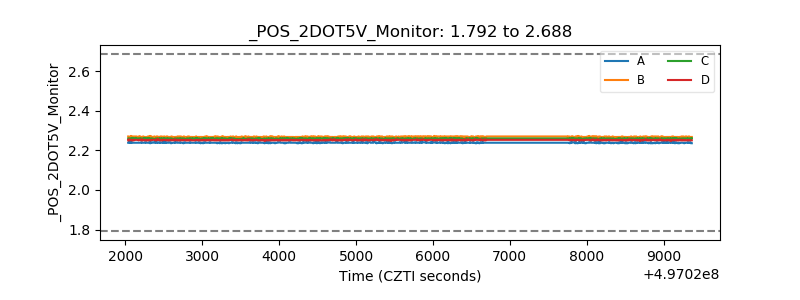 |
| +5 Volts monitor |  |
| _ROLL_ROT | 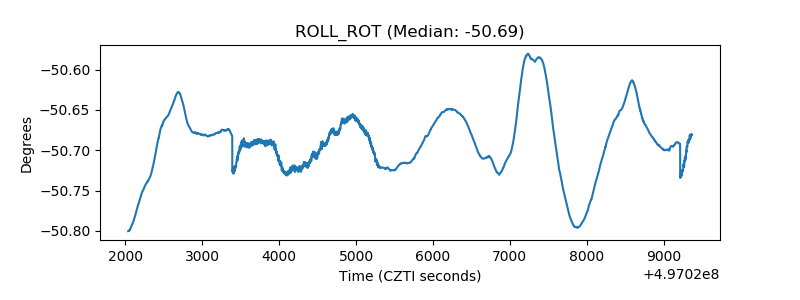 |
| _Roll_DEC | 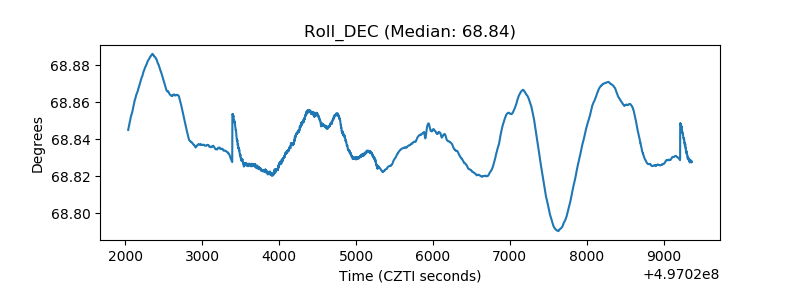 |
| _Roll_RA | 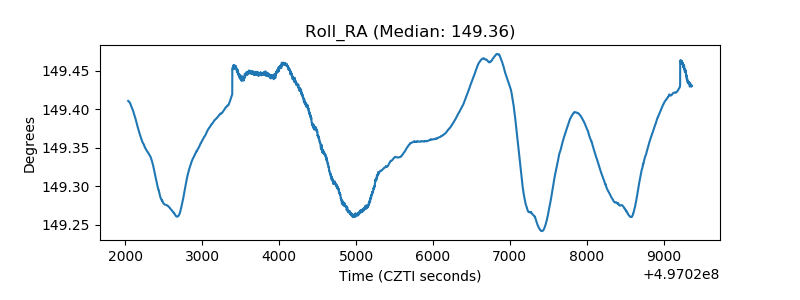 |
| Veto Counter | 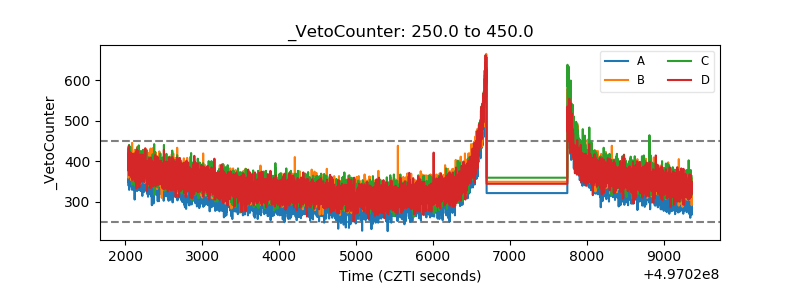 |