| Param | Original file | Final file |
|---|---|---|
| Filename | modeM0/AS1A14_012T01_9000006512_54155cztM0_level2.fits | modeM0/AS1A14_012T01_9000006512_54155cztM0_level2_quad_clean.evt |
| Size (bytes) | 572,598,720 | 84,591,360 |
| Size | 546.1 MB | 80.7 MB |
| Events in quadrant A | 7,444,698 | 437,061 |
| Events in quadrant B | 3,486,844 | 643,971 |
| Events in quadrant C | 4,027,899 | 572,144 |
| Events in quadrant D | 5,734,794 | 458,613 |
| Mode SS | |||
|---|---|---|---|
| Quadrant | BADHDUFLAG | Total packets | Discarded packets |
| A | 0 | 130 | 0 |
| B | 0 | 130 | 0 |
| C | 0 | 130 | 0 |
| D | 0 | 130 | 0 |
| Mode M0 | |||
|---|---|---|---|
| Quadrant | BADHDUFLAG | Total packets | Discarded packets |
| A | 0 | 26684 | 1 |
| B | 0 | 15165 | 1 |
| C | 0 | 16926 | 1 |
| D | 0 | 21810 | 1 |
| Mode M9 | |||
|---|---|---|---|
| Quadrant | BADHDUFLAG | Total packets | Discarded packets |
| A | 0 | 9 | 0 |
| B | 0 | 9 | 0 |
| C | 0 | 9 | 0 |
| D | 0 | 9 | 0 |
| Quadrant | Total seconds | Saturated seconds | Saturation percentage |
|---|---|---|---|
| A | 6446 | 1974 | 30.623643% |
| B | 6447 | 253 | 3.924306% |
| C | 6447 | 303 | 4.699860% |
| D | 6447 | 1127 | 17.480999% |
Noise dominated data is calculated using 1-second bins in cleaned event files. If a bin has >2000 counts, and if more than 50% of those come from <1% of pixels, then it is considered to be noise-dominated and hence unusable.
| Quadrant | # 1 sec bins | Bins with >0 counts | Bins with >2000 counts | High rate bins dominated by noise | Noise dominated (total time) | Noise dominated (detector-on time) | Marked lightcurve |
|---|---|---|---|---|---|---|---|
| A | 7336 | 6446 | 1471 | 1471 | 20.05% | 22.82% | 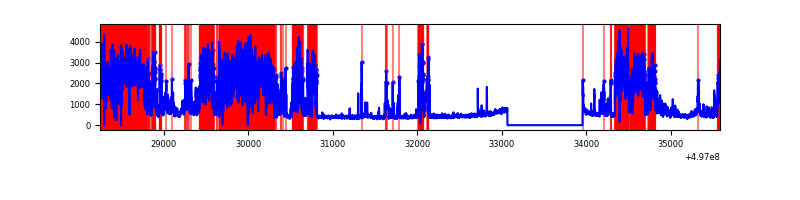 |
| B | 7337 | 6448 | 83 | 83 | 1.13% | 1.29% | 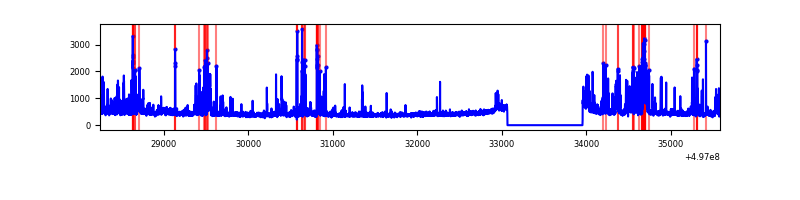 |
| C | 7337 | 6448 | 178 | 178 | 2.43% | 2.76% | 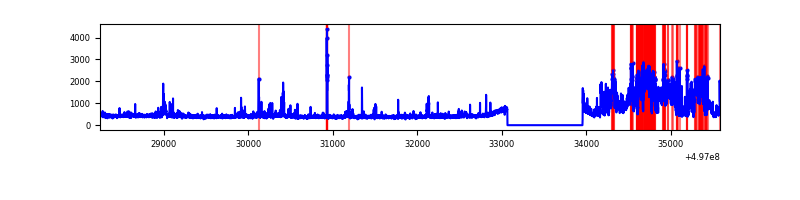 |
| D | 7337 | 6448 | 887 | 887 | 12.09% | 13.76% | 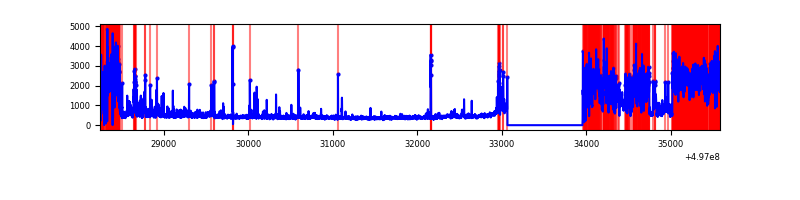 |
Top three noisy pixels from each quadrant. If the there are fewer than three noisy pixels in the level2.evt file, extra rows are filled as -1
| Pixel properties | Quadrant properties | ||||||
|---|---|---|---|---|---|---|---|
| Quadrant | DetID | PixID | Counts | Sigma | Mean | Median | Sigma |
| A | 7 | 29 | 4844156 | 35247.42 | 555 | 541 | 137.4 |
| A | 0 | 8 | 115413 | 835.93 | 555 | 541 | 137.4 |
| A | 15 | 174 | 110083 | 797.15 | 555 | 541 | 137.4 |
| B | 4 | 171 | 315941 | 2243.55 | 663 | 638 | 140.5 |
| B | 0 | 213 | 173995 | 1233.53 | 663 | 638 | 140.5 |
| B | 10 | 245 | 90967 | 642.74 | 663 | 638 | 140.5 |
| C | 9 | 38 | 1090396 | 6056.46 | 657 | 651 | 179.9 |
| C | 9 | 237 | 100061 | 552.49 | 657 | 651 | 179.9 |
| C | 14 | 254 | 82325 | 453.92 | 657 | 651 | 179.9 |
| D | 3 | 12 | 1249178 | 7438.33 | 602 | 576 | 167.9 |
| D | 8 | 176 | 1201330 | 7153.28 | 602 | 576 | 167.9 |
| D | 2 | 62 | 615854 | 3665.41 | 602 | 576 | 167.9 |
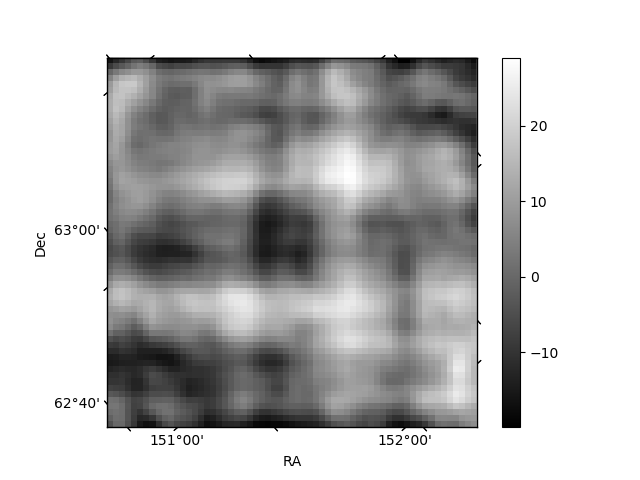
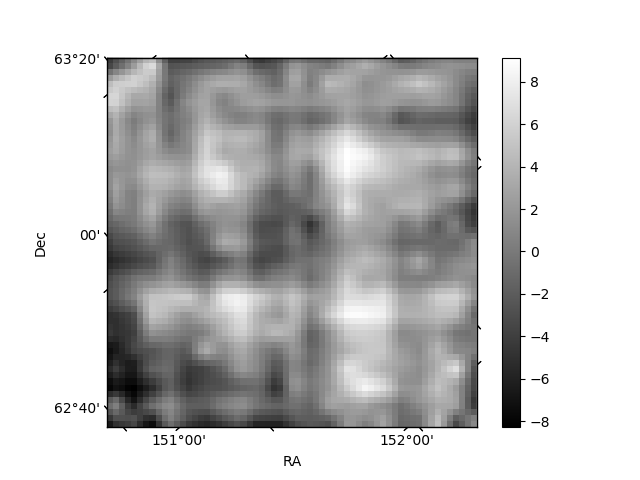
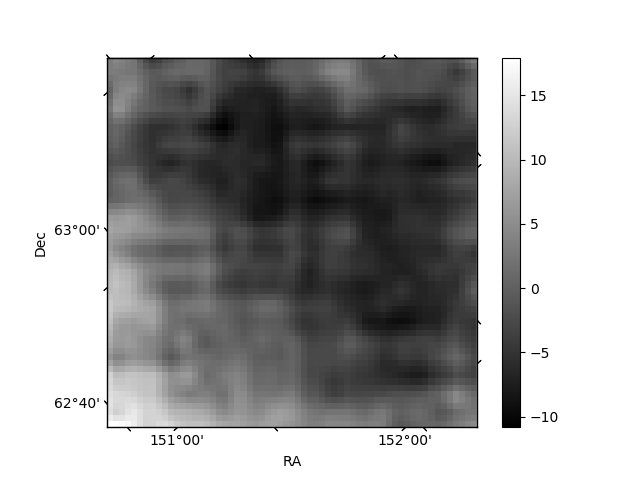
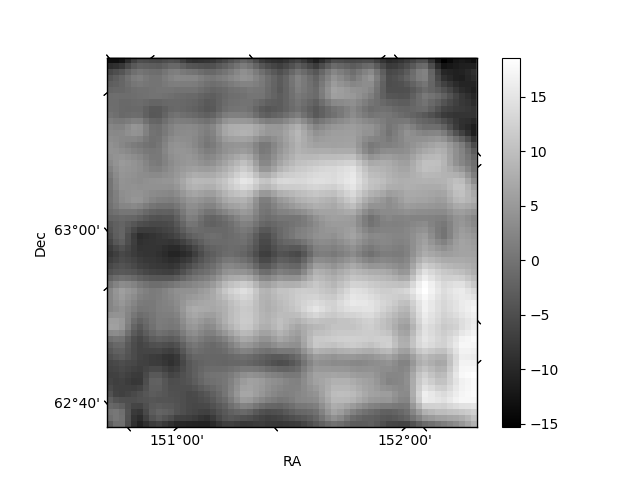
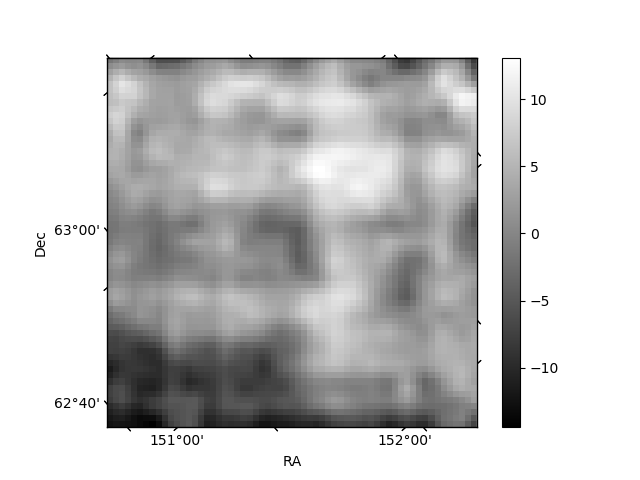
Histogram calculated using DETX and DETY for each event in the final _common_clean file
| Quadrant A | 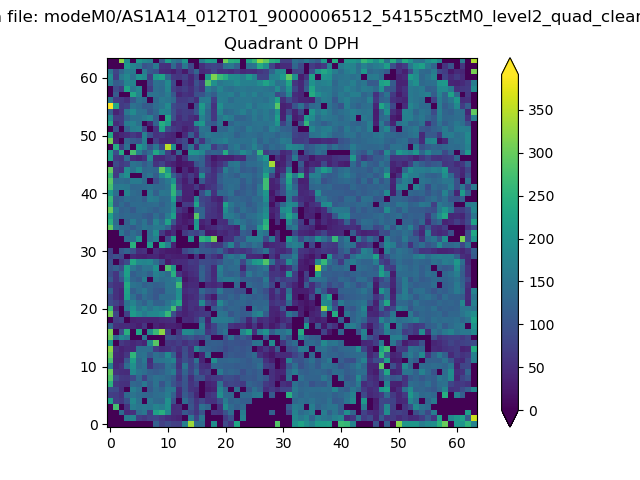 |
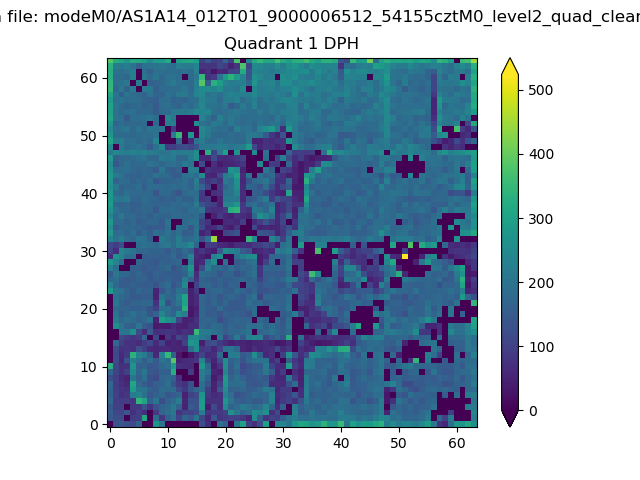 |
Quadrant B |
|---|---|---|---|
| Quadrant D | 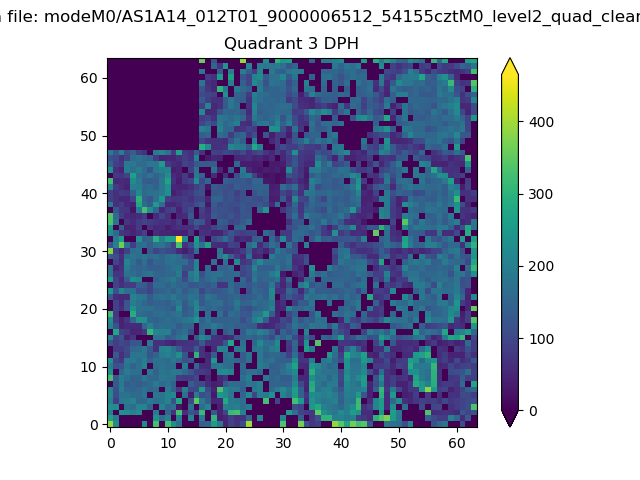 |
 |
Quadrant C |
| Plot type | Count rate plots | Images |
|---|---|---|
| Comparison with Poisson distribution Blue bars denote a histogram of data divided into 1 sec bins. Red curve is a Poisson curve with rate = median count rate of data. |
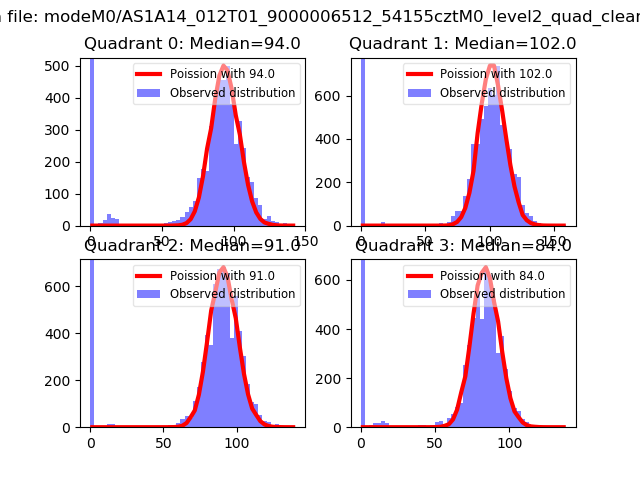 |
 |
| Quadrant-wise count rates Data is divided into 100 sec bins |
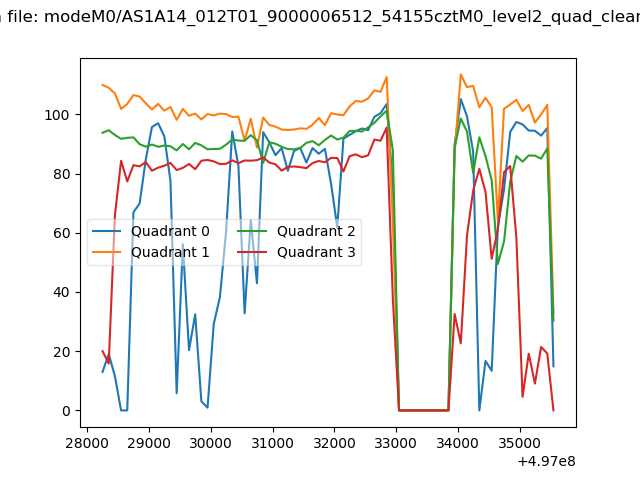 |
|
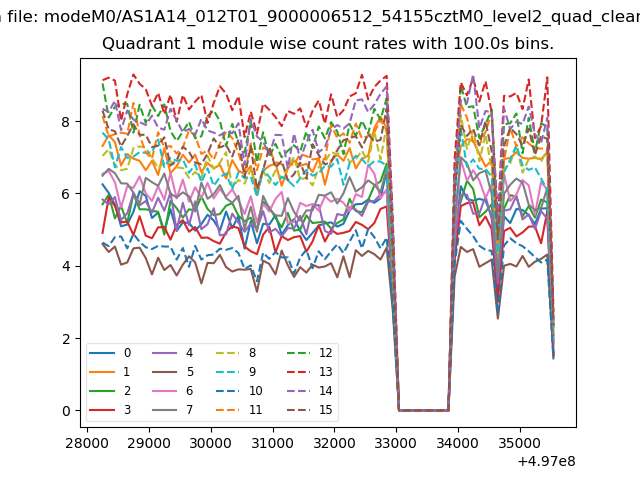
| Module-wise count rates for Quadrant A Data is divided into 100 sec bins |
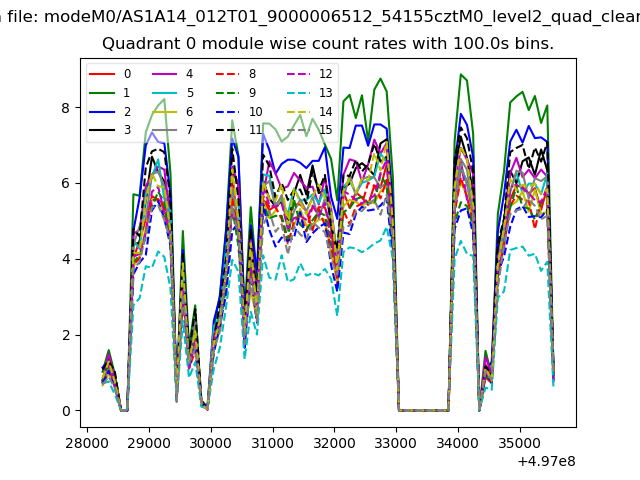 |
 |
| Module-wise count rates for Quadrant B Data is divided into 100 sec bins |
 |
 |
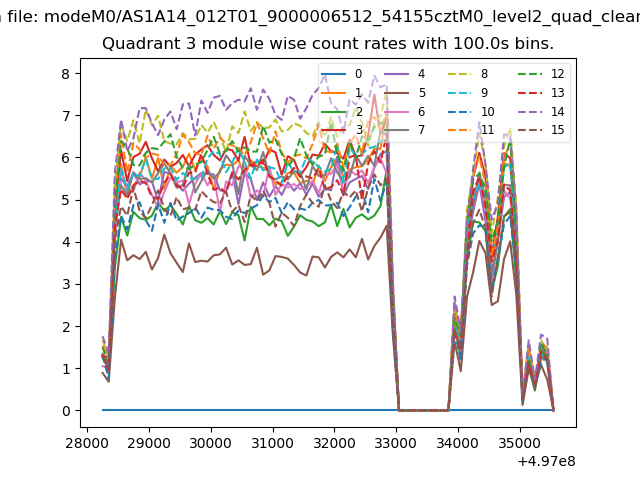
| Module-wise count rates for Quadrant C Data is divided into 100 sec bins |
 |
 |
| Module-wise count rates for Quadrant D Data is divided into 100 sec bins |
 |
 |
| Parameter | Plot |
|---|---|
| CZT HV Monitor | 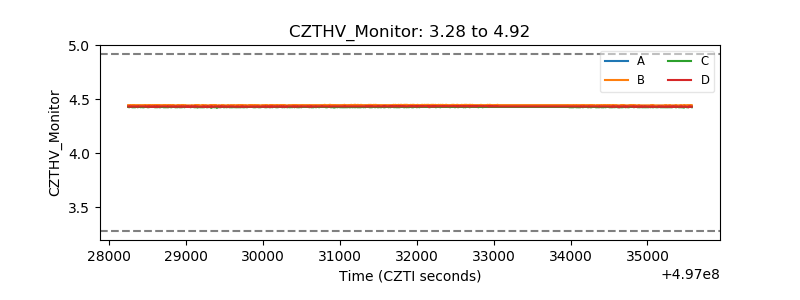 |
| D_VDD | 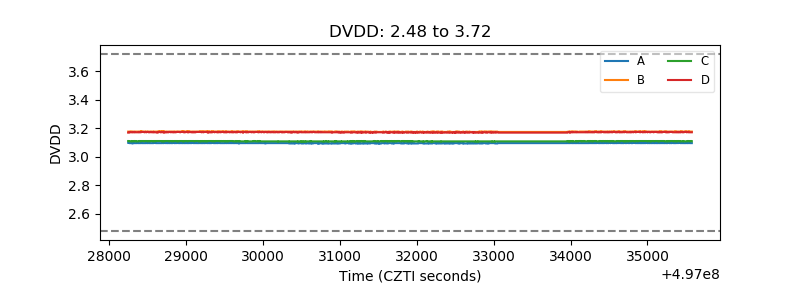 |
| Temperature 1 | 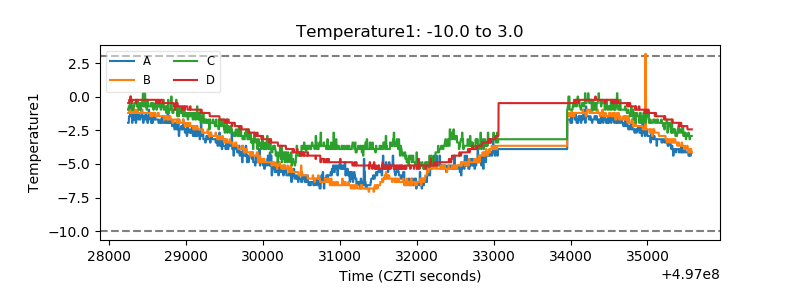 |
| Veto HV Monitor | 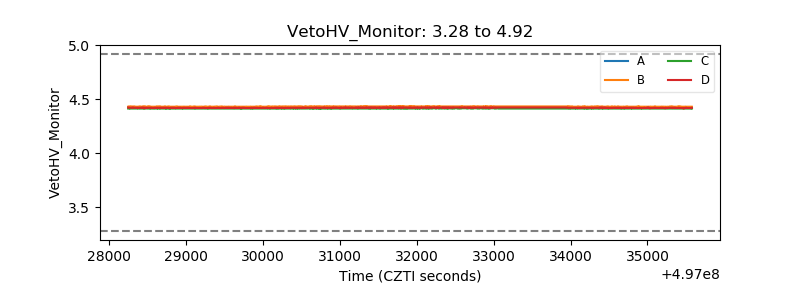 |
| Veto LLD | 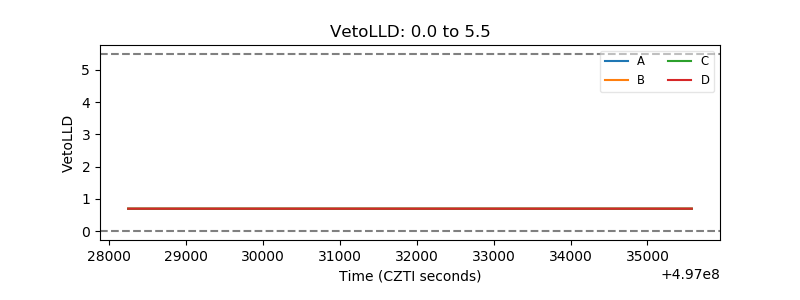 |
| Alpha Counter | 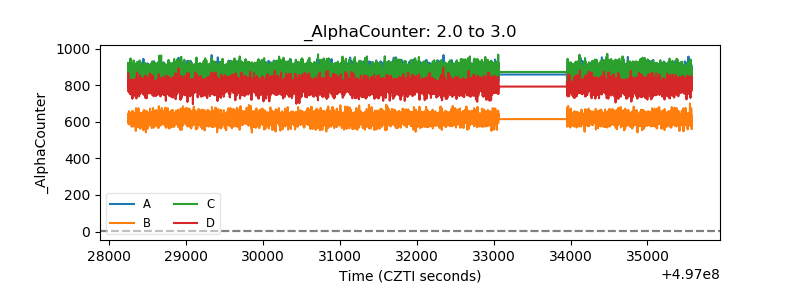 |
| _CPM_Rate | 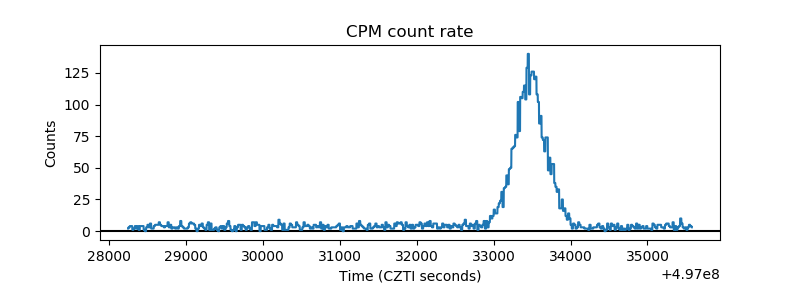 |
| CZT Counter | 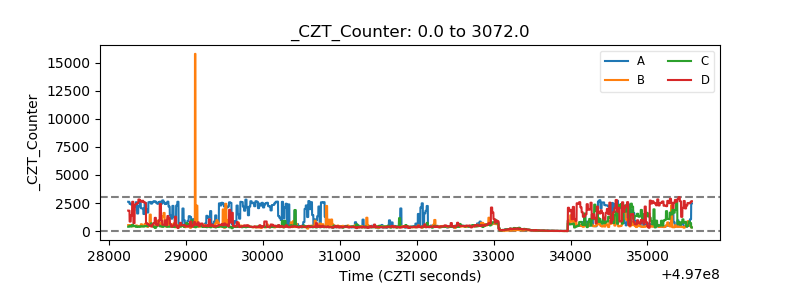 |
| +2.5 Volts monitor |  |
| +5 Volts monitor | 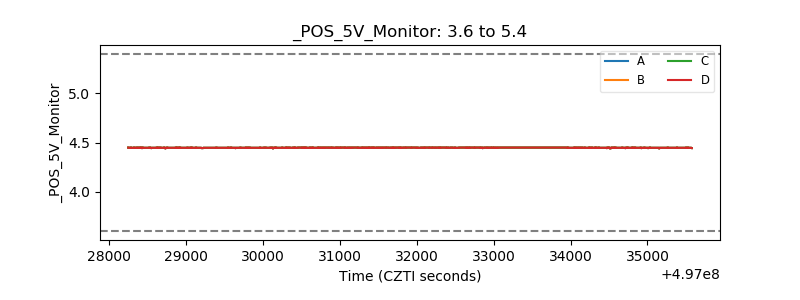 |
| _ROLL_ROT | 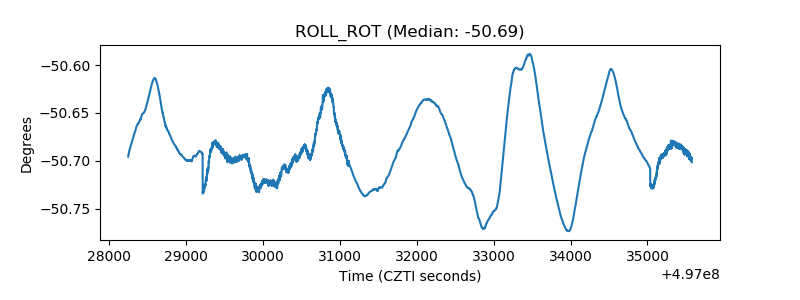 |
| _Roll_DEC | 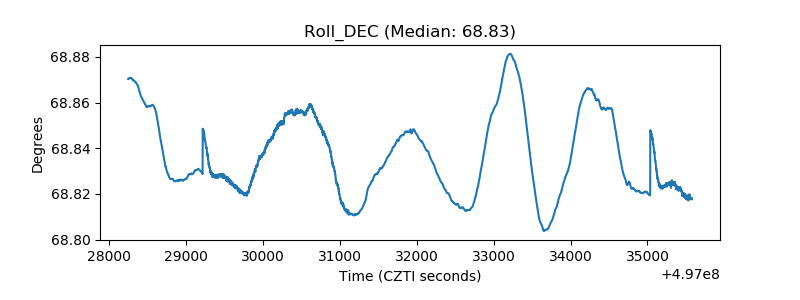 |
| _Roll_RA | 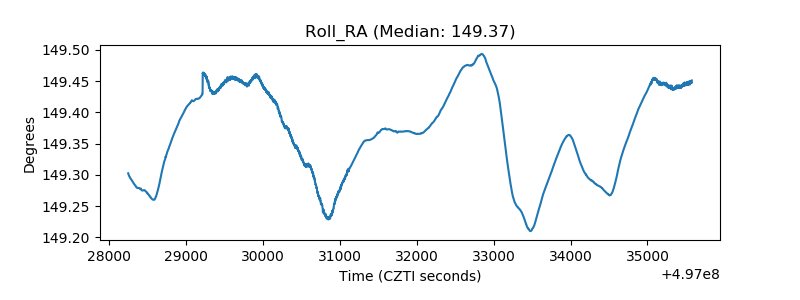 |
| Veto Counter | 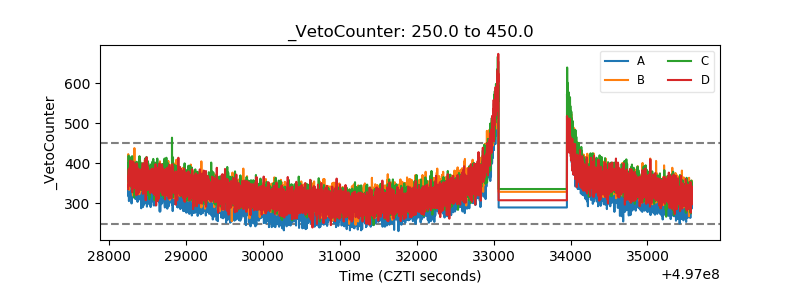 |