| Param | Original file | Final file |
|---|---|---|
| Filename | modeM0/AS1A14_012T01_9000006512_54156cztM0_level2.fits | modeM0/AS1A14_012T01_9000006512_54156cztM0_level2_quad_clean.evt |
| Size (bytes) | 604,964,160 | 92,658,240 |
| Size | 576.9 MB | 88.4 MB |
| Events in quadrant A | 6,862,970 | 533,406 |
| Events in quadrant B | 3,694,009 | 685,263 |
| Events in quadrant C | 4,393,865 | 611,656 |
| Events in quadrant D | 6,911,602 | 498,192 |
| Mode SS | |||
|---|---|---|---|
| Quadrant | BADHDUFLAG | Total packets | Discarded packets |
| A | 0 | 138 | 0 |
| B | 0 | 140 | 0 |
| C | 0 | 140 | 0 |
| D | 0 | 140 | 0 |
| Mode M0 | |||
|---|---|---|---|
| Quadrant | BADHDUFLAG | Total packets | Discarded packets |
| A | 0 | 25235 | 6 |
| B | 0 | 16081 | 2 |
| C | 0 | 18151 | 2 |
| D | 0 | 25494 | 2 |
| Mode M9 | |||
|---|---|---|---|
| Quadrant | BADHDUFLAG | Total packets | Discarded packets |
| A | 0 | 5 | 0 |
| B | 0 | 5 | 0 |
| C | 0 | 5 | 0 |
| D | 0 | 5 | 0 |
| Quadrant | Total seconds | Saturated seconds | Saturation percentage |
|---|---|---|---|
| A | 6842 | 1388 | 20.286466% |
| B | 6842 | 240 | 3.507746% |
| C | 6843 | 344 | 5.027035% |
| D | 6843 | 1220 | 17.828438% |
Noise dominated data is calculated using 1-second bins in cleaned event files. If a bin has >2000 counts, and if more than 50% of those come from <1% of pixels, then it is considered to be noise-dominated and hence unusable.
| Quadrant | # 1 sec bins | Bins with >0 counts | Bins with >2000 counts | High rate bins dominated by noise | Noise dominated (total time) | Noise dominated (detector-on time) | Marked lightcurve |
|---|---|---|---|---|---|---|---|
| A | 7346 | 6843 | 1069 | 1069 | 14.55% | 15.62% | 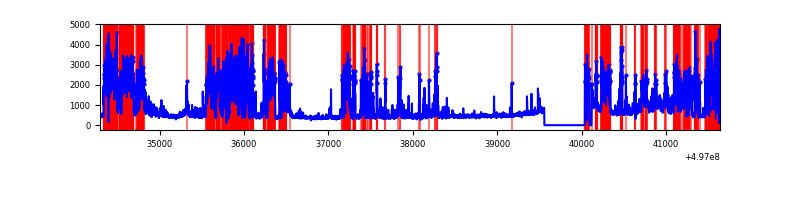 |
| B | 7347 | 6844 | 71 | 71 | 0.97% | 1.04% | 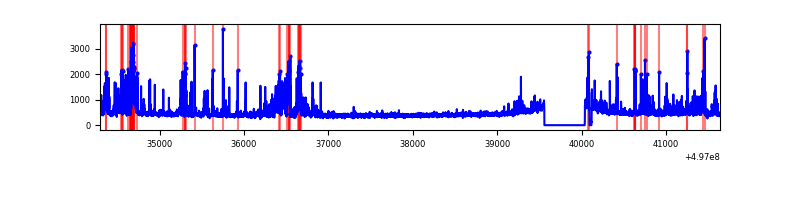 |
| C | 7347 | 6844 | 204 | 204 | 2.78% | 2.98% | 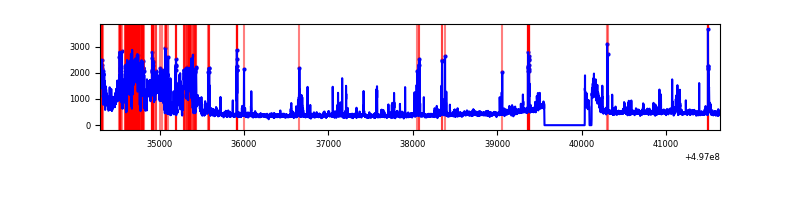 |
| D | 7347 | 6844 | 1079 | 1079 | 14.69% | 15.77% | 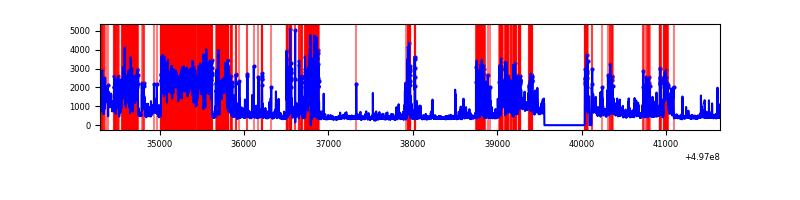 |
Top three noisy pixels from each quadrant. If the there are fewer than three noisy pixels in the level2.evt file, extra rows are filled as -1
| Pixel properties | Quadrant properties | ||||||
|---|---|---|---|---|---|---|---|
| Quadrant | DetID | PixID | Counts | Sigma | Mean | Median | Sigma |
| A | 7 | 29 | 3624028 | 22812.32 | 641 | 625 | 158.8 |
| A | 3 | 14 | 293322 | 1842.77 | 641 | 625 | 158.8 |
| A | 4 | 249 | 94949 | 593.85 | 641 | 625 | 158.8 |
| B | 4 | 171 | 269144 | 1790.54 | 708 | 683 | 149.9 |
| B | 5 | 236 | 237126 | 1576.99 | 708 | 683 | 149.9 |
| B | 4 | 81 | 99796 | 661.05 | 708 | 683 | 149.9 |
| C | 9 | 38 | 1038295 | 5400.69 | 700 | 691 | 192.1 |
| C | 0 | 209 | 181745 | 942.38 | 700 | 691 | 192.1 |
| C | 9 | 237 | 140719 | 728.84 | 700 | 691 | 192.1 |
| D | 8 | 176 | 1964625 | 10697.38 | 651 | 622 | 183.6 |
| D | 3 | 12 | 1657066 | 9022.19 | 651 | 622 | 183.6 |
| D | 2 | 62 | 433146 | 2355.84 | 651 | 622 | 183.6 |
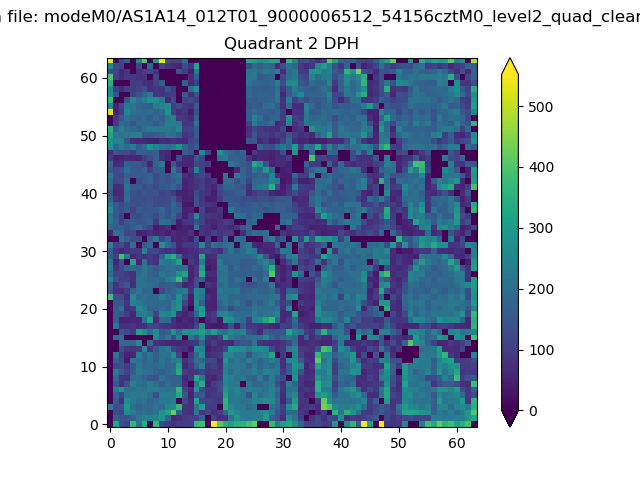
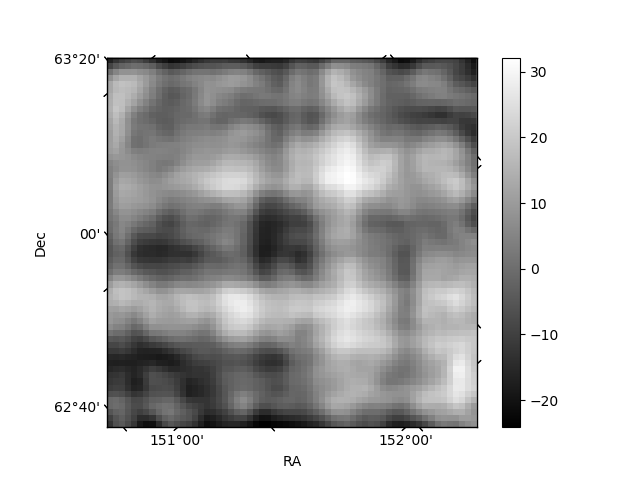
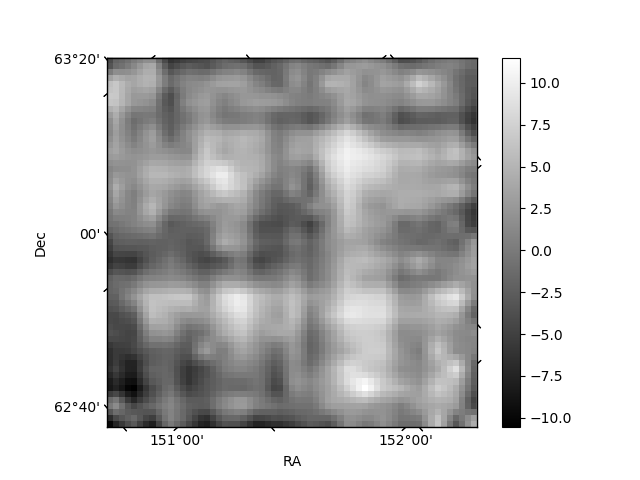
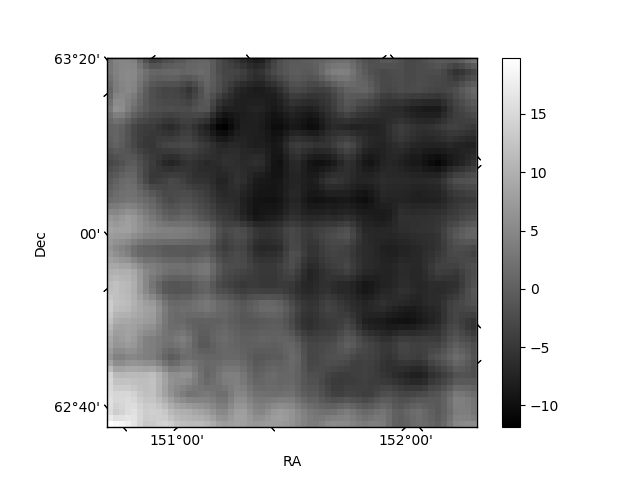
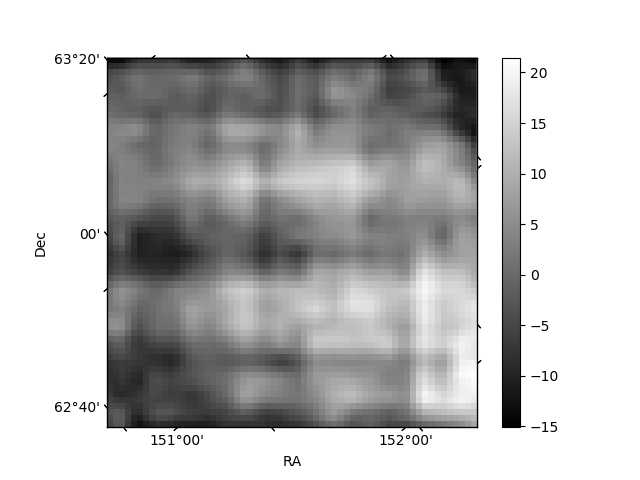
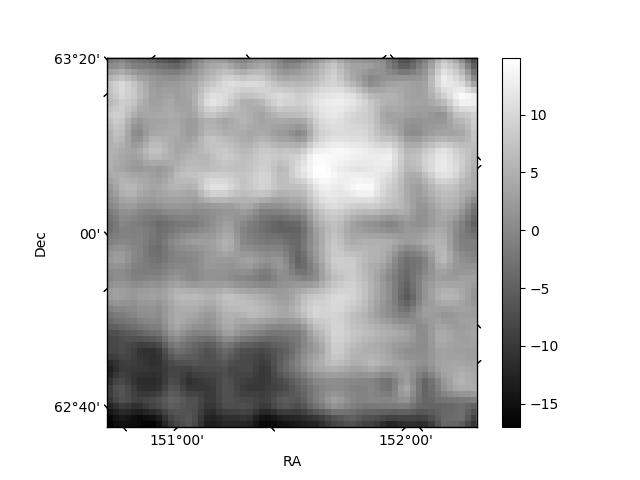
Histogram calculated using DETX and DETY for each event in the final _common_clean file
| Quadrant A | 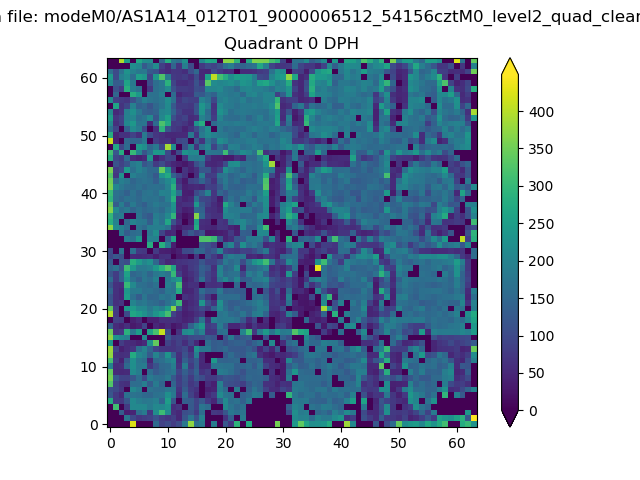 |
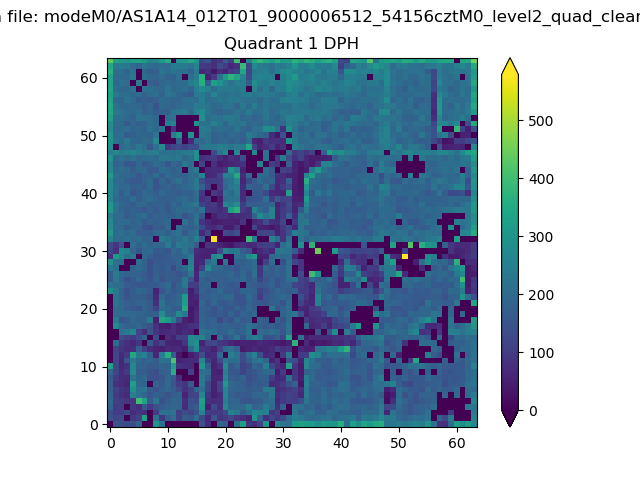 |
Quadrant B |
|---|---|---|---|
| Quadrant D | 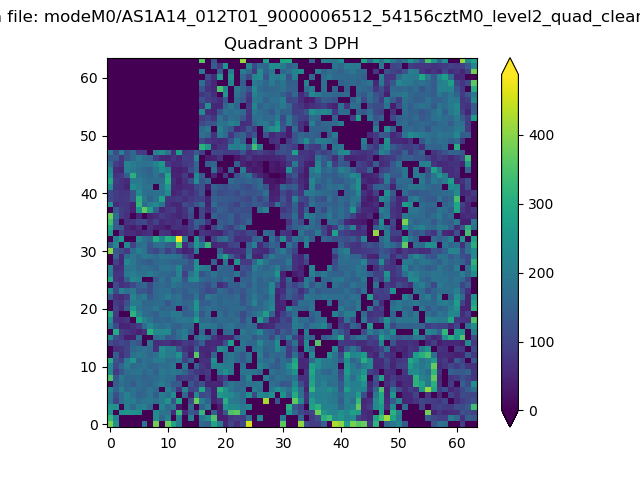 |
 |
Quadrant C |
| Plot type | Count rate plots | Images |
|---|---|---|
| Comparison with Poisson distribution Blue bars denote a histogram of data divided into 1 sec bins. Red curve is a Poisson curve with rate = median count rate of data. |
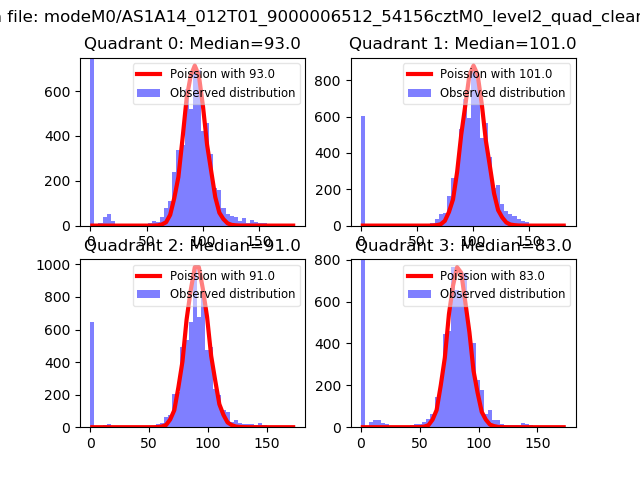 |
 |
| Quadrant-wise count rates Data is divided into 100 sec bins |
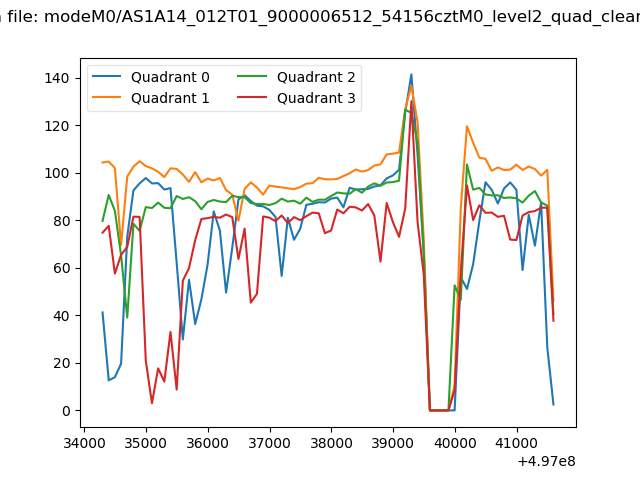 |
|
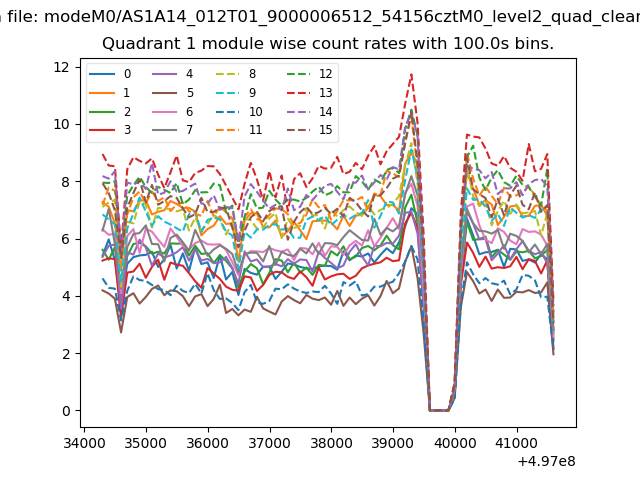
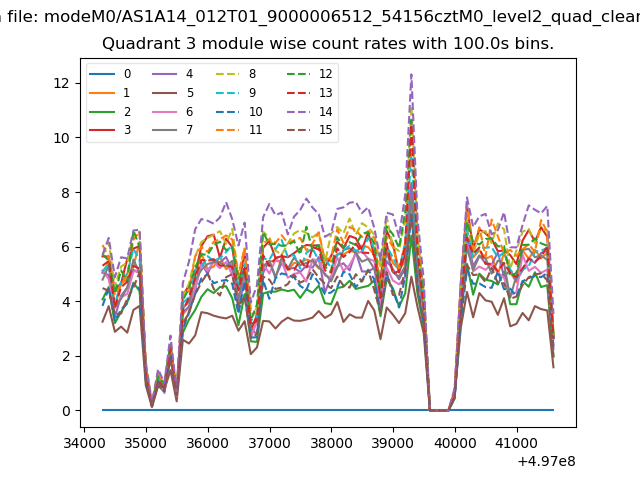
| Module-wise count rates for Quadrant A Data is divided into 100 sec bins |
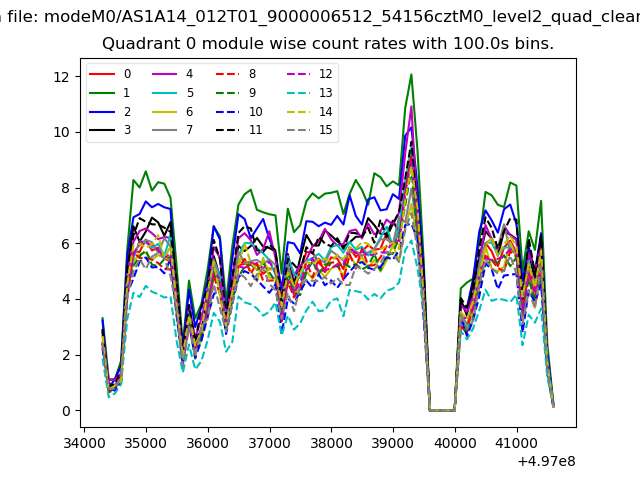 |
 |
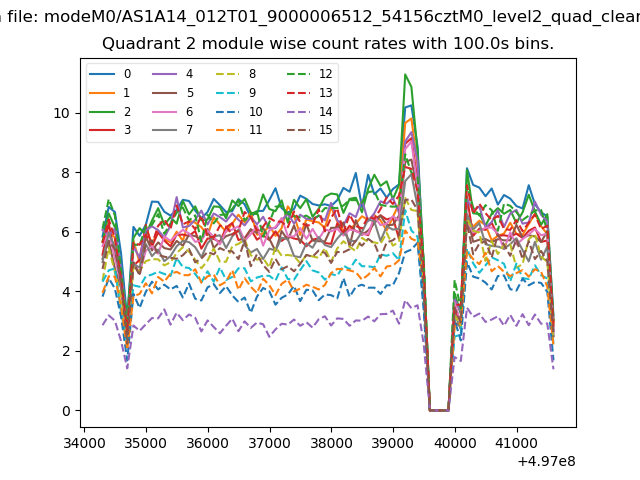
| Module-wise count rates for Quadrant B Data is divided into 100 sec bins |
 |
 |
| Module-wise count rates for Quadrant C Data is divided into 100 sec bins |
 |
 |
| Module-wise count rates for Quadrant D Data is divided into 100 sec bins |
 |
 |
| Parameter | Plot |
|---|---|
| CZT HV Monitor | 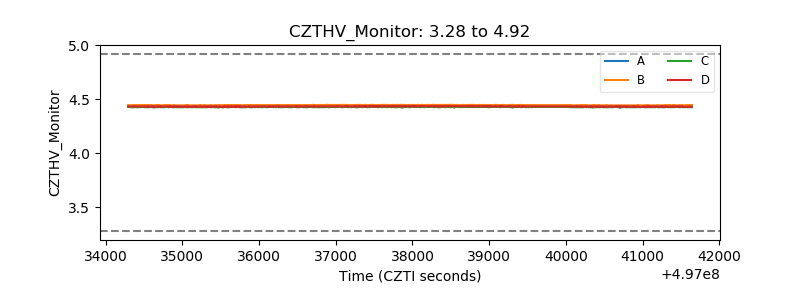 |
| D_VDD | 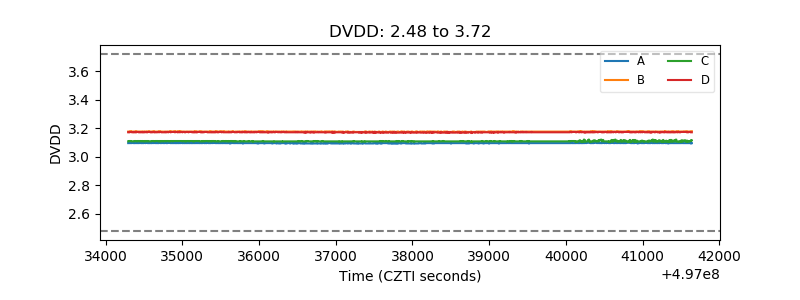 |
| Temperature 1 | 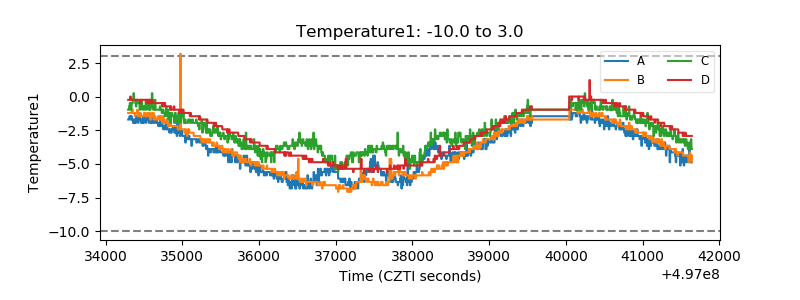 |
| Veto HV Monitor | 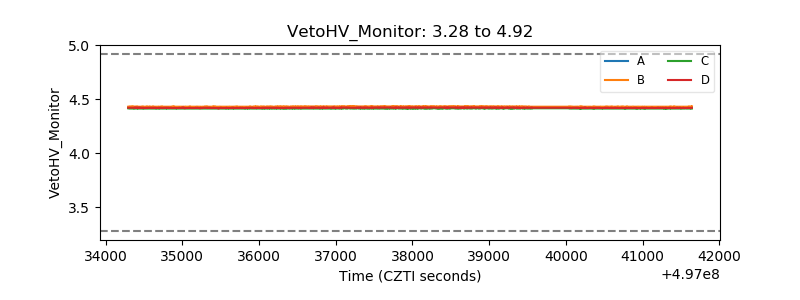 |
| Veto LLD | 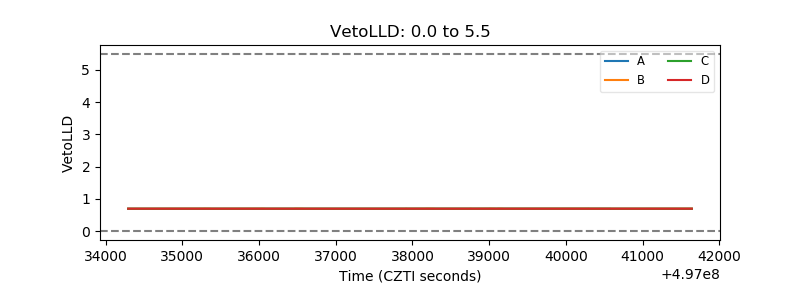 |
| Alpha Counter | 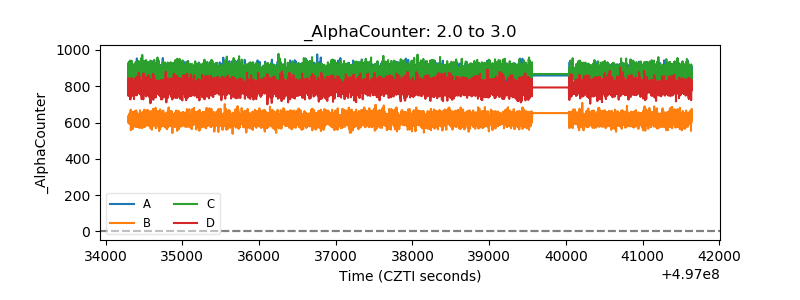 |
| _CPM_Rate | 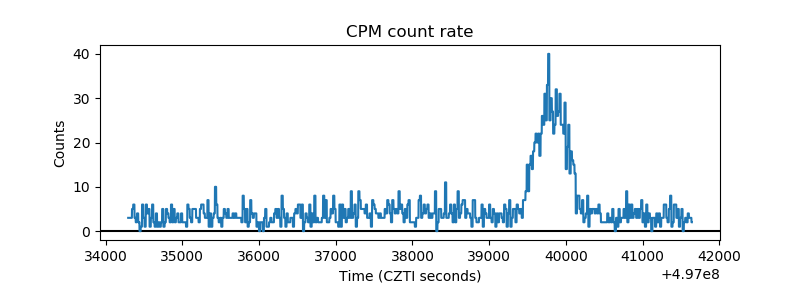 |
| CZT Counter | 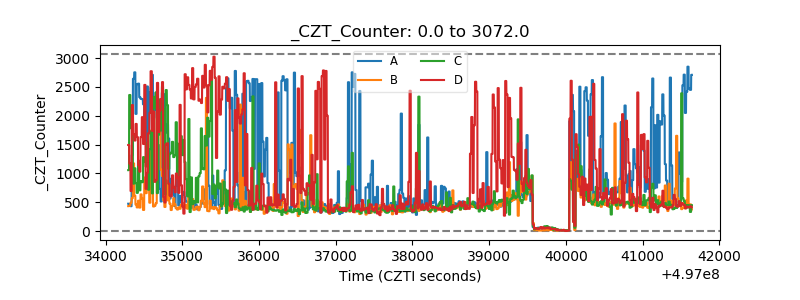 |
| +2.5 Volts monitor | 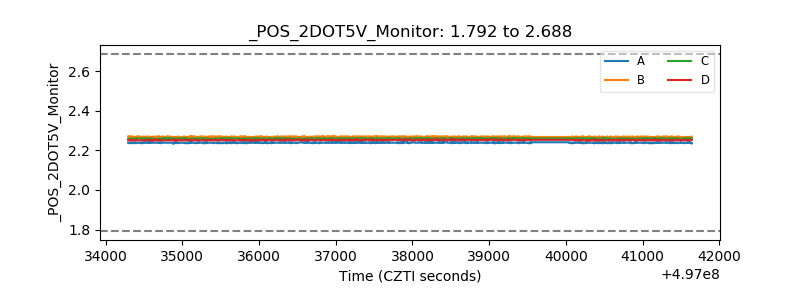 |
| +5 Volts monitor |  |
| _ROLL_ROT | 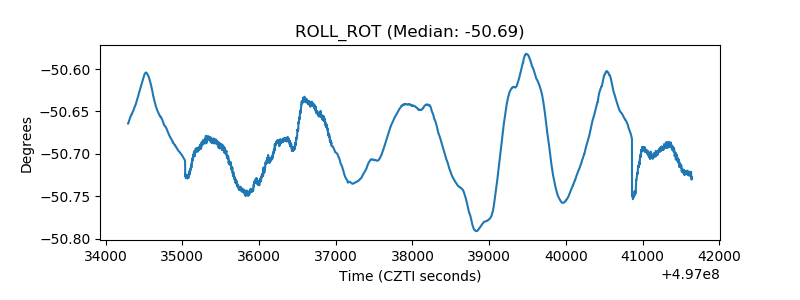 |
| _Roll_DEC | 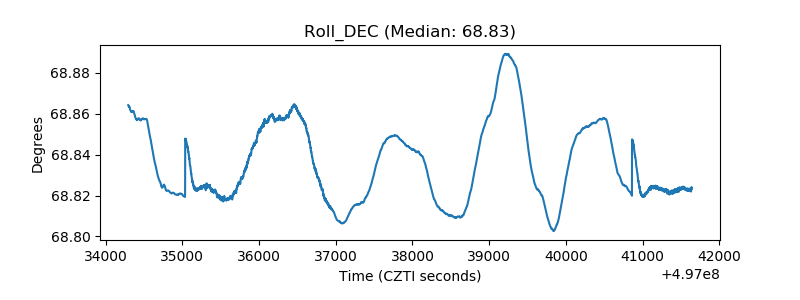 |
| _Roll_RA | 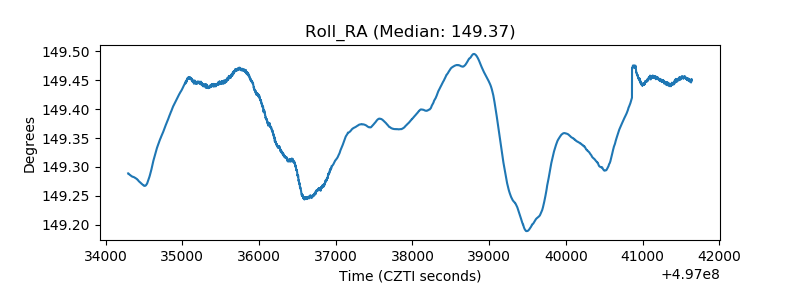 |
| Veto Counter | 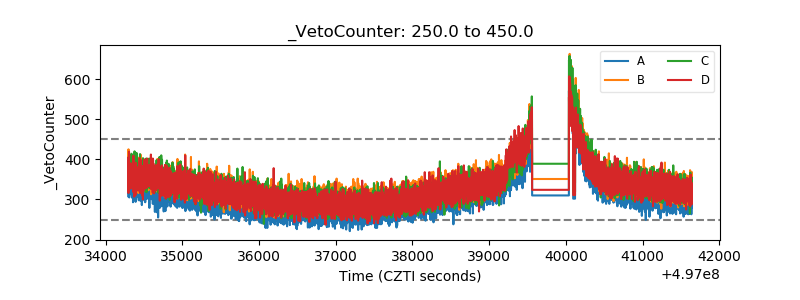 |