| Param | Original file | Final file |
|---|---|---|
| Filename | modeM0/AS1A14_012T01_9000006512_54157cztM0_level2.fits | modeM0/AS1A14_012T01_9000006512_54157cztM0_level2_quad_clean.evt |
| Size (bytes) | 533,131,200 | 102,922,560 |
| Size | 508.4 MB | 98.2 MB |
| Events in quadrant A | 5,782,055 | 620,792 |
| Events in quadrant B | 4,316,999 | 714,556 |
| Events in quadrant C | 4,234,732 | 641,544 |
| Events in quadrant D | 4,795,723 | 597,109 |
| Mode SS | |||
|---|---|---|---|
| Quadrant | BADHDUFLAG | Total packets | Discarded packets |
| A | 0 | 156 | 0 |
| B | 0 | 156 | 0 |
| C | 0 | 156 | 0 |
| D | 0 | 156 | 0 |
| Mode M0 | |||
|---|---|---|---|
| Quadrant | BADHDUFLAG | Total packets | Discarded packets |
| A | 0 | 22831 | 2 |
| B | 0 | 18372 | 2 |
| C | 0 | 18077 | 2 |
| D | 0 | 20122 | 2 |
| Quadrant | Total seconds | Saturated seconds | Saturation percentage |
|---|---|---|---|
| A | 7794 | 767 | 9.840903% |
| B | 7795 | 182 | 2.334830% |
| C | 7795 | 143 | 1.834509% |
| D | 7795 | 254 | 3.258499% |
Noise dominated data is calculated using 1-second bins in cleaned event files. If a bin has >2000 counts, and if more than 50% of those come from <1% of pixels, then it is considered to be noise-dominated and hence unusable.
| Quadrant | # 1 sec bins | Bins with >0 counts | Bins with >2000 counts | High rate bins dominated by noise | Noise dominated (total time) | Noise dominated (detector-on time) | Marked lightcurve |
|---|---|---|---|---|---|---|---|
| A | 8094 | 8070 | 564 | 564 | 6.97% | 6.99% | 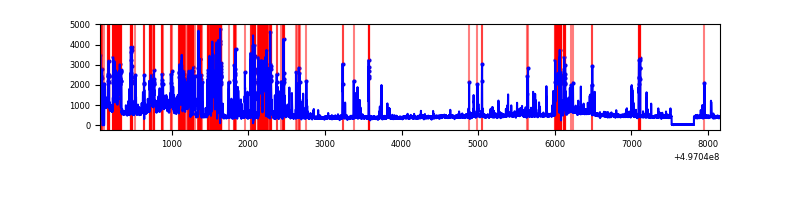 |
| B | 8095 | 8071 | 66 | 66 | 0.82% | 0.82% | 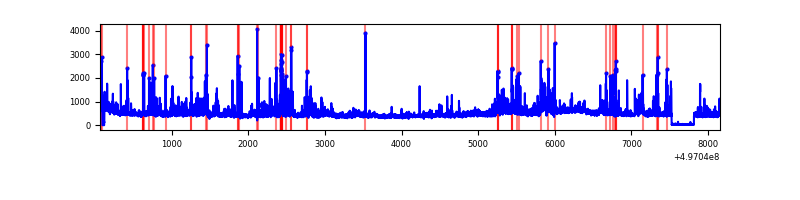 |
| C | 8095 | 8071 | 92 | 92 | 1.14% | 1.14% | 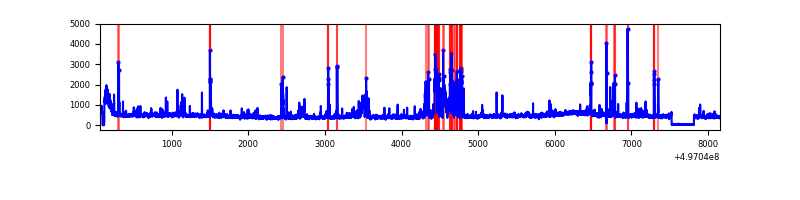 |
| D | 8095 | 8071 | 208 | 208 | 2.57% | 2.58% | 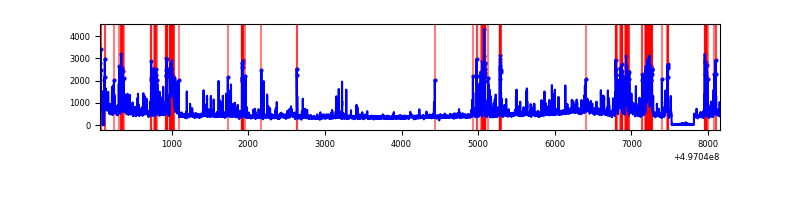 |
Top three noisy pixels from each quadrant. If the there are fewer than three noisy pixels in the level2.evt file, extra rows are filled as -1
| Pixel properties | Quadrant properties | ||||||
|---|---|---|---|---|---|---|---|
| Quadrant | DetID | PixID | Counts | Sigma | Mean | Median | Sigma |
| A | 7 | 29 | 1969818 | 10040.34 | 785 | 764 | 196.1 |
| A | 3 | 14 | 294879 | 1499.71 | 785 | 764 | 196.1 |
| A | 0 | 8 | 213906 | 1086.83 | 785 | 764 | 196.1 |
| B | 5 | 185 | 182889 | 1048.87 | 823 | 793 | 173.6 |
| B | 5 | 236 | 165029 | 946.0 | 823 | 793 | 173.6 |
| B | 4 | 171 | 154324 | 884.33 | 823 | 793 | 173.6 |
| C | 12 | 250 | 477246 | 2112.67 | 815 | 805 | 225.5 |
| C | 9 | 38 | 119585 | 526.7 | 815 | 805 | 225.5 |
| C | 14 | 254 | 104548 | 460.02 | 815 | 805 | 225.5 |
| D | 8 | 176 | 1214562 | 5338.99 | 803 | 766 | 227.3 |
| D | 3 | 12 | 113544 | 496.06 | 803 | 766 | 227.3 |
| D | 3 | 144 | 91745 | 400.18 | 803 | 766 | 227.3 |
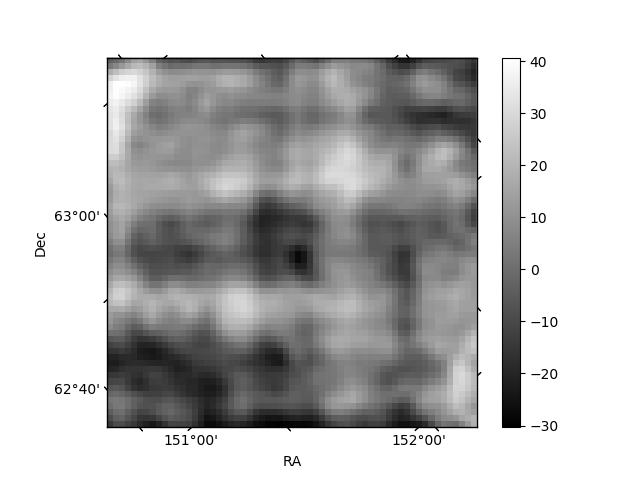
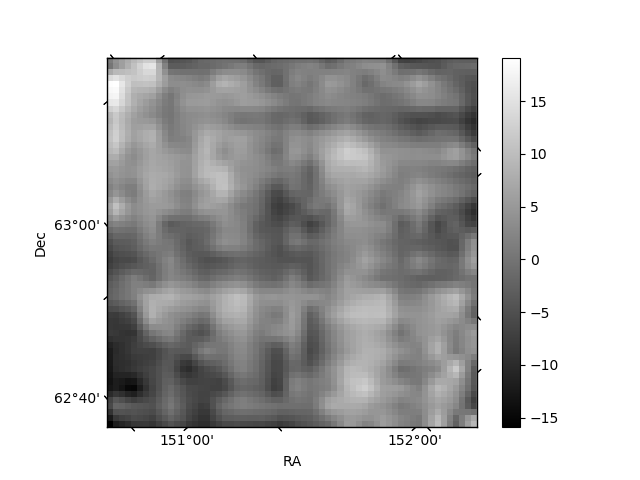
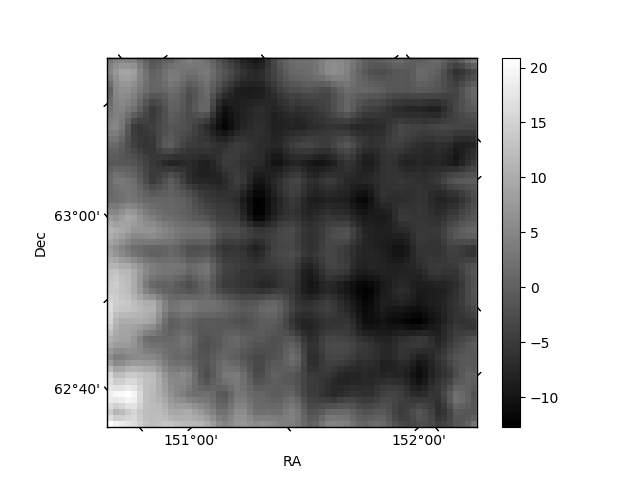
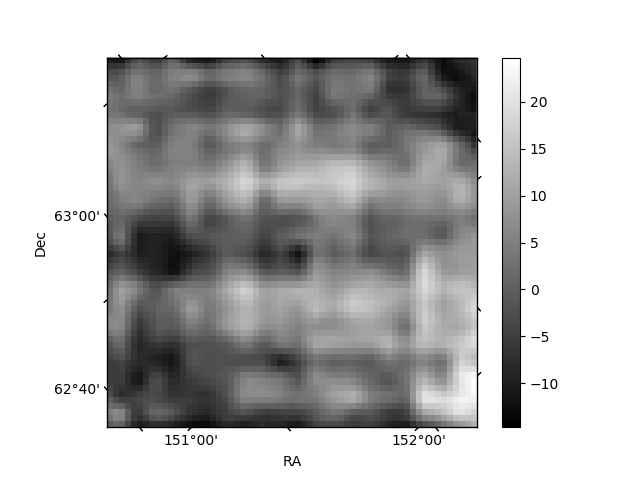
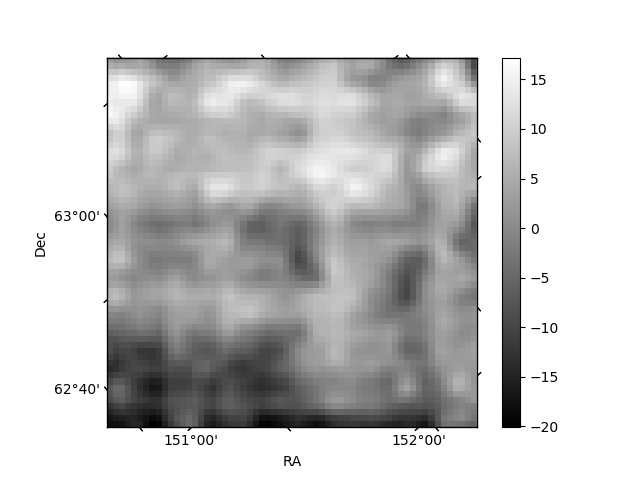
Histogram calculated using DETX and DETY for each event in the final _common_clean file
| Quadrant A | 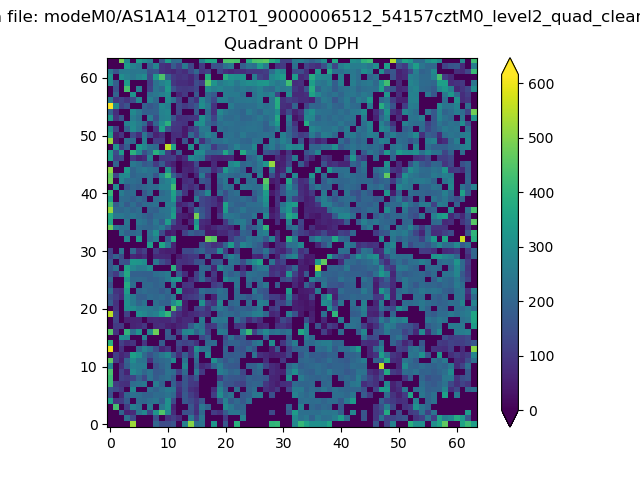 |
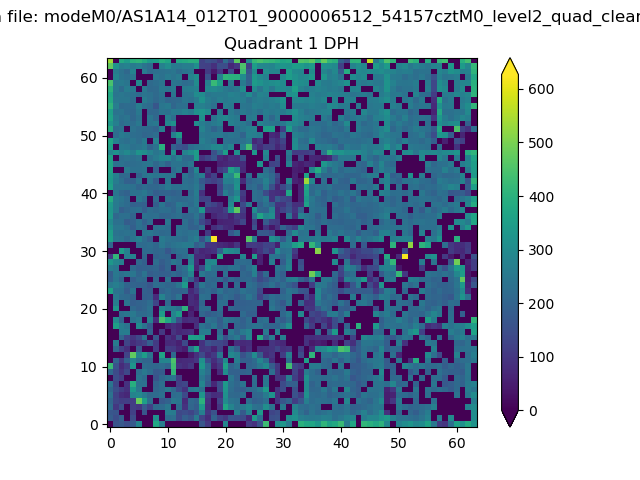 |
Quadrant B |
|---|---|---|---|
| Quadrant D | 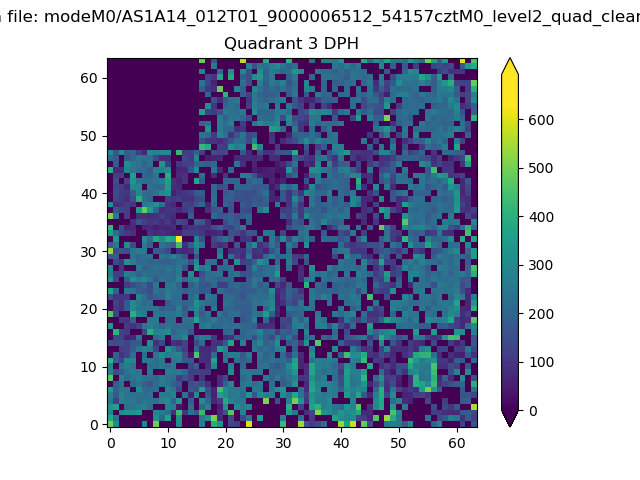 |
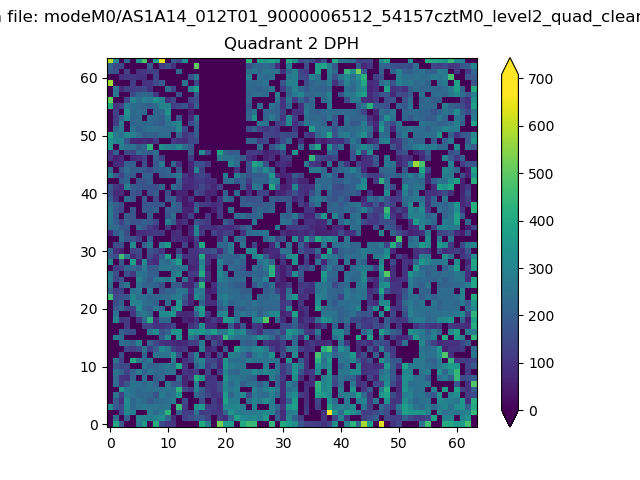 |
Quadrant C |
| Plot type | Count rate plots | Images |
|---|---|---|
| Comparison with Poisson distribution Blue bars denote a histogram of data divided into 1 sec bins. Red curve is a Poisson curve with rate = median count rate of data. |
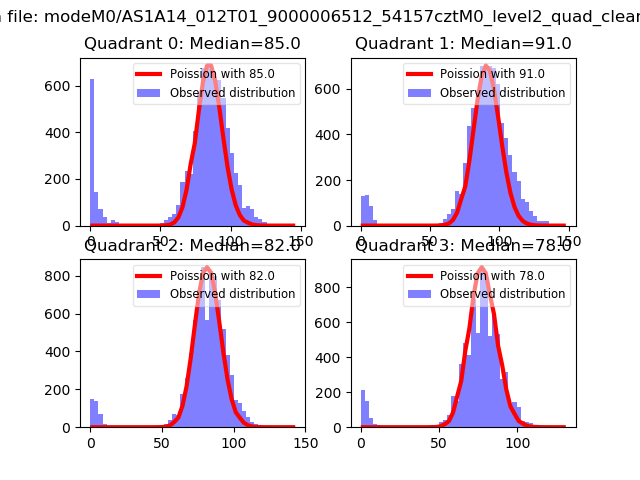 |
 |
| Quadrant-wise count rates Data is divided into 100 sec bins |
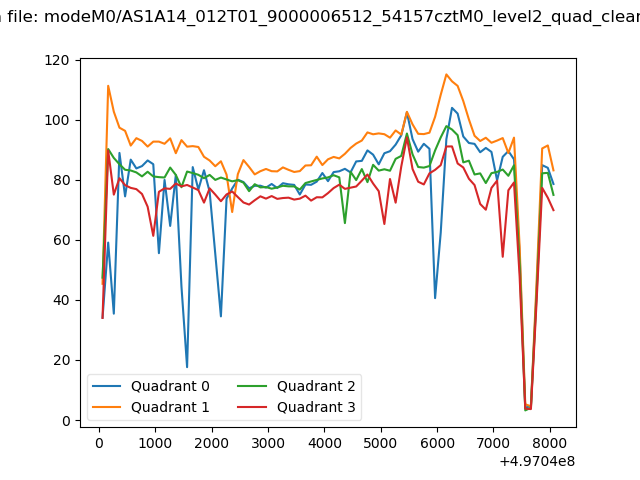 |
|
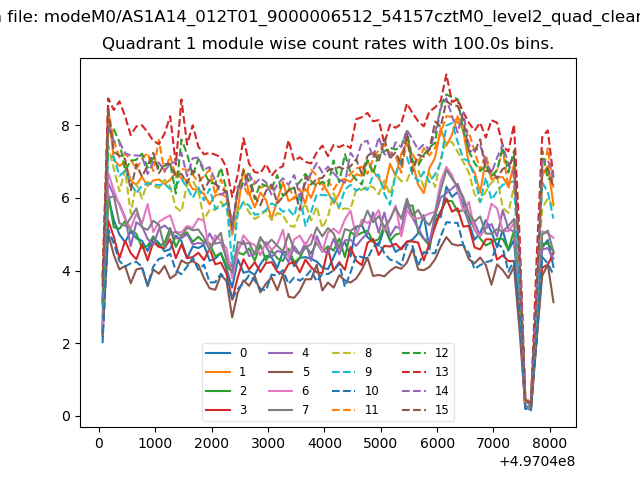
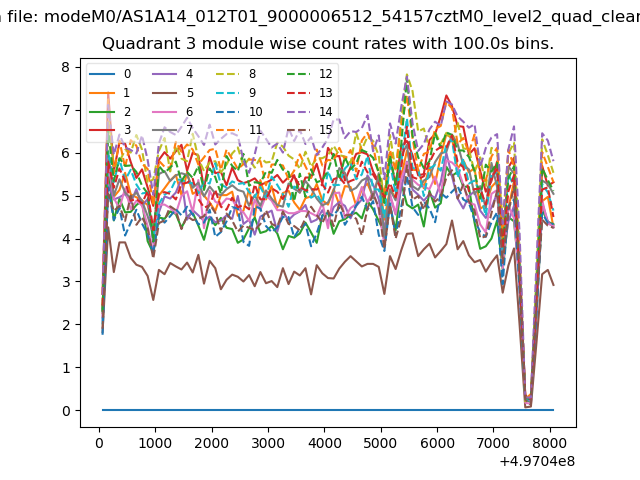
| Module-wise count rates for Quadrant A Data is divided into 100 sec bins |
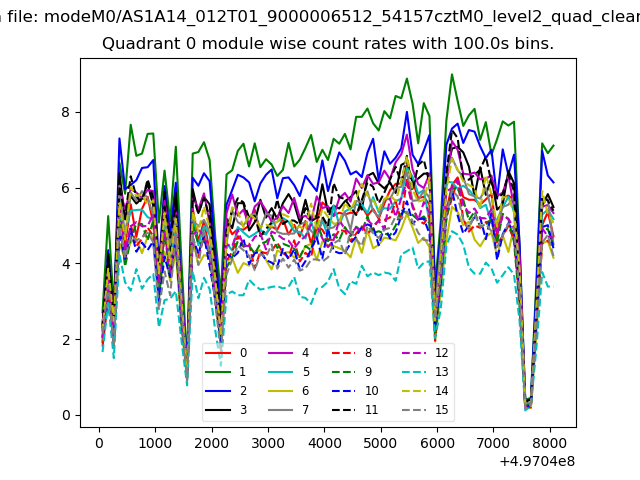 |
 |
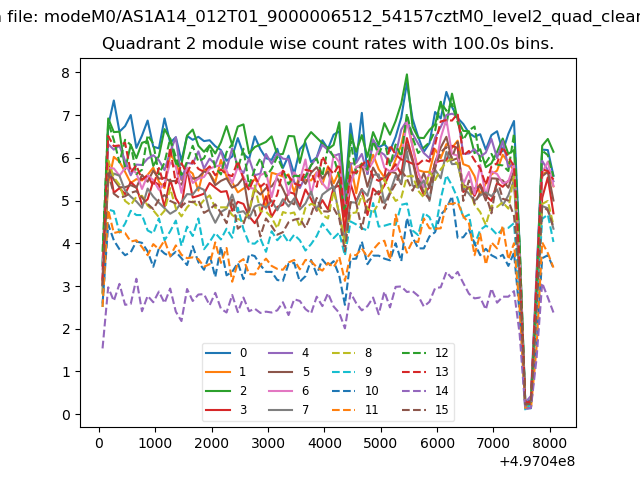
| Module-wise count rates for Quadrant B Data is divided into 100 sec bins |
 |
 |
| Module-wise count rates for Quadrant C Data is divided into 100 sec bins |
 |
 |
| Module-wise count rates for Quadrant D Data is divided into 100 sec bins |
 |
 |
| Parameter | Plot |
|---|---|
| CZT HV Monitor | 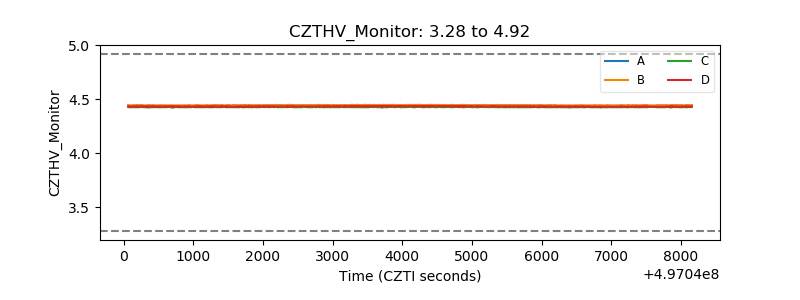 |
| D_VDD | 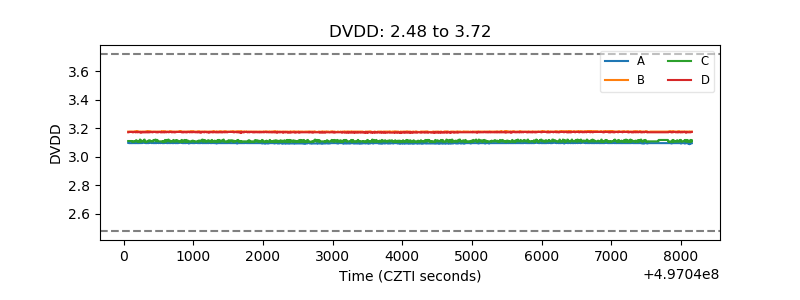 |
| Temperature 1 | 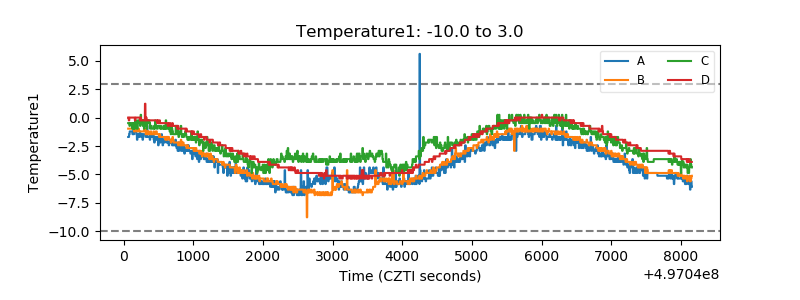 |
| Veto HV Monitor | 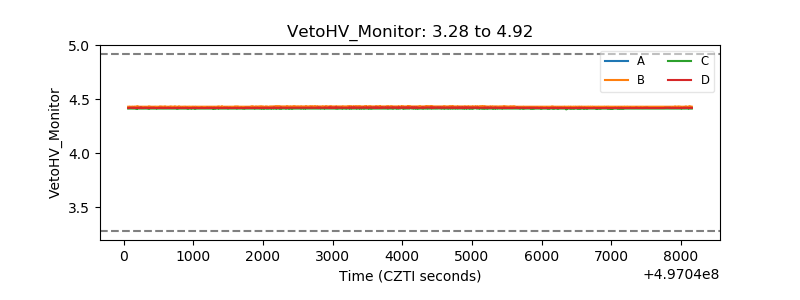 |
| Veto LLD | 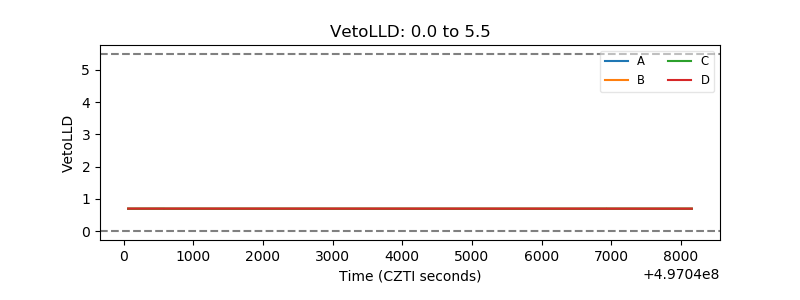 |
| Alpha Counter | 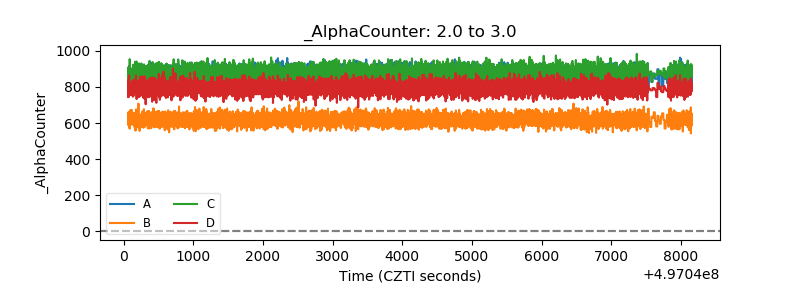 |
| _CPM_Rate | 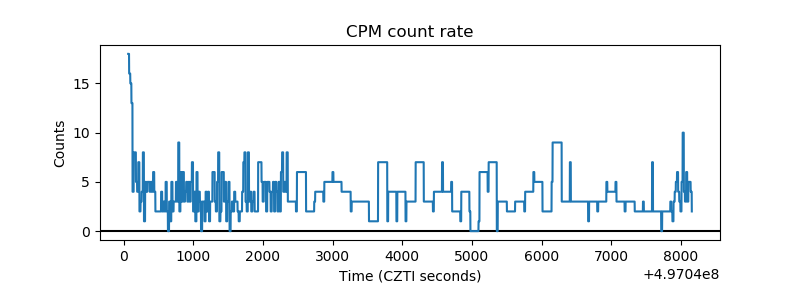 |
| CZT Counter | 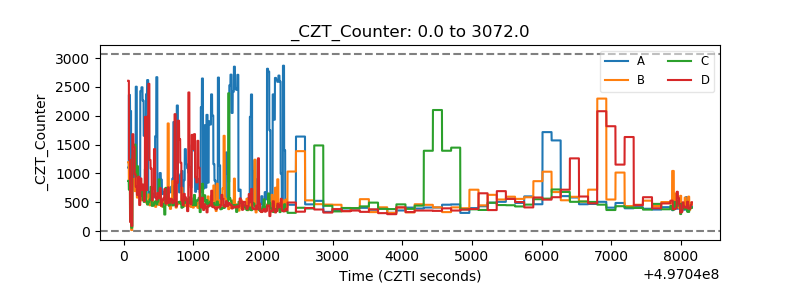 |
| +2.5 Volts monitor |  |
| +5 Volts monitor |  |
| _ROLL_ROT | 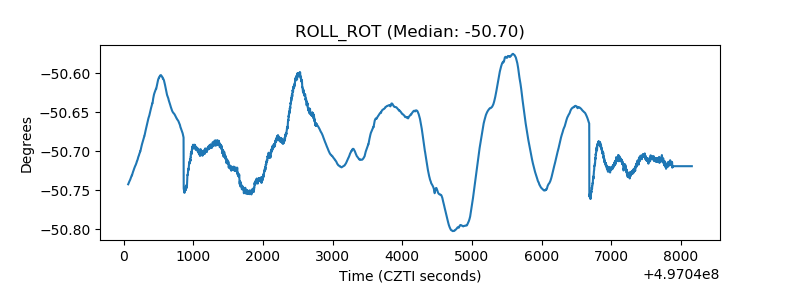 |
| _Roll_DEC | 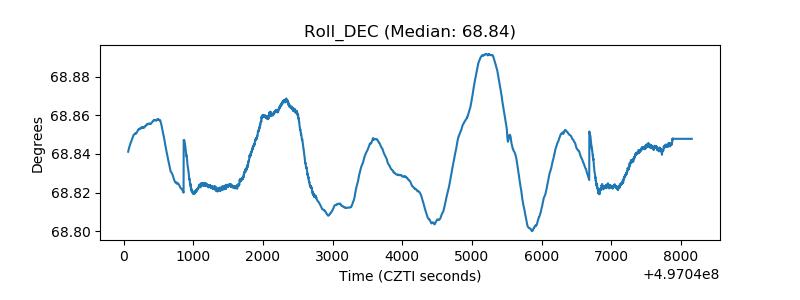 |
| _Roll_RA | 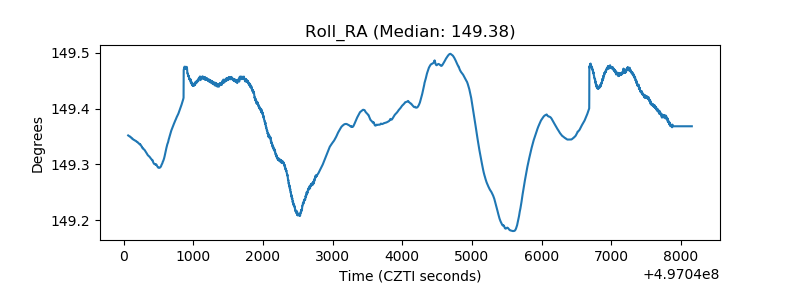 |
| Veto Counter | 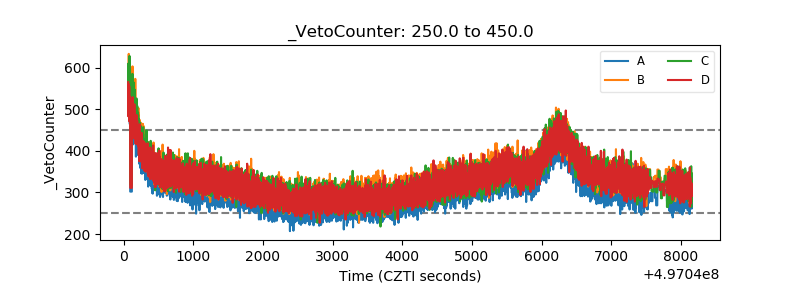 |