| Param | Original file | Final file |
|---|---|---|
| Filename | modeM0/AS1A14_012T01_9000006512_54158cztM0_level2.fits | modeM0/AS1A14_012T01_9000006512_54158cztM0_level2_quad_clean.evt |
| Size (bytes) | 540,253,440 | 107,147,520 |
| Size | 515.2 MB | 102.2 MB |
| Events in quadrant A | 4,953,493 | 671,043 |
| Events in quadrant B | 4,527,587 | 739,547 |
| Events in quadrant C | 4,511,721 | 656,852 |
| Events in quadrant D | 5,362,791 | 601,793 |
| Mode SS | |||
|---|---|---|---|
| Quadrant | BADHDUFLAG | Total packets | Discarded packets |
| A | 0 | 164 | 0 |
| B | 0 | 164 | 0 |
| C | 0 | 164 | 0 |
| D | 0 | 164 | 0 |
| Mode M0 | |||
|---|---|---|---|
| Quadrant | BADHDUFLAG | Total packets | Discarded packets |
| A | 0 | 20767 | 0 |
| B | 0 | 19484 | 0 |
| C | 0 | 19740 | 0 |
| D | 0 | 21985 | 0 |
| Quadrant | Total seconds | Saturated seconds | Saturation percentage |
|---|---|---|---|
| A | 8275 | 462 | 5.583082% |
| B | 8275 | 210 | 2.537764% |
| C | 8276 | 98 | 1.184147% |
| D | 8276 | 260 | 3.141614% |
Noise dominated data is calculated using 1-second bins in cleaned event files. If a bin has >2000 counts, and if more than 50% of those come from <1% of pixels, then it is considered to be noise-dominated and hence unusable.
| Quadrant | # 1 sec bins | Bins with >0 counts | Bins with >2000 counts | High rate bins dominated by noise | Noise dominated (total time) | Noise dominated (detector-on time) | Marked lightcurve |
|---|---|---|---|---|---|---|---|
| A | 8550 | 8550 | 338 | 338 | 3.95% | 3.95% | 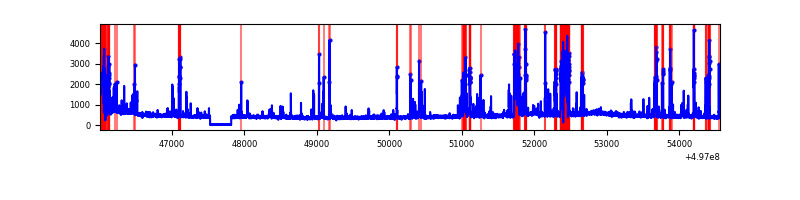 |
| B | 8550 | 8550 | 118 | 118 | 1.38% | 1.38% | 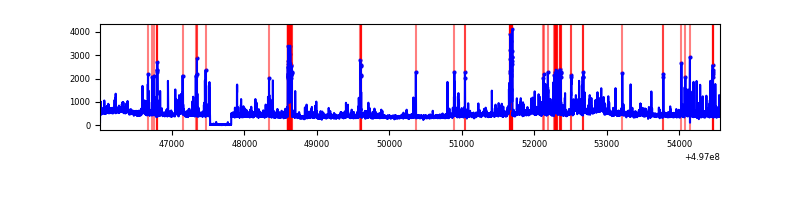 |
| C | 8551 | 8551 | 30 | 30 | 0.35% | 0.35% | 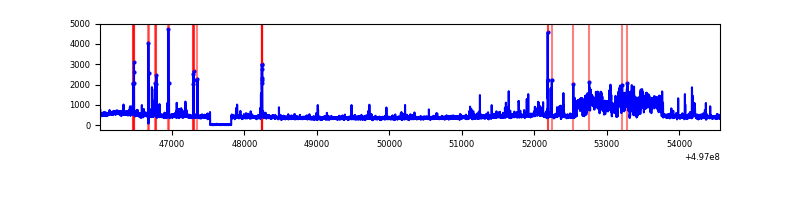 |
| D | 8551 | 8551 | 266 | 266 | 3.11% | 3.11% | 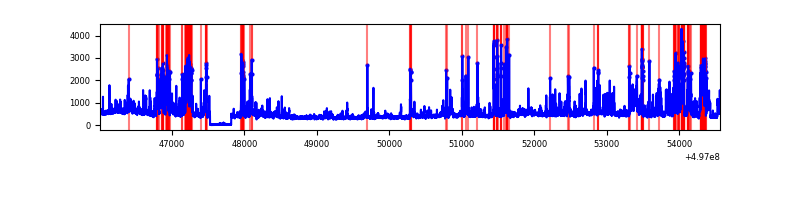 |
Top three noisy pixels from each quadrant. If the there are fewer than three noisy pixels in the level2.evt file, extra rows are filled as -1
| Pixel properties | Quadrant properties | ||||||
|---|---|---|---|---|---|---|---|
| Quadrant | DetID | PixID | Counts | Sigma | Mean | Median | Sigma |
| A | 7 | 29 | 649550 | 3056.46 | 855 | 832 | 212.2 |
| A | 0 | 8 | 451733 | 2124.43 | 855 | 832 | 212.2 |
| A | 15 | 174 | 221156 | 1038.06 | 855 | 832 | 212.2 |
| B | 4 | 171 | 352931 | 1874.03 | 873 | 841 | 187.9 |
| B | 10 | 245 | 196092 | 1039.24 | 873 | 841 | 187.9 |
| B | 5 | 185 | 126802 | 670.44 | 873 | 841 | 187.9 |
| C | 9 | 38 | 759107 | 3170.35 | 866 | 856 | 239.2 |
| C | 15 | 157 | 65426 | 269.98 | 866 | 856 | 239.2 |
| C | 14 | 254 | 62968 | 259.7 | 866 | 856 | 239.2 |
| D | 8 | 176 | 1106437 | 4592.5 | 854 | 816 | 240.7 |
| D | 3 | 12 | 440435 | 1826.08 | 854 | 816 | 240.7 |
| D | 6 | 42 | 80718 | 331.9 | 854 | 816 | 240.7 |
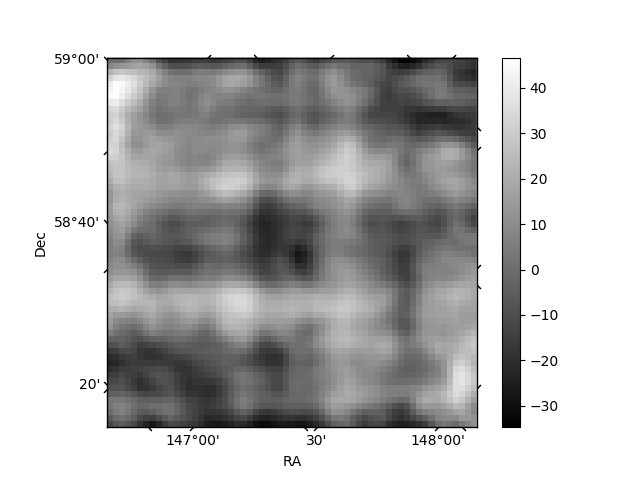
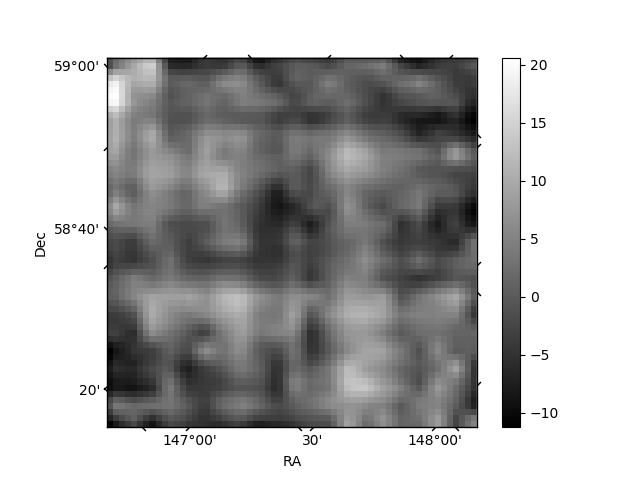
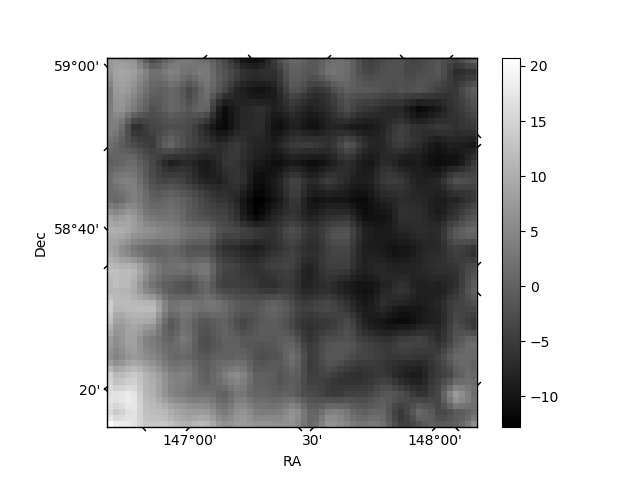
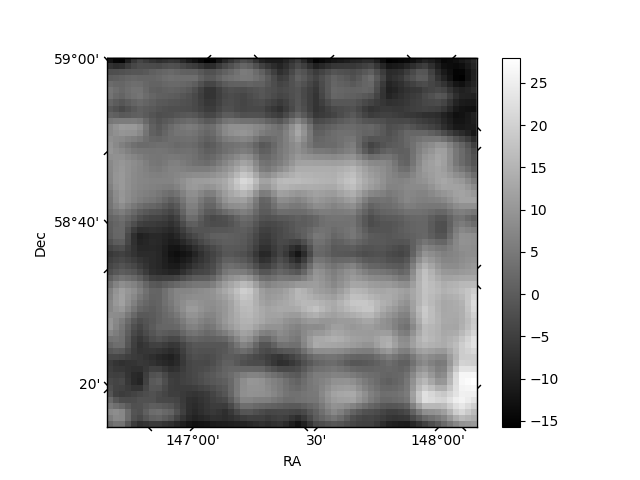
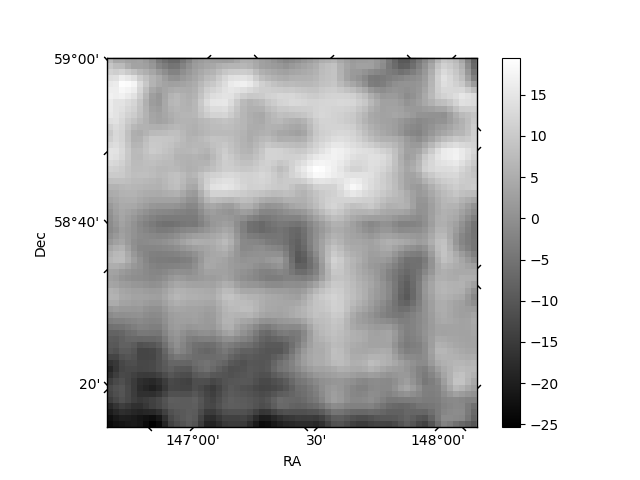
Histogram calculated using DETX and DETY for each event in the final _common_clean file
| Quadrant A | 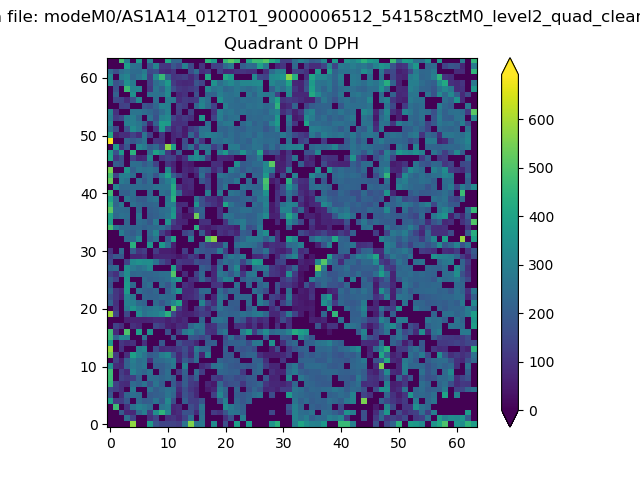 |
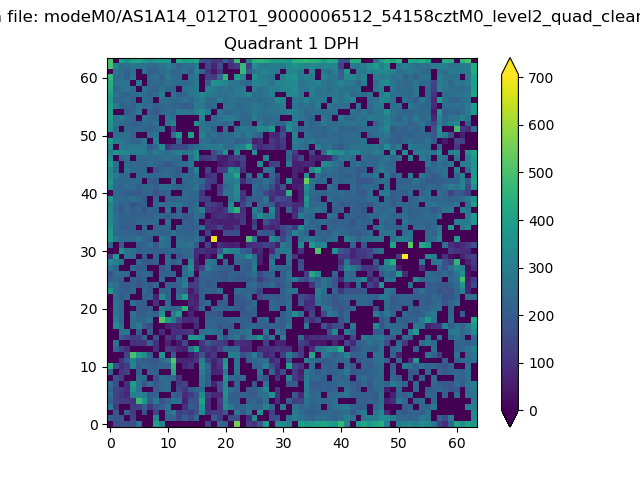 |
Quadrant B |
|---|---|---|---|
| Quadrant D | 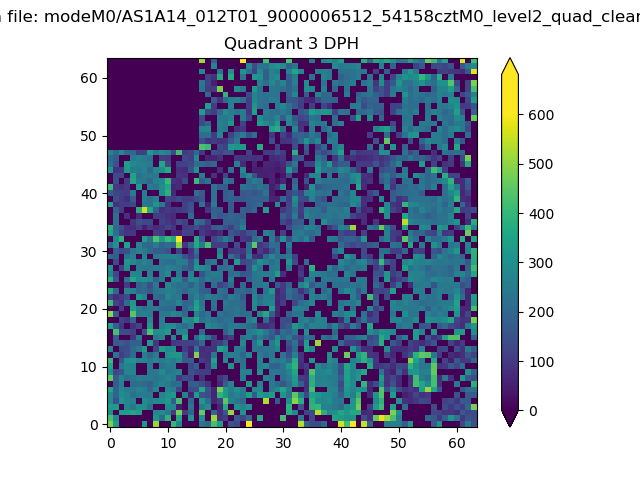 |
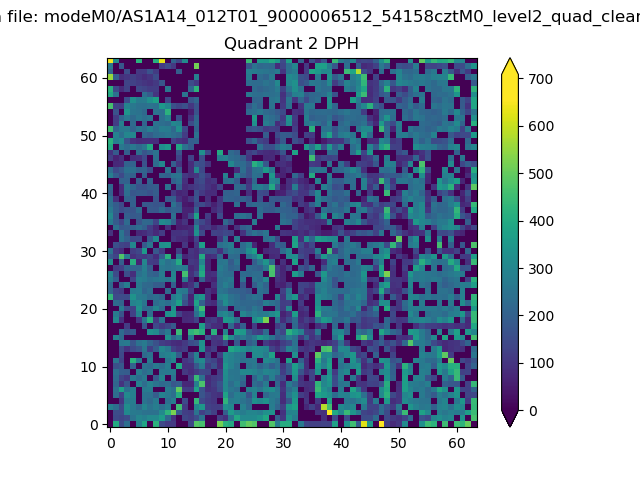 |
Quadrant C |
| Plot type | Count rate plots | Images |
|---|---|---|
| Comparison with Poisson distribution Blue bars denote a histogram of data divided into 1 sec bins. Red curve is a Poisson curve with rate = median count rate of data. |
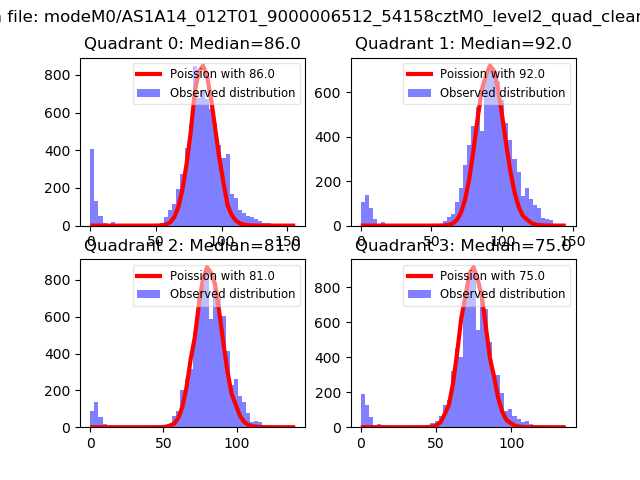 |
 |
| Quadrant-wise count rates Data is divided into 100 sec bins |
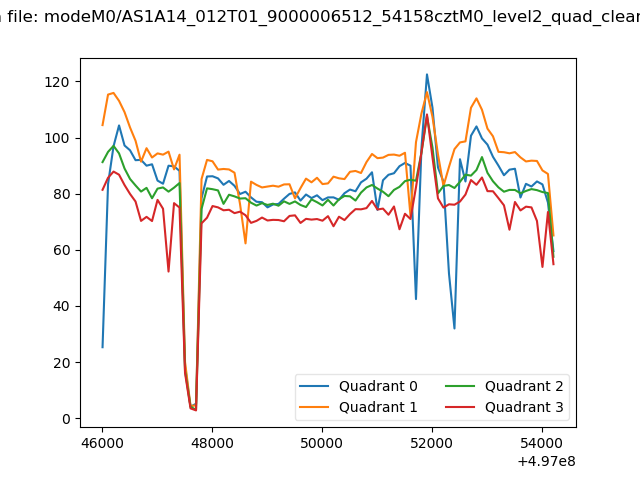 |
|
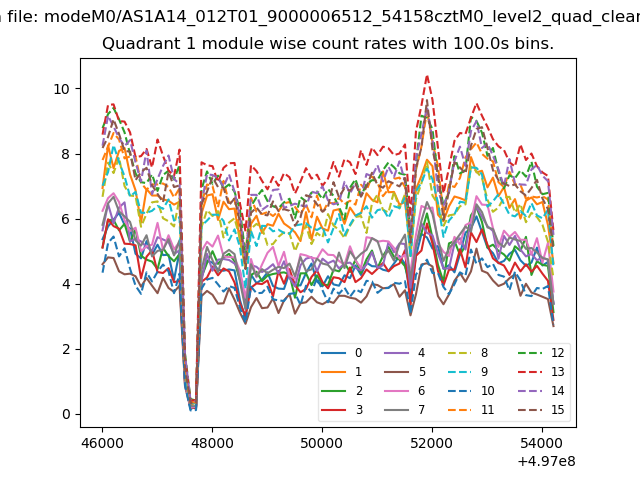
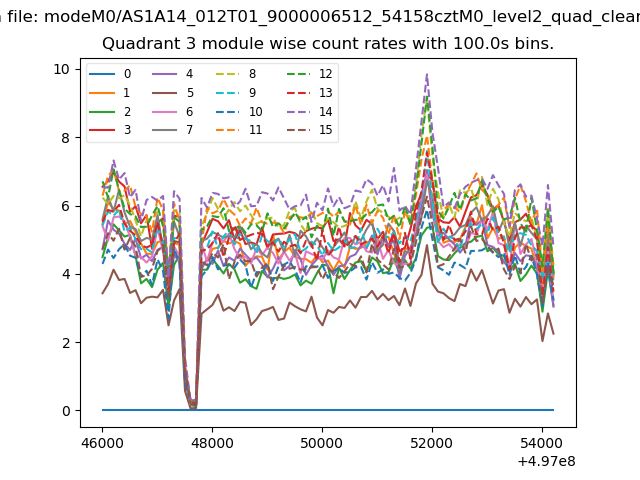
| Module-wise count rates for Quadrant A Data is divided into 100 sec bins |
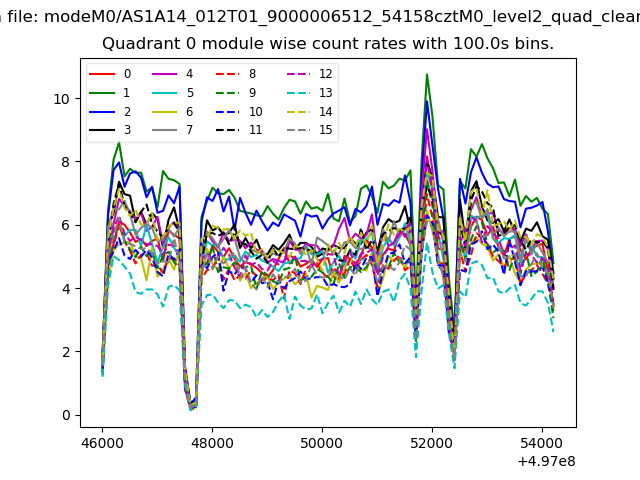 |
 |
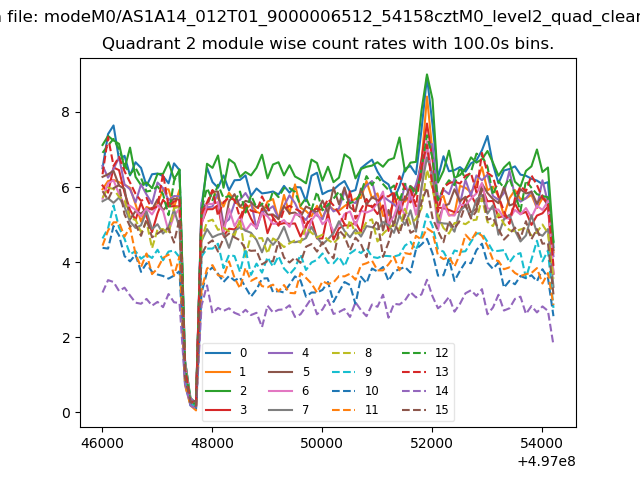
| Module-wise count rates for Quadrant B Data is divided into 100 sec bins |
 |
 |
| Module-wise count rates for Quadrant C Data is divided into 100 sec bins |
 |
 |
| Module-wise count rates for Quadrant D Data is divided into 100 sec bins |
 |
 |
| Parameter | Plot |
|---|---|
| CZT HV Monitor | 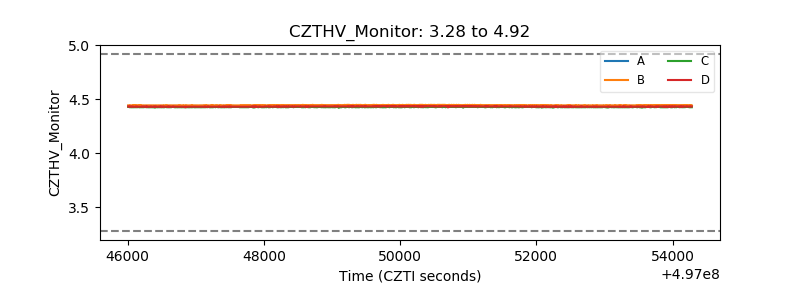 |
| D_VDD | 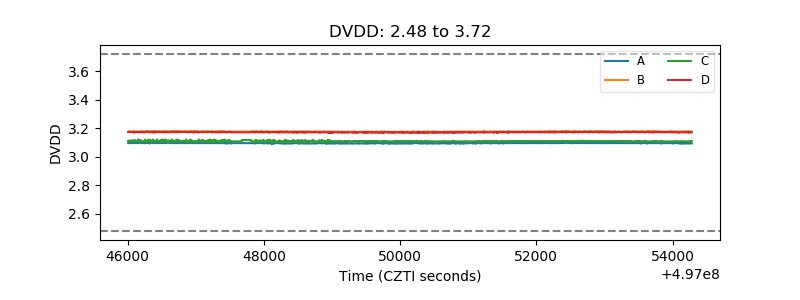 |
| Temperature 1 | 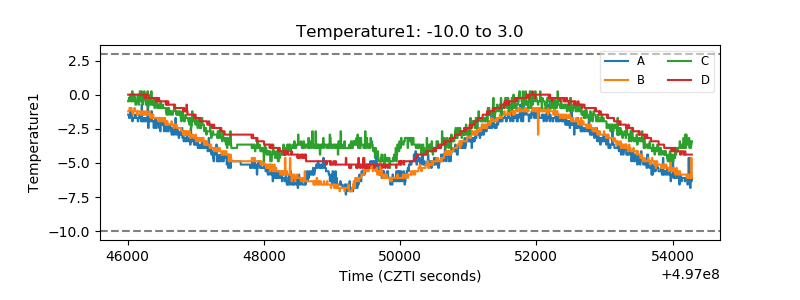 |
| Veto HV Monitor | 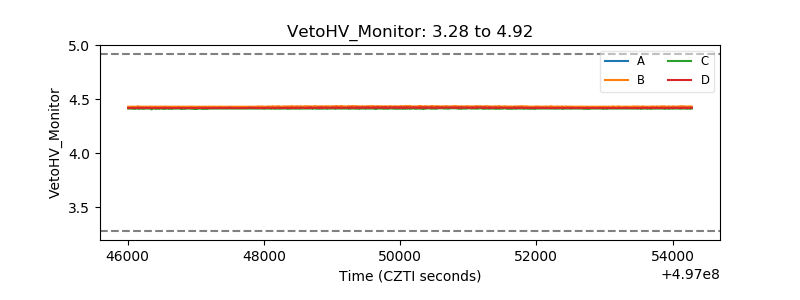 |
| Veto LLD | 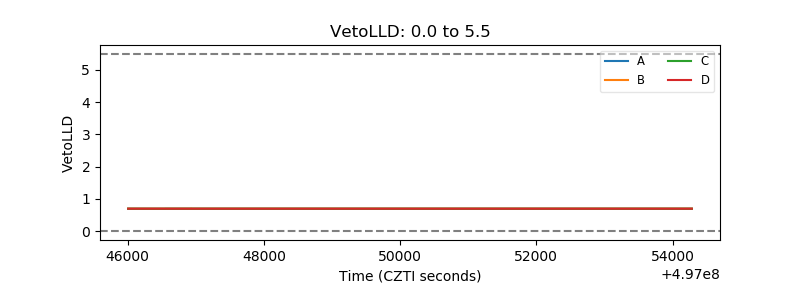 |
| Alpha Counter | 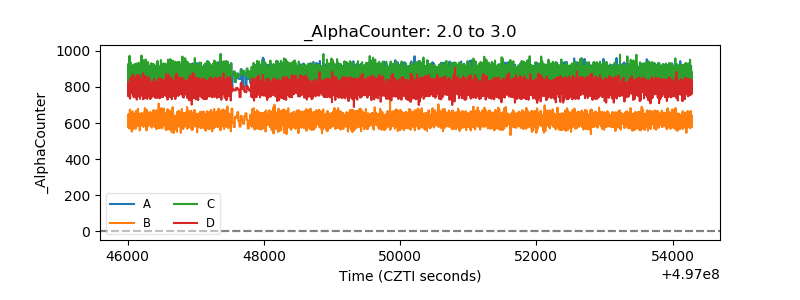 |
| _CPM_Rate | 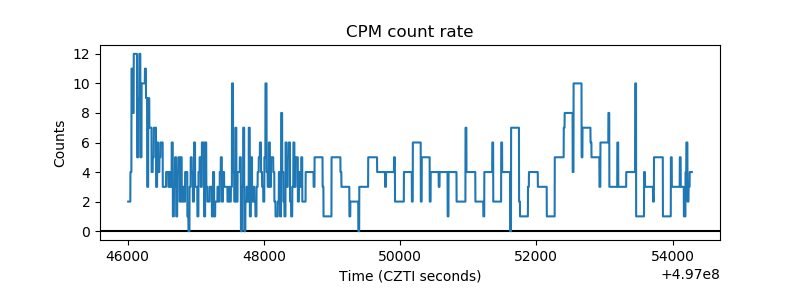 |
| CZT Counter | 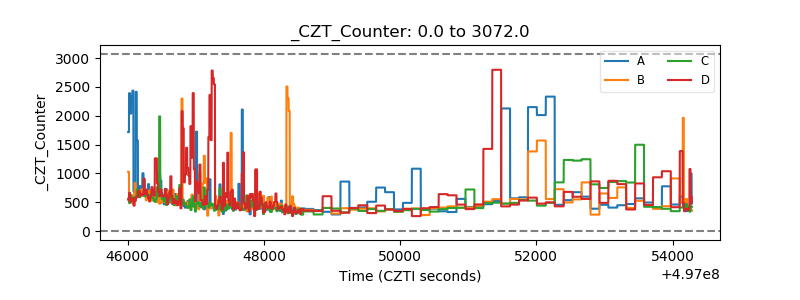 |
| +2.5 Volts monitor |  |
| +5 Volts monitor |  |
| _ROLL_ROT | 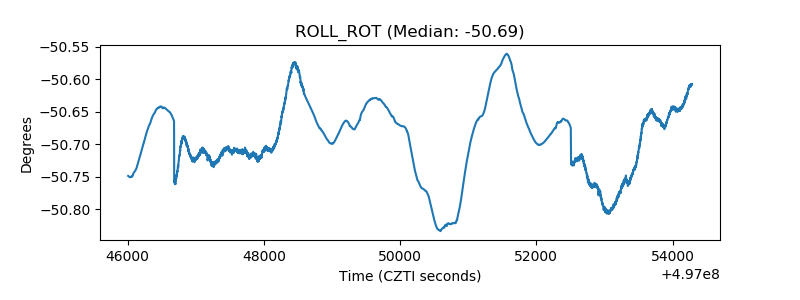 |
| _Roll_DEC | 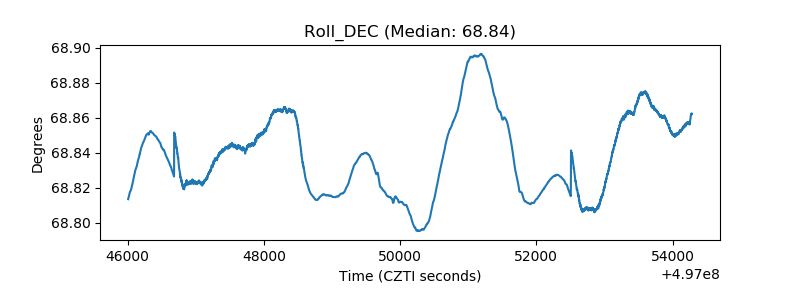 |
| _Roll_RA | 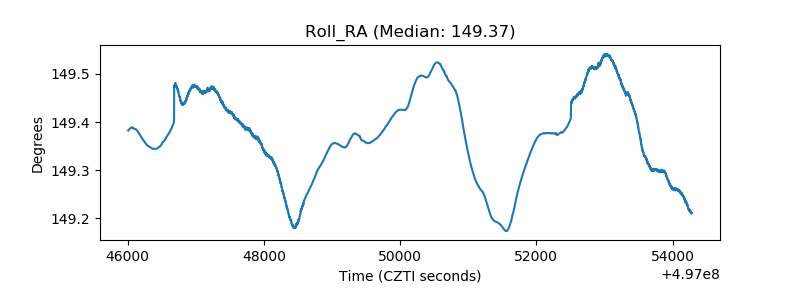 |
| Veto Counter | 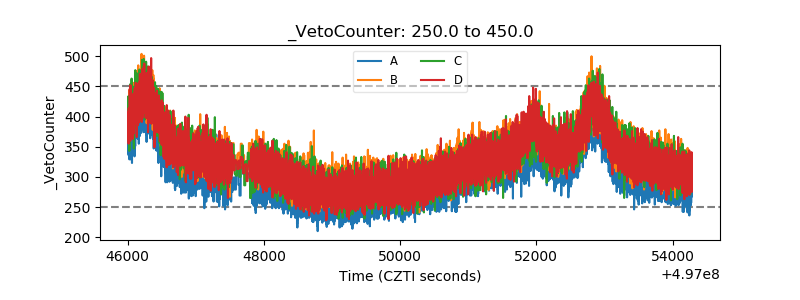 |