| Param | Original file | Final file |
|---|---|---|
| Filename | modeM0/AS1A14_012T01_9000006512_54159cztM0_level2.fits | modeM0/AS1A14_012T01_9000006512_54159cztM0_level2_quad_clean.evt |
| Size (bytes) | 576,524,160 | 122,688,000 |
| Size | 549.8 MB | 117.0 MB |
| Events in quadrant A | 5,478,506 | 755,506 |
| Events in quadrant B | 4,746,745 | 865,235 |
| Events in quadrant C | 4,703,202 | 782,554 |
| Events in quadrant D | 5,743,850 | 713,263 |
| Mode SS | |||
|---|---|---|---|
| Quadrant | BADHDUFLAG | Total packets | Discarded packets |
| A | 0 | 172 | 0 |
| B | 0 | 172 | 0 |
| C | 0 | 172 | 0 |
| D | 0 | 172 | 0 |
| Mode M0 | |||
|---|---|---|---|
| Quadrant | BADHDUFLAG | Total packets | Discarded packets |
| A | 0 | 22517 | 0 |
| B | 0 | 20394 | 0 |
| C | 0 | 20469 | 0 |
| D | 0 | 23429 | 0 |
| Quadrant | Total seconds | Saturated seconds | Saturation percentage |
|---|---|---|---|
| A | 8615 | 580 | 6.732443% |
| B | 8616 | 190 | 2.205200% |
| C | 8616 | 85 | 0.986537% |
| D | 8616 | 308 | 3.574745% |
Noise dominated data is calculated using 1-second bins in cleaned event files. If a bin has >2000 counts, and if more than 50% of those come from <1% of pixels, then it is considered to be noise-dominated and hence unusable.
| Quadrant | # 1 sec bins | Bins with >0 counts | Bins with >2000 counts | High rate bins dominated by noise | Noise dominated (total time) | Noise dominated (detector-on time) | Marked lightcurve |
|---|---|---|---|---|---|---|---|
| A | 8615 | 8615 | 460 | 460 | 5.34% | 5.34% | 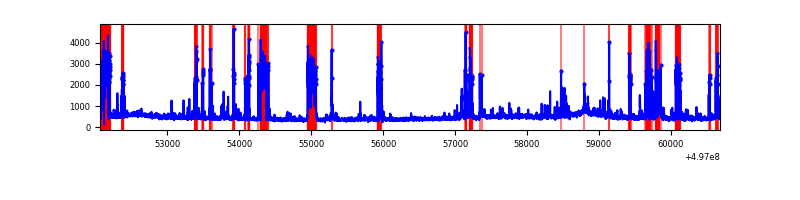 |
| B | 8616 | 8616 | 88 | 88 | 1.02% | 1.02% | 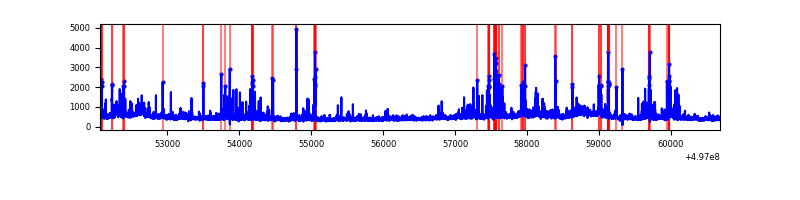 |
| C | 8616 | 8616 | 23 | 23 | 0.27% | 0.27% | 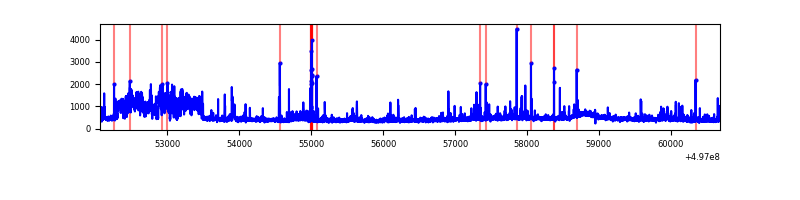 |
| D | 8616 | 8616 | 295 | 295 | 3.42% | 3.42% | 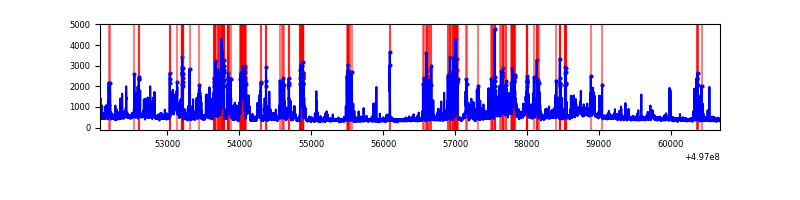 |
Top three noisy pixels from each quadrant. If the there are fewer than three noisy pixels in the level2.evt file, extra rows are filled as -1
| Pixel properties | Quadrant properties | ||||||
|---|---|---|---|---|---|---|---|
| Quadrant | DetID | PixID | Counts | Sigma | Mean | Median | Sigma |
| A | 7 | 29 | 1123619 | 5079.74 | 891 | 869 | 221.0 |
| A | 0 | 8 | 430215 | 1942.52 | 891 | 869 | 221.0 |
| A | 3 | 14 | 123470 | 554.69 | 891 | 869 | 221.0 |
| B | 4 | 171 | 333195 | 1722.09 | 908 | 876 | 193.0 |
| B | 5 | 236 | 178530 | 920.61 | 908 | 876 | 193.0 |
| B | 7 | 0 | 121018 | 622.58 | 908 | 876 | 193.0 |
| C | 9 | 38 | 793001 | 3209.35 | 900 | 891 | 246.8 |
| C | 12 | 2 | 77359 | 309.82 | 900 | 891 | 246.8 |
| C | 14 | 254 | 75554 | 302.51 | 900 | 891 | 246.8 |
| D | 8 | 176 | 983926 | 3951.76 | 884 | 846 | 248.8 |
| D | 3 | 12 | 800574 | 3214.73 | 884 | 846 | 248.8 |
| D | 3 | 176 | 81058 | 322.43 | 884 | 846 | 248.8 |
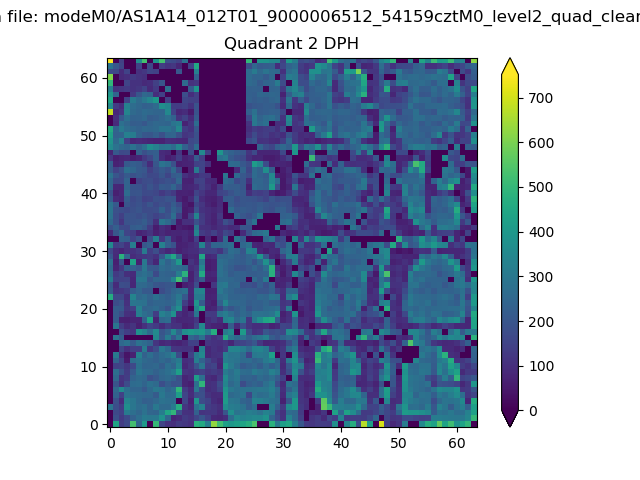
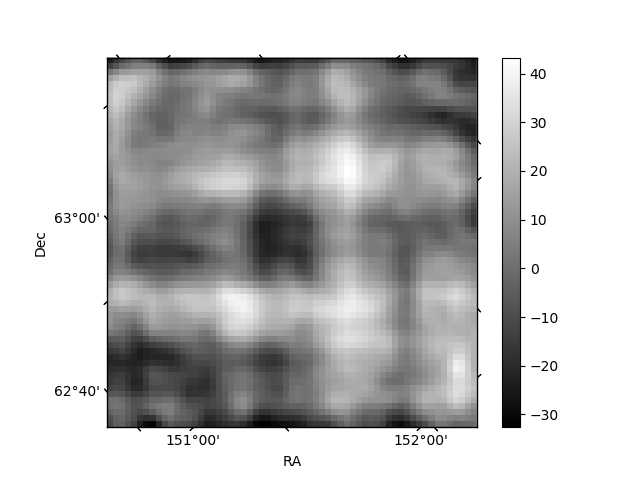
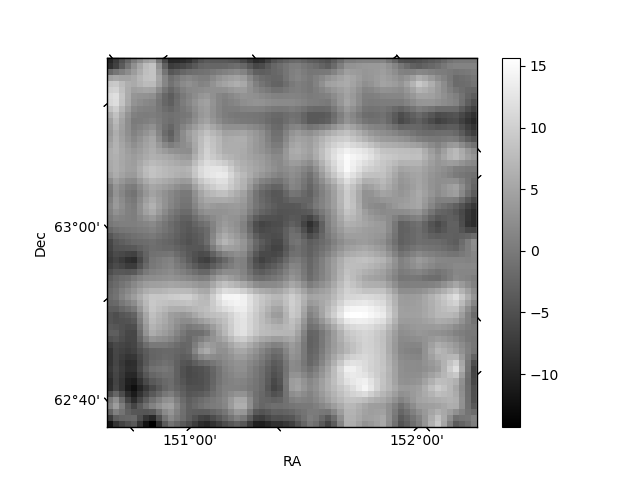
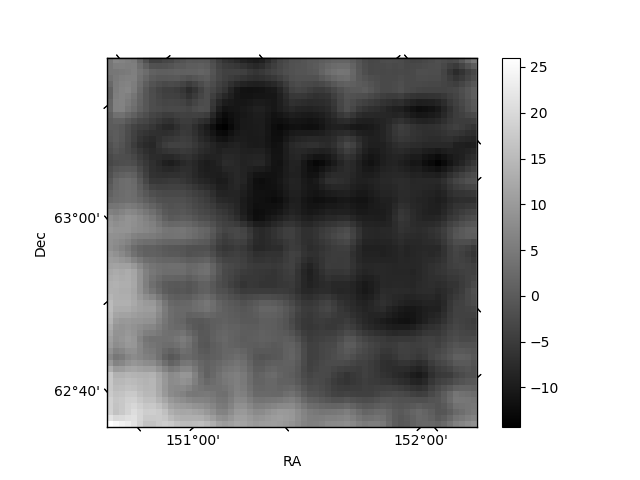
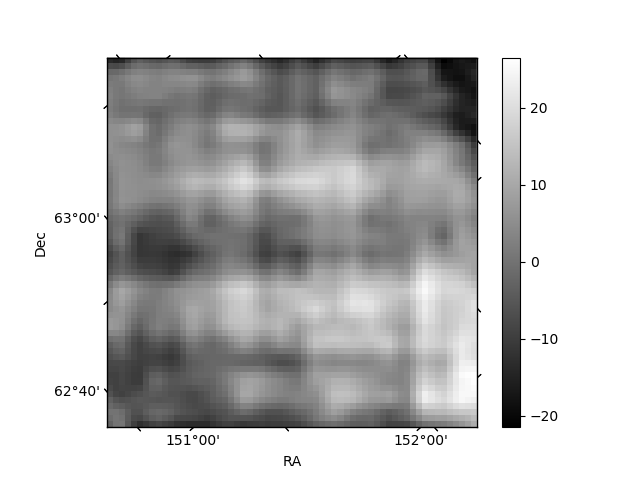
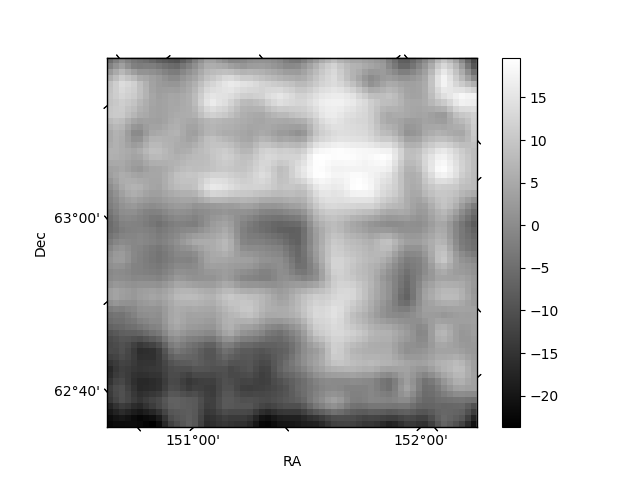
Histogram calculated using DETX and DETY for each event in the final _common_clean file
| Quadrant A | 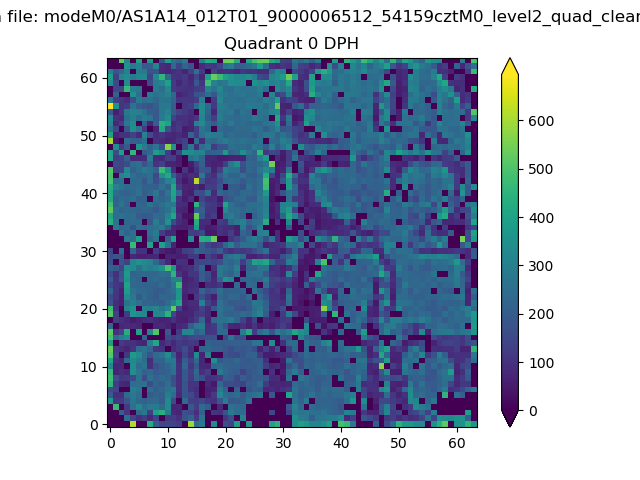 |
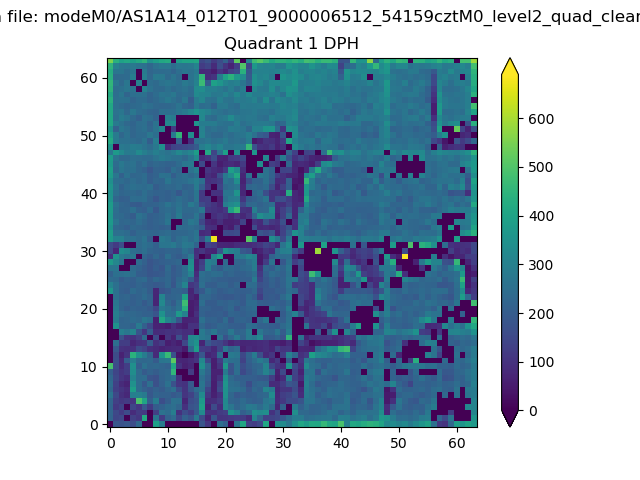 |
Quadrant B |
|---|---|---|---|
| Quadrant D | 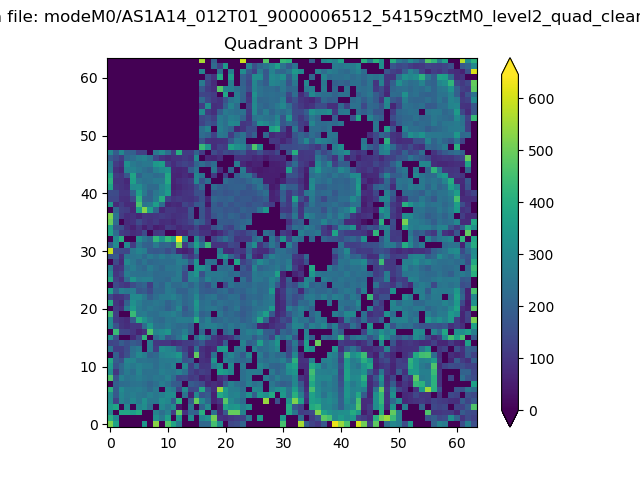 |
 |
Quadrant C |
| Plot type | Count rate plots | Images |
|---|---|---|
| Comparison with Poisson distribution Blue bars denote a histogram of data divided into 1 sec bins. Red curve is a Poisson curve with rate = median count rate of data. |
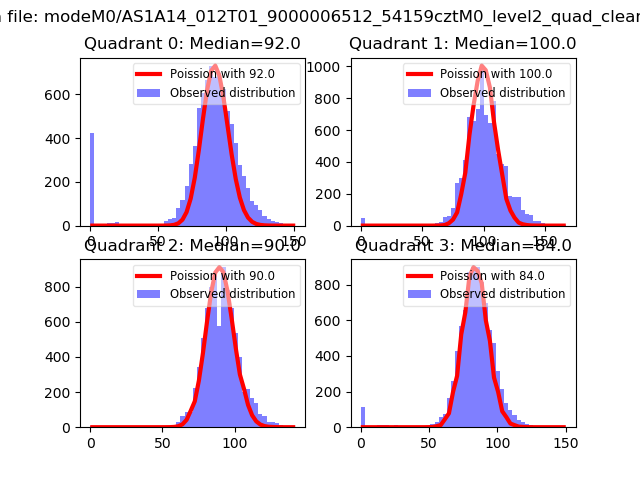 |
 |
| Quadrant-wise count rates Data is divided into 100 sec bins |
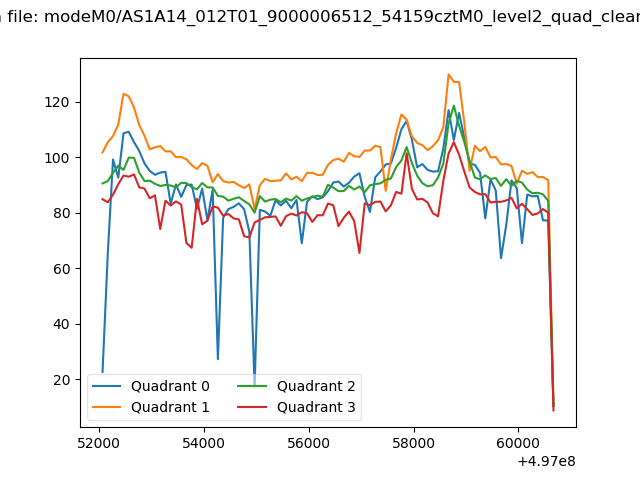 |
|
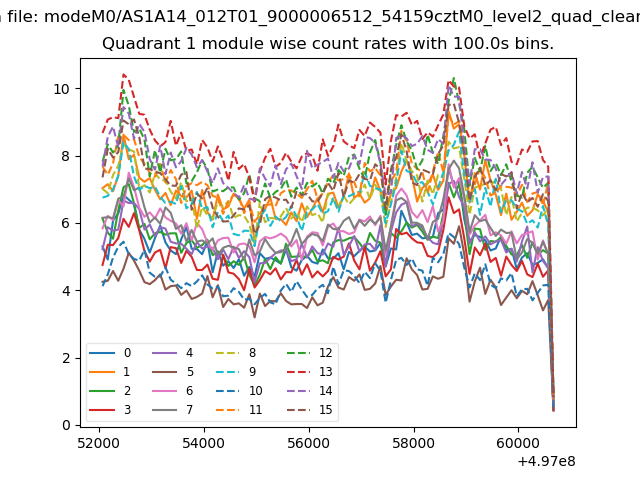
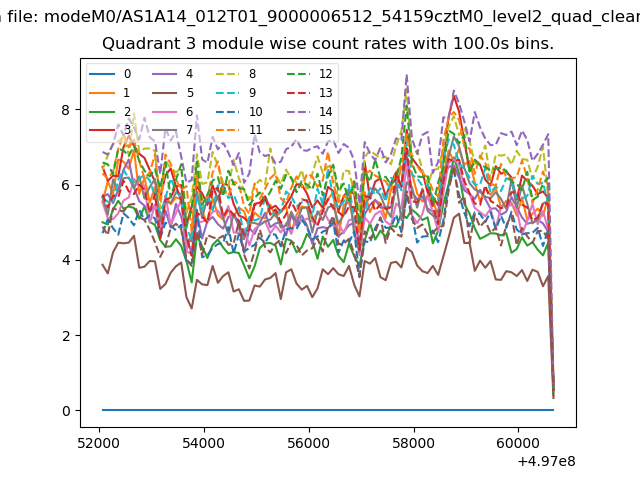
| Module-wise count rates for Quadrant A Data is divided into 100 sec bins |
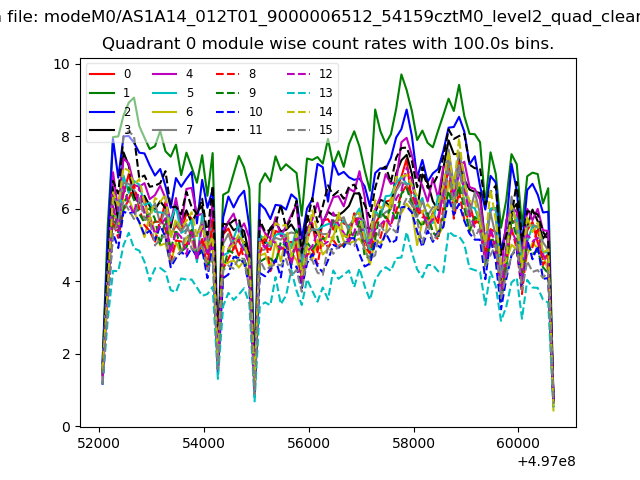 |
 |
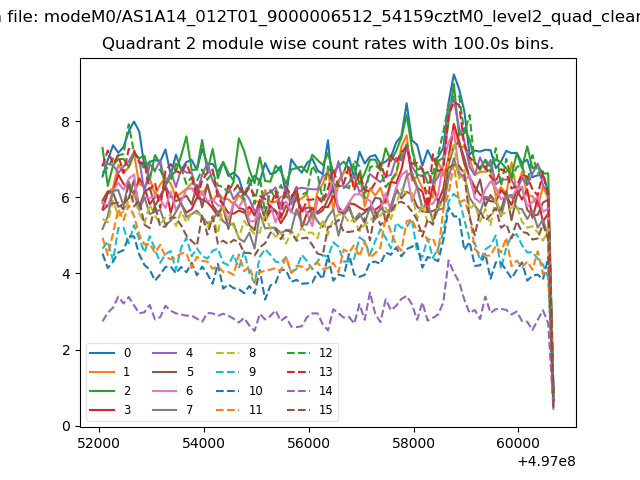
| Module-wise count rates for Quadrant B Data is divided into 100 sec bins |
 |
 |
| Module-wise count rates for Quadrant C Data is divided into 100 sec bins |
 |
 |
| Module-wise count rates for Quadrant D Data is divided into 100 sec bins |
 |
 |
| Parameter | Plot |
|---|---|
| CZT HV Monitor | 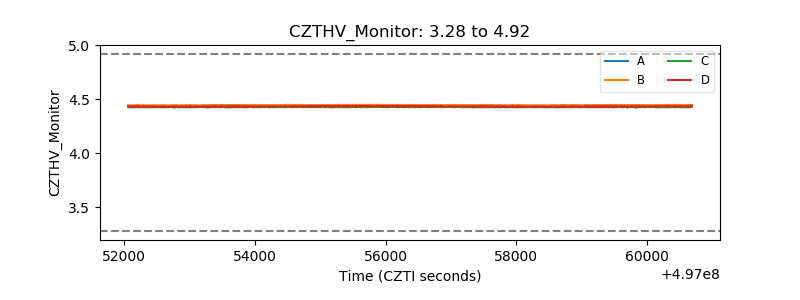 |
| D_VDD | 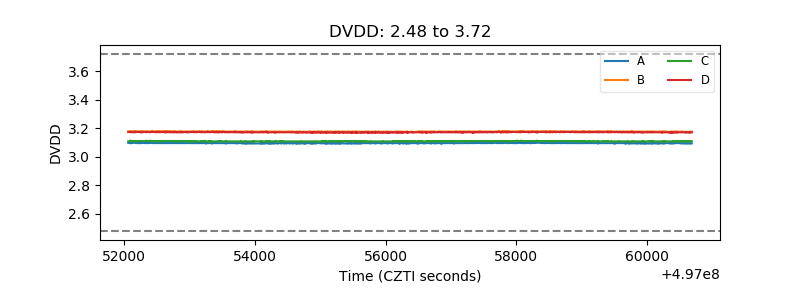 |
| Temperature 1 | 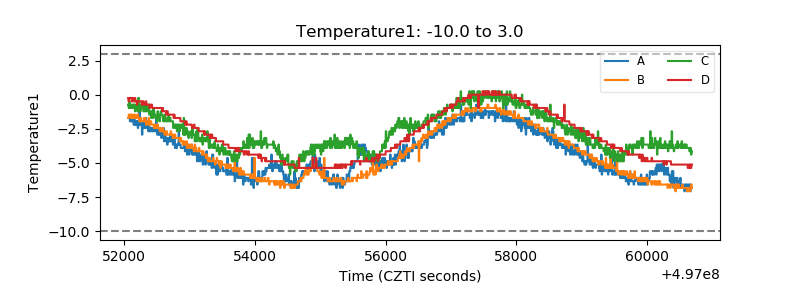 |
| Veto HV Monitor | 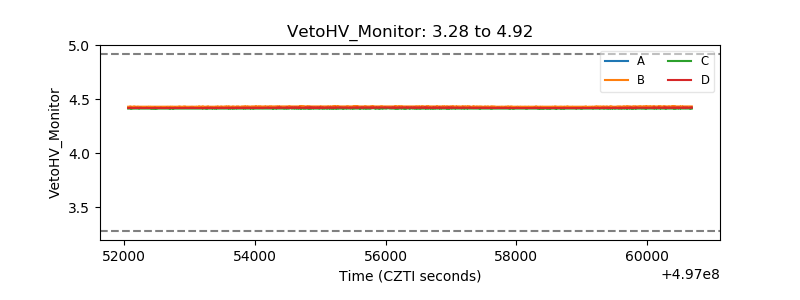 |
| Veto LLD | 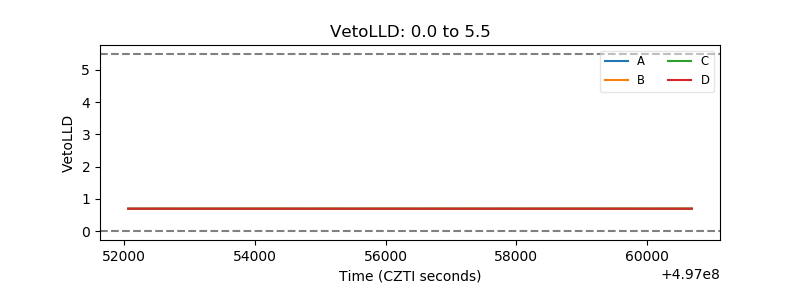 |
| Alpha Counter | 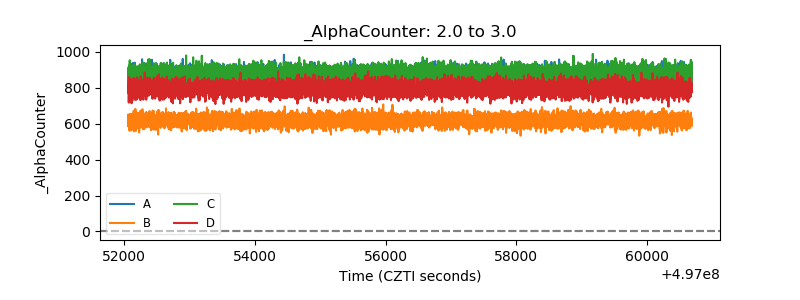 |
| _CPM_Rate | 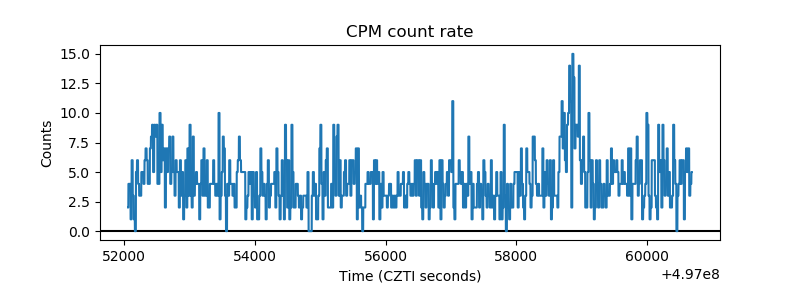 |
| CZT Counter | 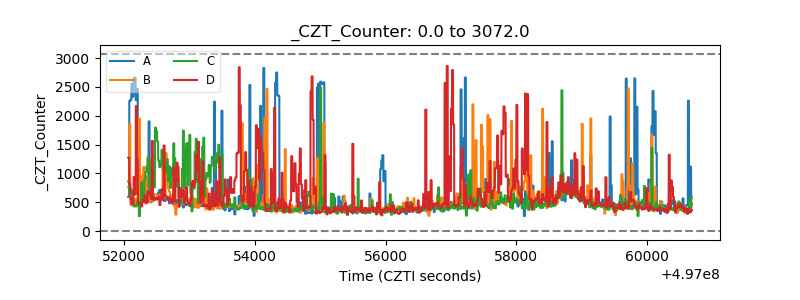 |
| +2.5 Volts monitor |  |
| +5 Volts monitor |  |
| _ROLL_ROT | 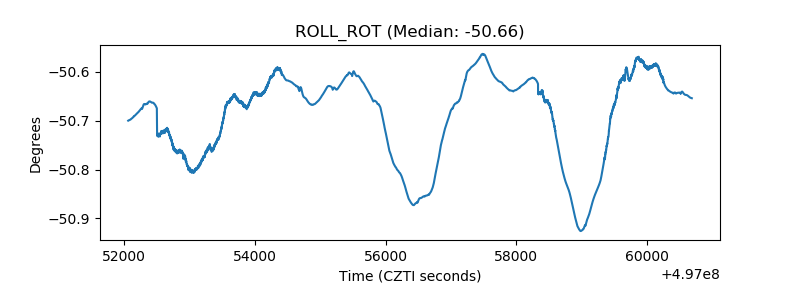 |
| _Roll_DEC | 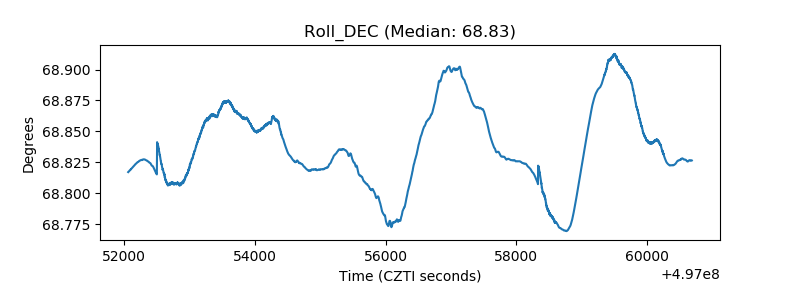 |
| _Roll_RA | 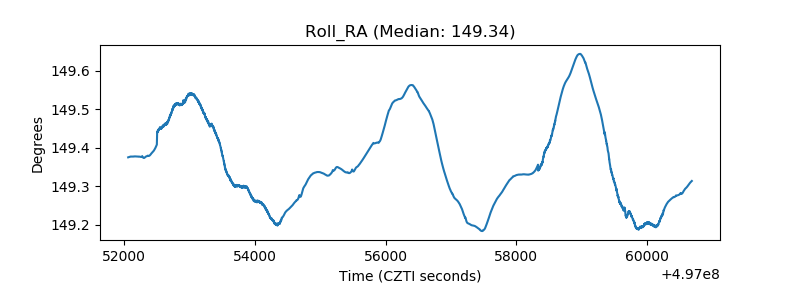 |
| Veto Counter | 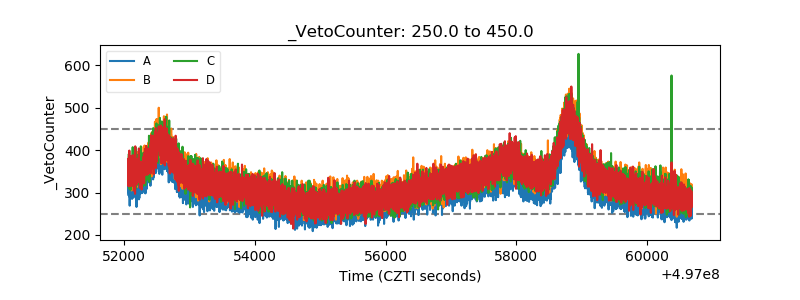 |