| Param | Original file | Final file |
|---|---|---|
| Filename | modeM0/AS1A14_012T01_9000006512_54162cztM0_level2.fits | modeM0/AS1A14_012T01_9000006512_54162cztM0_level2_quad_clean.evt |
| Size (bytes) | 1,454,837,760 | 266,616,000 |
| Size | 1.4 GB | 254.3 MB |
| Events in quadrant A | 12,010,407 | 1,737,145 |
| Events in quadrant B | 16,173,304 | 1,731,622 |
| Events in quadrant C | 9,413,919 | 1,761,686 |
| Events in quadrant D | 14,723,291 | 1,476,711 |
| Mode SS | |||
|---|---|---|---|
| Quadrant | BADHDUFLAG | Total packets | Discarded packets |
| A | 0 | 404 | 0 |
| B | 0 | 404 | 0 |
| C | 0 | 404 | 0 |
| D | 0 | 404 | 0 |
| Mode M0 | |||
|---|---|---|---|
| Quadrant | BADHDUFLAG | Total packets | Discarded packets |
| A | 0 | 49955 | 3 |
| B | 0 | 62174 | 3 |
| C | 0 | 43120 | 3 |
| D | 0 | 57944 | 3 |
| Mode M9 | |||
|---|---|---|---|
| Quadrant | BADHDUFLAG | Total packets | Discarded packets |
| A | 0 | 15 | 0 |
| B | 0 | 15 | 0 |
| C | 0 | 15 | 0 |
| D | 0 | 15 | 0 |
| Quadrant | Total seconds | Saturated seconds | Saturation percentage |
|---|---|---|---|
| A | 19803 | 923 | 4.660910% |
| B | 19803 | 2411 | 12.174923% |
| C | 19803 | 166 | 0.838257% |
| D | 19803 | 1533 | 7.741251% |
Noise dominated data is calculated using 1-second bins in cleaned event files. If a bin has >2000 counts, and if more than 50% of those come from <1% of pixels, then it is considered to be noise-dominated and hence unusable.
| Quadrant | # 1 sec bins | Bins with >0 counts | Bins with >2000 counts | High rate bins dominated by noise | Noise dominated (total time) | Noise dominated (detector-on time) | Marked lightcurve |
|---|---|---|---|---|---|---|---|
| A | 21323 | 19806 | 673 | 673 | 3.16% | 3.40% | 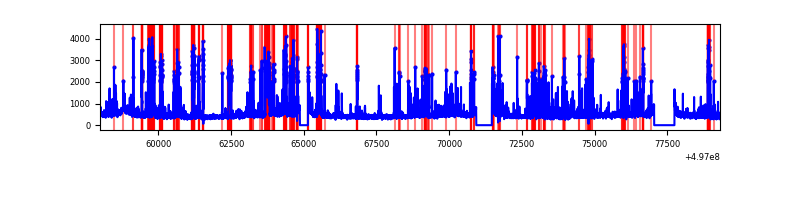 |
| B | 21323 | 19806 | 1395 | 1395 | 6.54% | 7.04% | 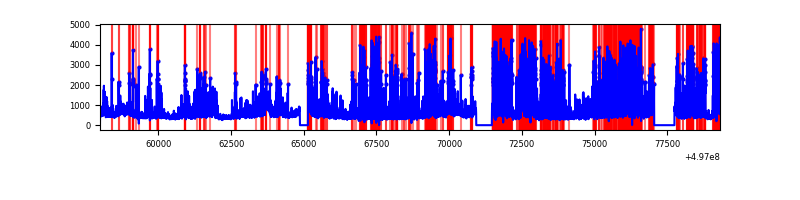 |
| C | 21323 | 19806 | 119 | 119 | 0.56% | 0.60% | 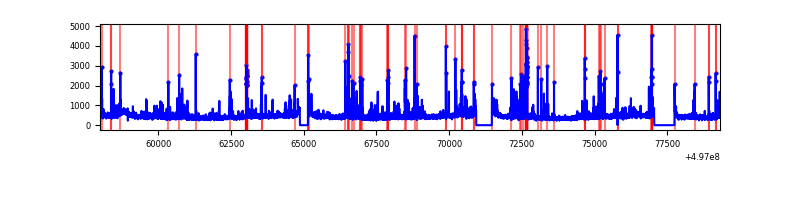 |
| D | 21323 | 19806 | 1357 | 1357 | 6.36% | 6.85% | 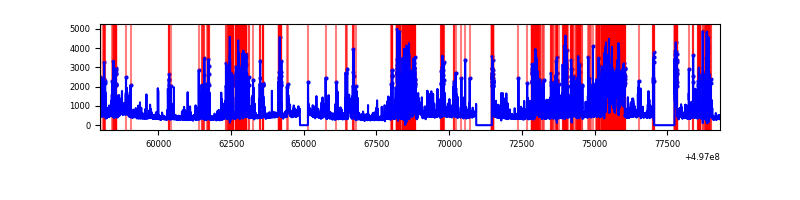 |
Top three noisy pixels from each quadrant. If the there are fewer than three noisy pixels in the level2.evt file, extra rows are filled as -1
| Pixel properties | Quadrant properties | ||||||
|---|---|---|---|---|---|---|---|
| Quadrant | DetID | PixID | Counts | Sigma | Mean | Median | Sigma |
| A | 7 | 29 | 1297427 | 2564.94 | 2048 | 1997 | 505.1 |
| A | 15 | 174 | 1055541 | 2086.01 | 2048 | 1997 | 505.1 |
| A | 0 | 8 | 520790 | 1027.21 | 2048 | 1997 | 505.1 |
| B | 6 | 255 | 5628927 | 13479.36 | 1971 | 1900 | 417.5 |
| B | 1 | 255 | 550058 | 1313.09 | 1971 | 1900 | 417.5 |
| B | 5 | 236 | 511682 | 1221.17 | 1971 | 1900 | 417.5 |
| C | 14 | 254 | 393874 | 701.14 | 2034 | 2013 | 558.9 |
| C | 0 | 209 | 185524 | 328.35 | 2034 | 2013 | 558.9 |
| C | 4 | 5 | 157095 | 277.48 | 2034 | 2013 | 558.9 |
| D | 8 | 176 | 3172439 | 5661.62 | 1957 | 1868 | 560.0 |
| D | 10 | 181 | 1464319 | 2611.47 | 1957 | 1868 | 560.0 |
| D | 3 | 12 | 537278 | 956.07 | 1957 | 1868 | 560.0 |
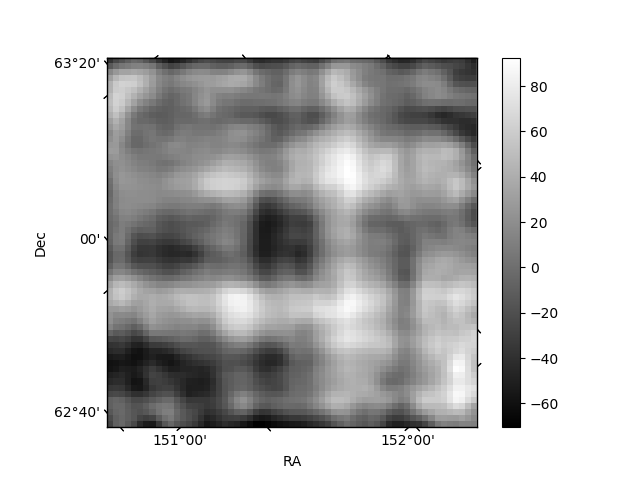
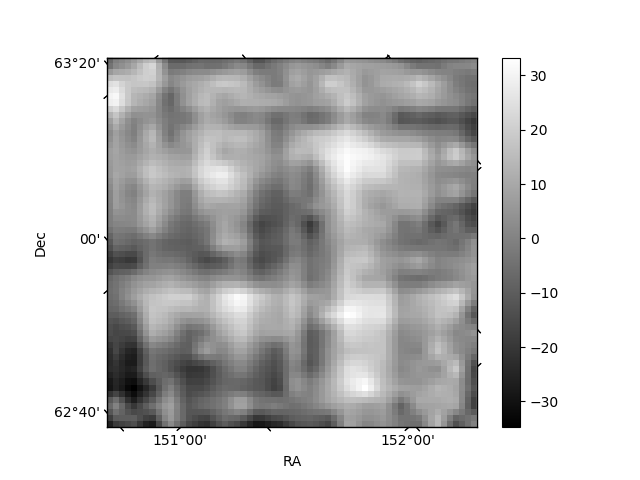
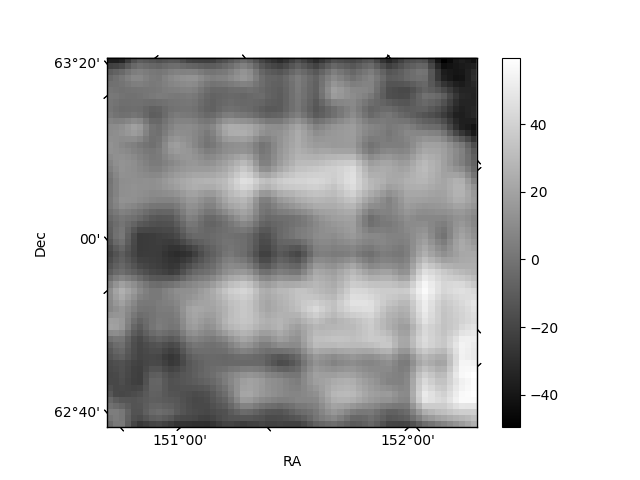
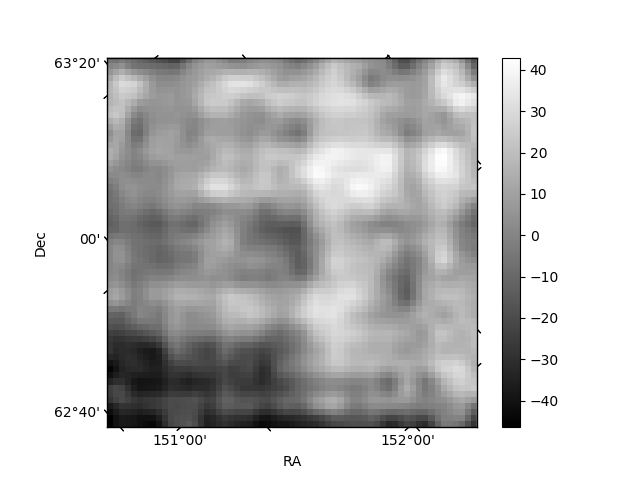
Histogram calculated using DETX and DETY for each event in the final _common_clean file
| Quadrant A | 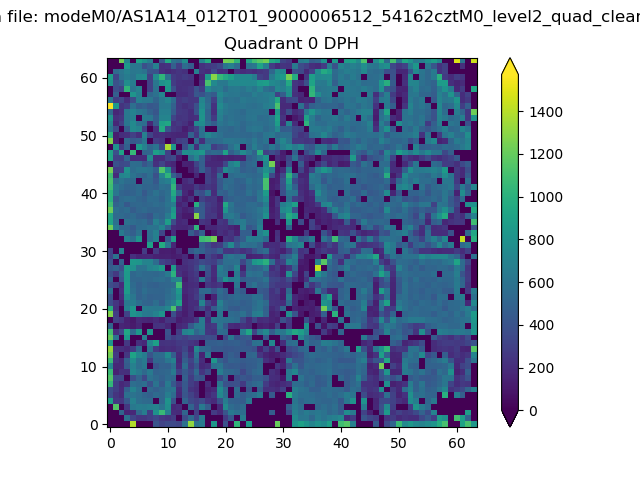 |
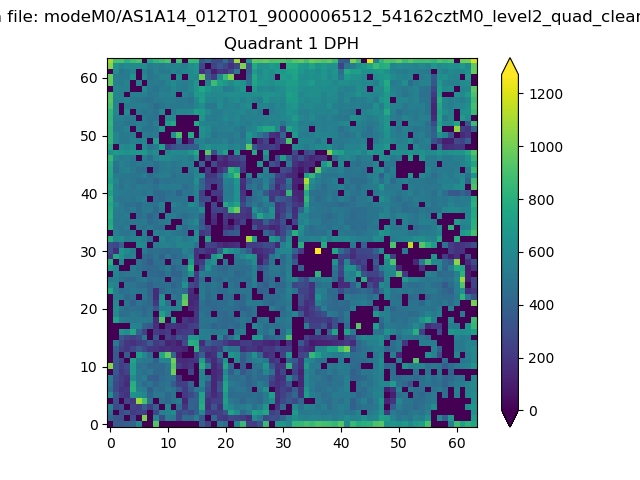 |
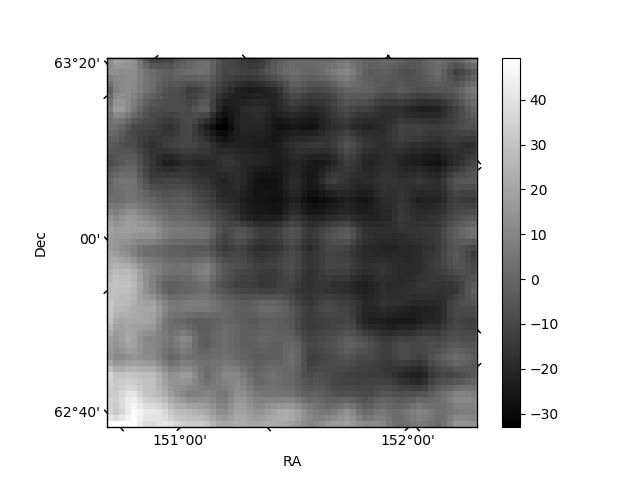
Quadrant B |
|---|---|---|---|
| Quadrant D | 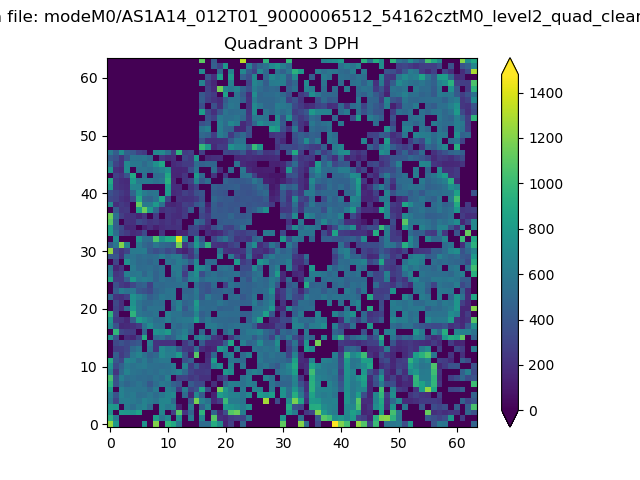 |
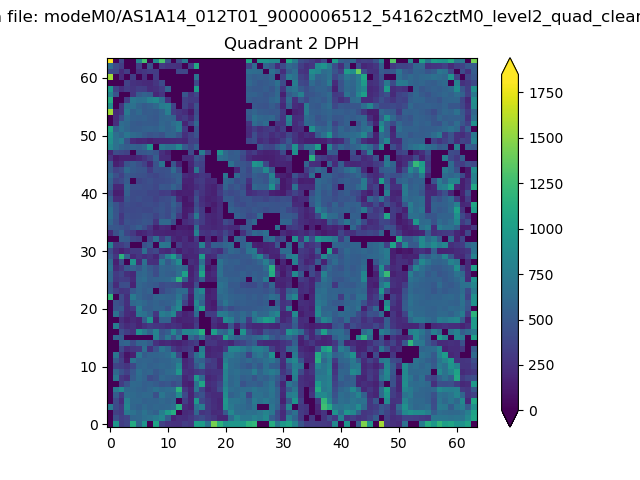 |
Quadrant C |
| Plot type | Count rate plots | Images |
|---|---|---|
| Comparison with Poisson distribution Blue bars denote a histogram of data divided into 1 sec bins. Red curve is a Poisson curve with rate = median count rate of data. |
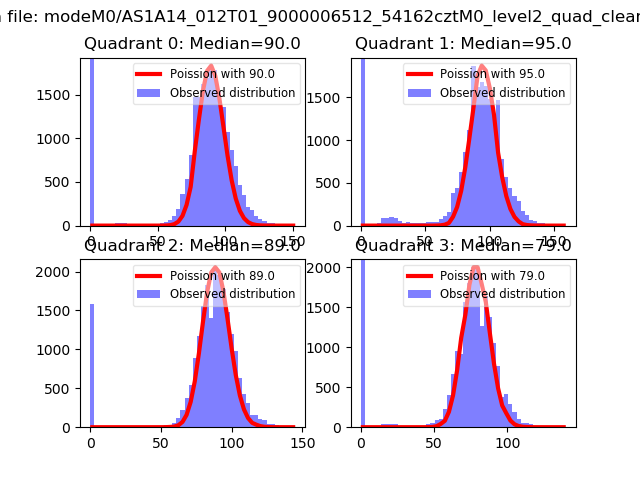 |
 |
| Quadrant-wise count rates Data is divided into 100 sec bins |
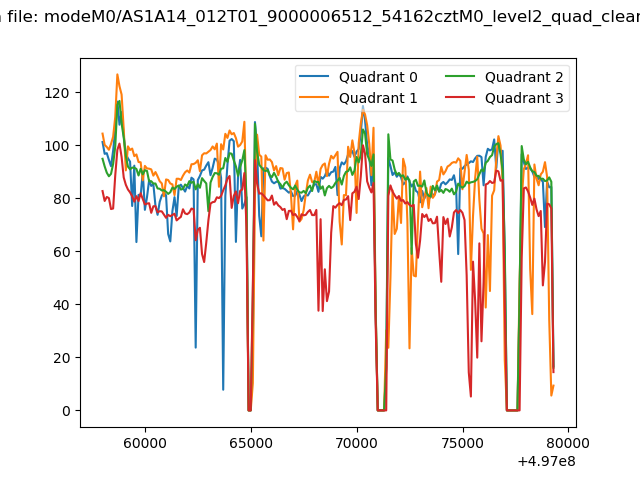 |
|
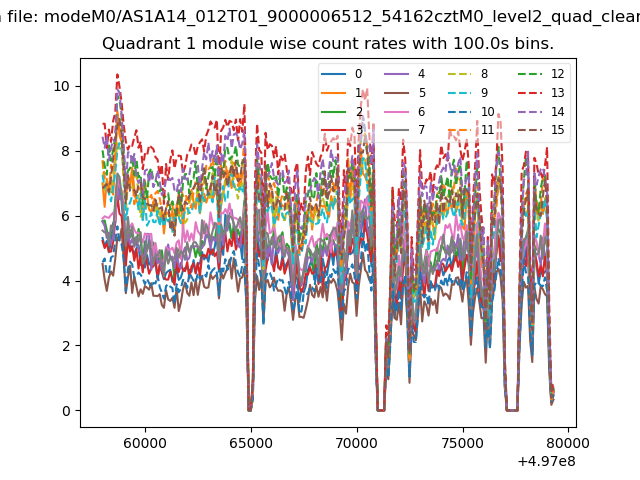
| Module-wise count rates for Quadrant A Data is divided into 100 sec bins |
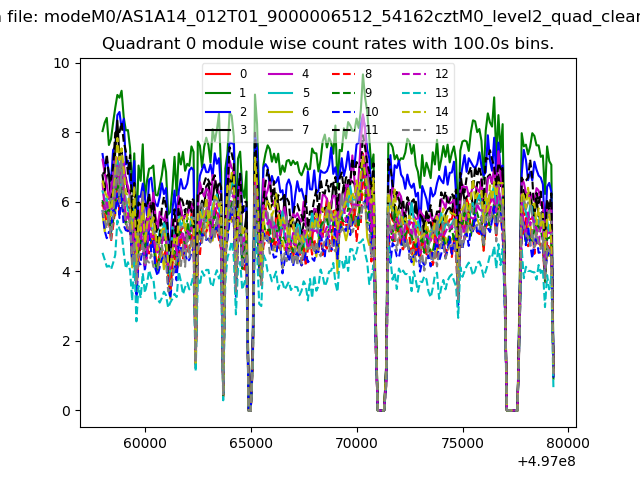 |
 |
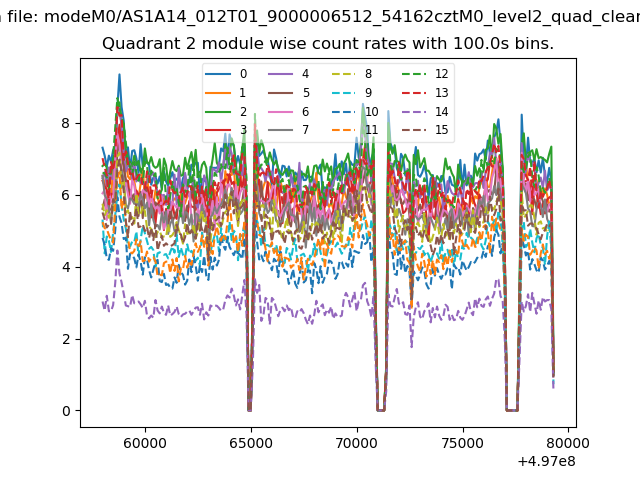
| Module-wise count rates for Quadrant B Data is divided into 100 sec bins |
 |
 |
| Module-wise count rates for Quadrant C Data is divided into 100 sec bins |
 |
 |
| Module-wise count rates for Quadrant D Data is divided into 100 sec bins |
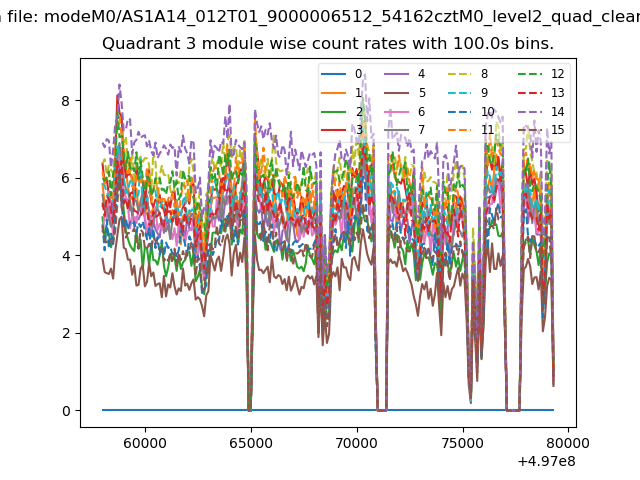 |
 |
| Parameter | Plot |
|---|---|
| CZT HV Monitor |  |
| D_VDD | 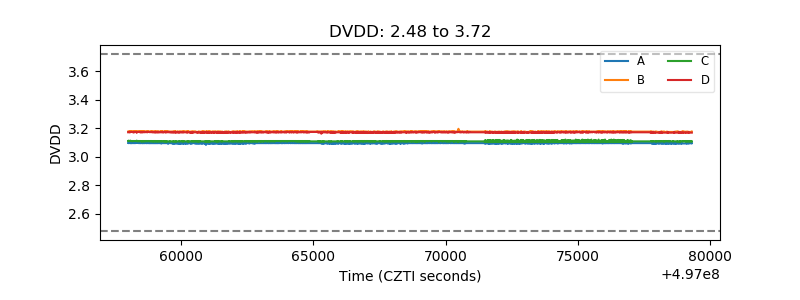 |
| Temperature 1 | 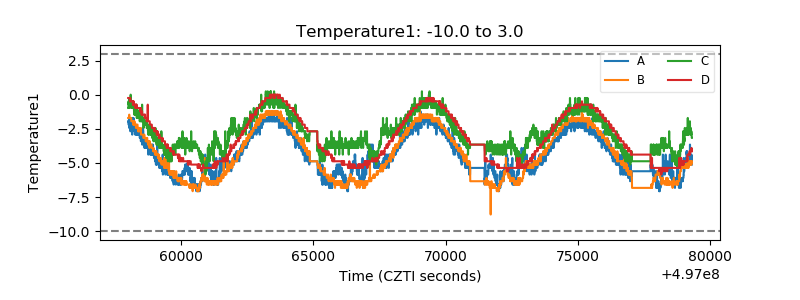 |
| Veto HV Monitor | 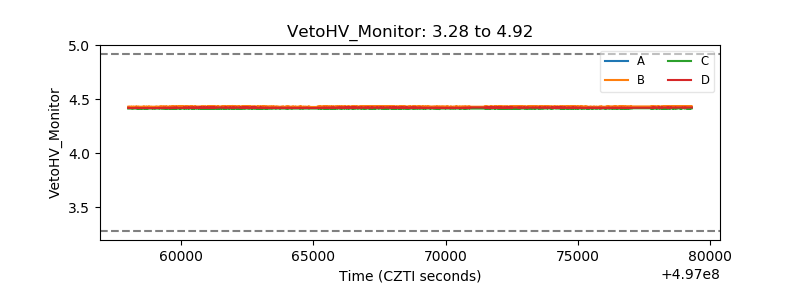 |
| Veto LLD | 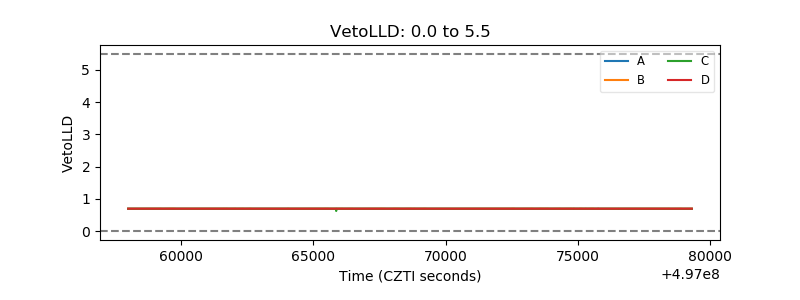 |
| Alpha Counter | 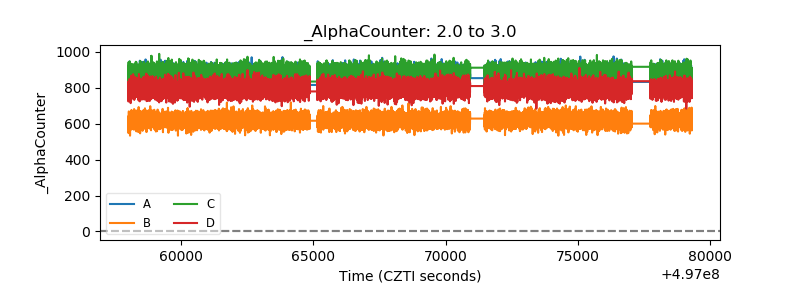 |
| _CPM_Rate | 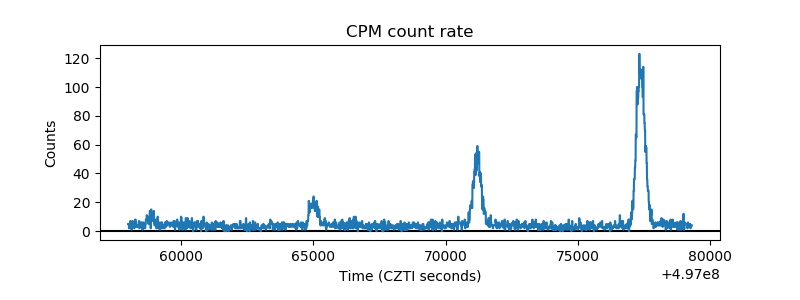 |
| CZT Counter | 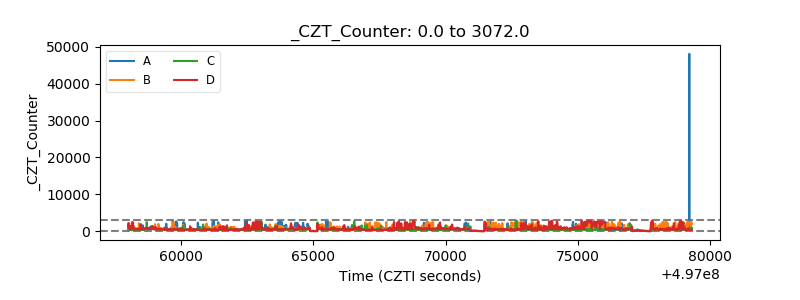 |
| +2.5 Volts monitor | 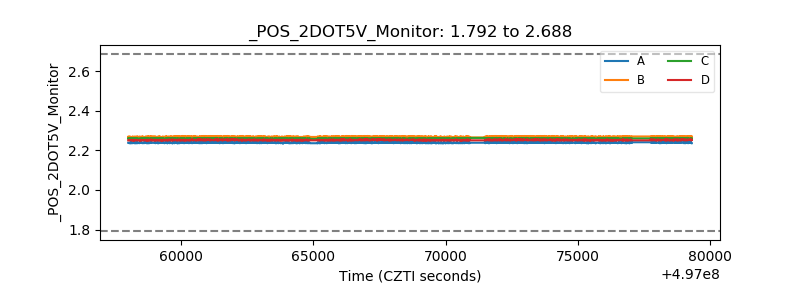 |
| +5 Volts monitor | 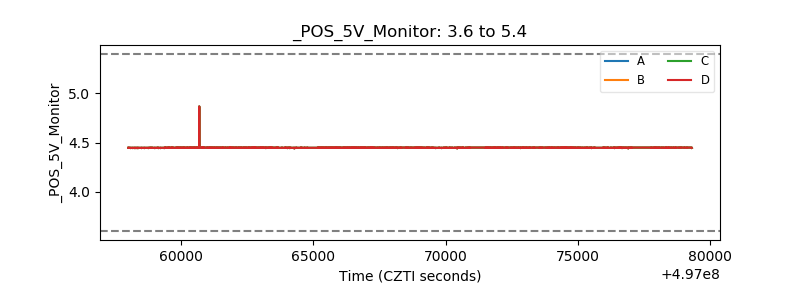 |
| _ROLL_ROT | 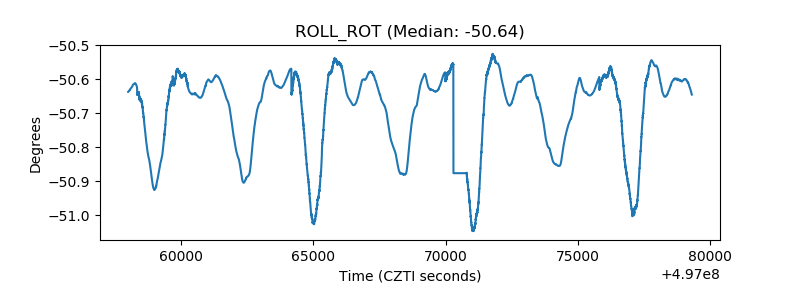 |
| _Roll_DEC | 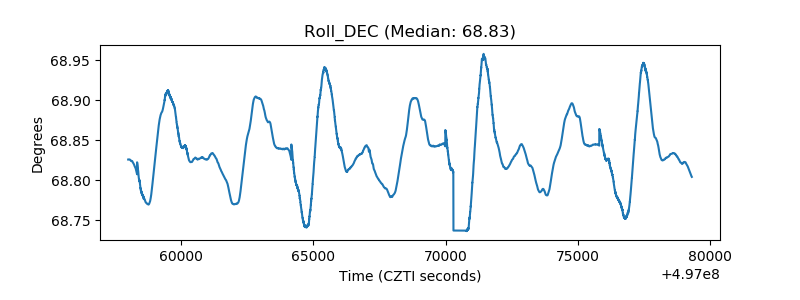 |
| _Roll_RA | 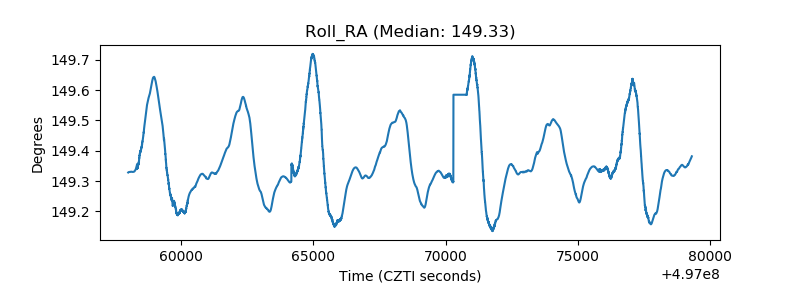 |
| Veto Counter | 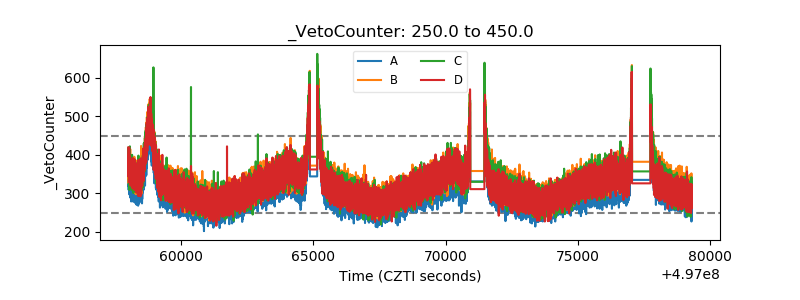 |