| Param | Original file | Final file |
|---|---|---|
| Filename | modeM0/AS1A14_012T01_9000006512_54163cztM0_level2.fits | modeM0/AS1A14_012T01_9000006512_54163cztM0_level2_quad_clean.evt |
| Size (bytes) | 560,701,440 | 99,239,040 |
| Size | 534.7 MB | 94.6 MB |
| Events in quadrant A | 3,916,126 | 686,050 |
| Events in quadrant B | 8,301,784 | 534,861 |
| Events in quadrant C | 3,320,574 | 676,200 |
| Events in quadrant D | 4,684,286 | 630,551 |
| Mode SS | |||
|---|---|---|---|
| Quadrant | BADHDUFLAG | Total packets | Discarded packets |
| A | 0 | 138 | 0 |
| B | 0 | 138 | 0 |
| C | 0 | 138 | 0 |
| D | 0 | 138 | 0 |
| Mode M0 | |||
|---|---|---|---|
| Quadrant | BADHDUFLAG | Total packets | Discarded packets |
| A | 0 | 16584 | 2 |
| B | 0 | 29354 | 2 |
| C | 0 | 15038 | 2 |
| D | 0 | 18831 | 2 |
| Mode M9 | |||
|---|---|---|---|
| Quadrant | BADHDUFLAG | Total packets | Discarded packets |
| A | 0 | 9 | 0 |
| B | 0 | 9 | 0 |
| C | 0 | 9 | 0 |
| D | 0 | 9 | 0 |
| Quadrant | Total seconds | Saturated seconds | Saturation percentage |
|---|---|---|---|
| A | 6850 | 208 | 3.036496% |
| B | 6851 | 2194 | 32.024522% |
| C | 6851 | 47 | 0.686031% |
| D | 6850 | 288 | 4.204380% |
Noise dominated data is calculated using 1-second bins in cleaned event files. If a bin has >2000 counts, and if more than 50% of those come from <1% of pixels, then it is considered to be noise-dominated and hence unusable.
| Quadrant | # 1 sec bins | Bins with >0 counts | Bins with >2000 counts | High rate bins dominated by noise | Noise dominated (total time) | Noise dominated (detector-on time) | Marked lightcurve |
|---|---|---|---|---|---|---|---|
| A | 7700 | 6851 | 135 | 135 | 1.75% | 1.97% | 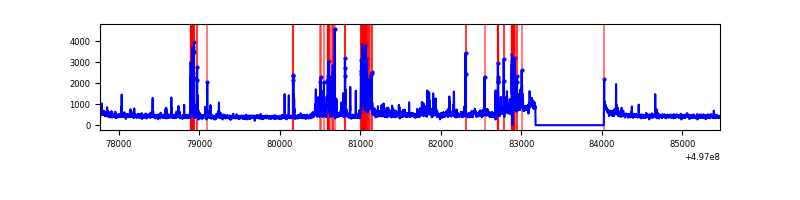 |
| B | 7701 | 6849 | 1482 | 1482 | 19.24% | 21.64% | 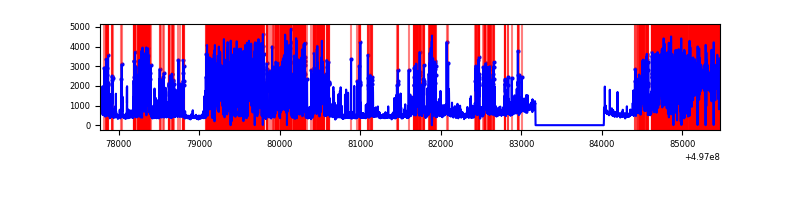 |
| C | 7701 | 6852 | 16 | 16 | 0.21% | 0.23% | 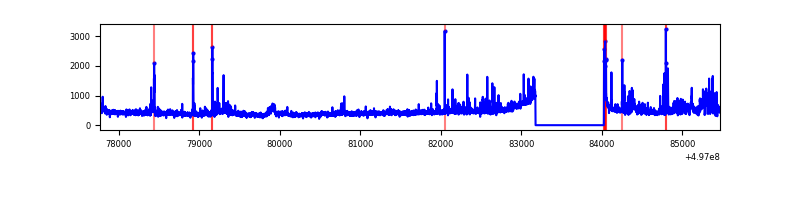 |
| D | 7700 | 6851 | 234 | 234 | 3.04% | 3.42% | 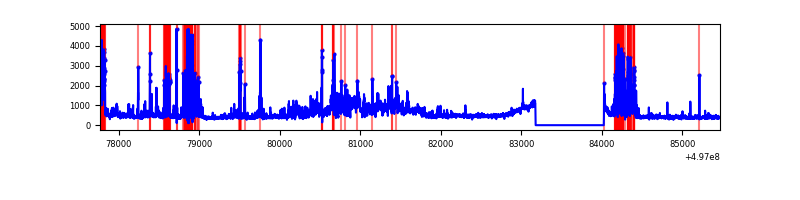 |
Top three noisy pixels from each quadrant. If the there are fewer than three noisy pixels in the level2.evt file, extra rows are filled as -1
| Pixel properties | Quadrant properties | ||||||
|---|---|---|---|---|---|---|---|
| Quadrant | DetID | PixID | Counts | Sigma | Mean | Median | Sigma |
| A | 7 | 29 | 463024 | 2498.53 | 733 | 714 | 185.0 |
| A | 15 | 174 | 204634 | 1102.07 | 733 | 714 | 185.0 |
| A | 3 | 14 | 142933 | 768.61 | 733 | 714 | 185.0 |
| B | 6 | 255 | 4735550 | 35713.7 | 612 | 592 | 132.6 |
| B | 5 | 172 | 397956 | 2997.14 | 612 | 592 | 132.6 |
| B | 15 | 20 | 155454 | 1168.06 | 612 | 592 | 132.6 |
| C | 9 | 38 | 320373 | 1573.23 | 713 | 704 | 203.2 |
| C | 14 | 254 | 59443 | 289.08 | 713 | 704 | 203.2 |
| C | 0 | 224 | 25410 | 121.59 | 713 | 704 | 203.2 |
| D | 8 | 176 | 936714 | 4505.61 | 710 | 677 | 207.7 |
| D | 13 | 84 | 579740 | 2787.32 | 710 | 677 | 207.7 |
| D | 10 | 181 | 208106 | 998.46 | 710 | 677 | 207.7 |
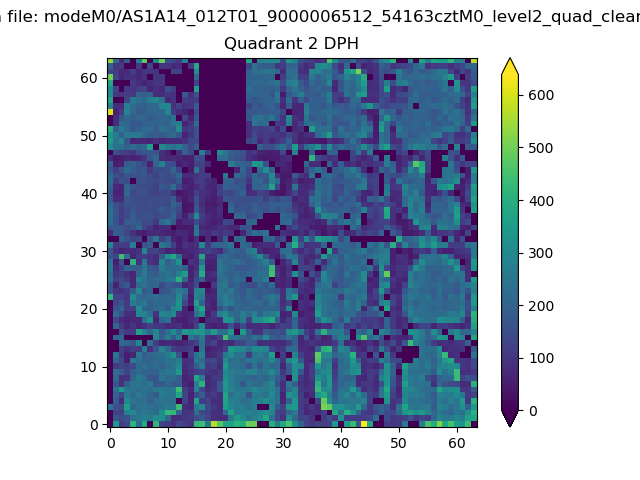
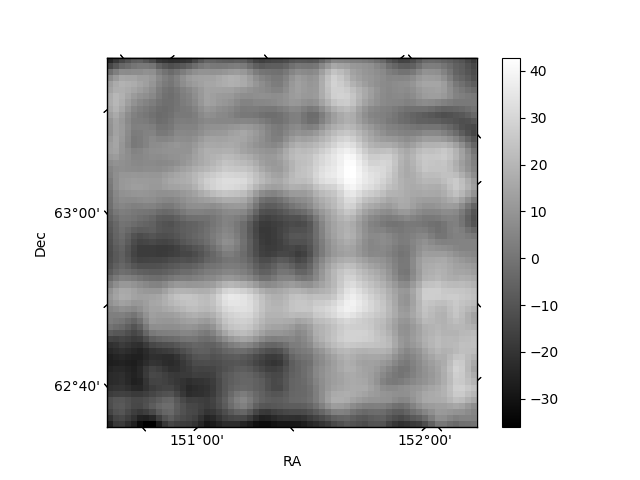
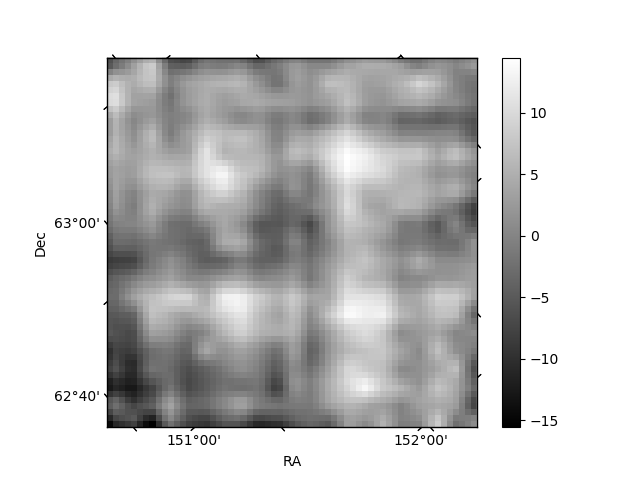
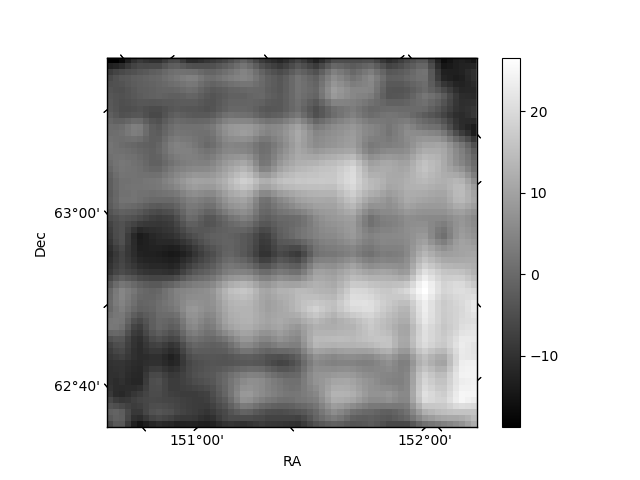
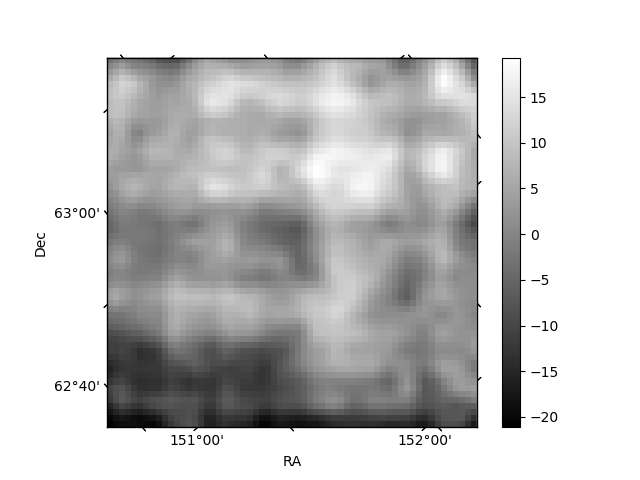
Histogram calculated using DETX and DETY for each event in the final _common_clean file
| Quadrant A | 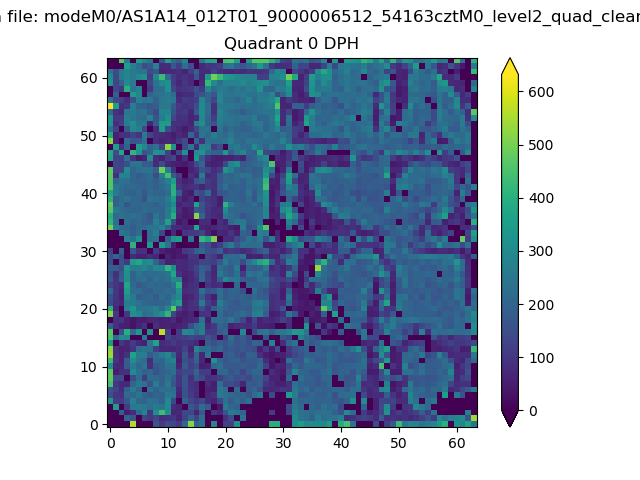 |
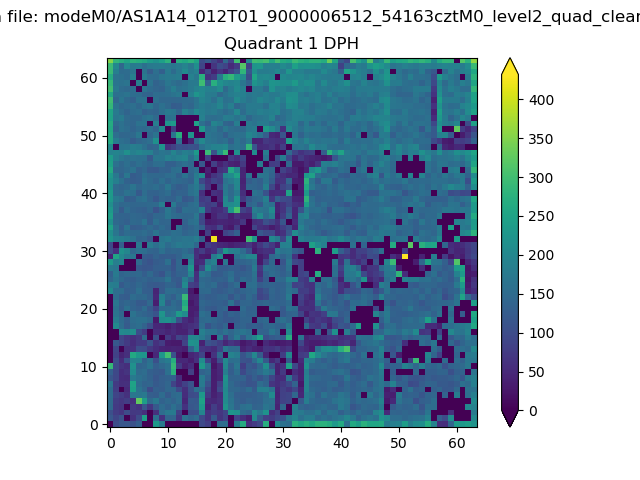 |
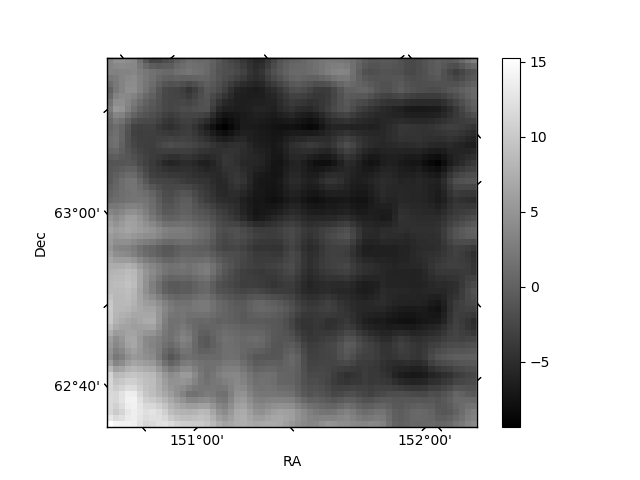
Quadrant B |
|---|---|---|---|
| Quadrant D | 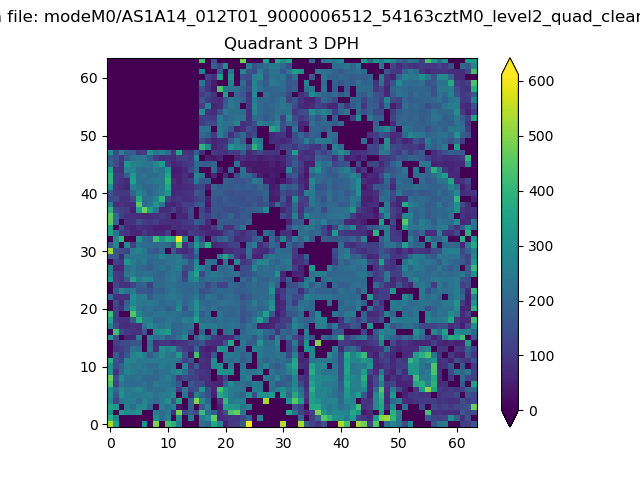 |
 |
Quadrant C |
| Plot type | Count rate plots | Images |
|---|---|---|
| Comparison with Poisson distribution Blue bars denote a histogram of data divided into 1 sec bins. Red curve is a Poisson curve with rate = median count rate of data. |
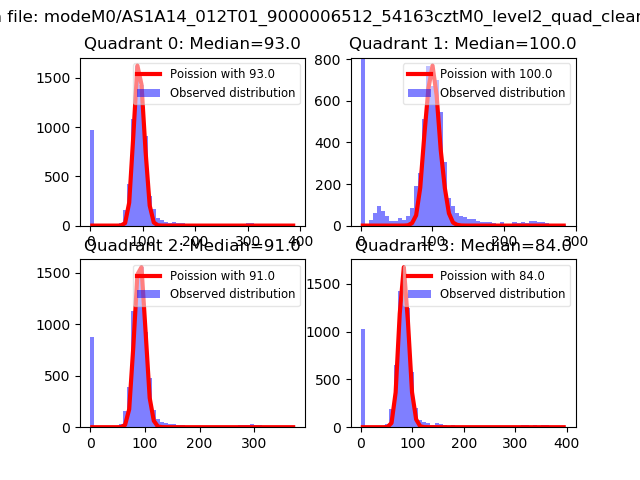 |
 |
| Quadrant-wise count rates Data is divided into 100 sec bins |
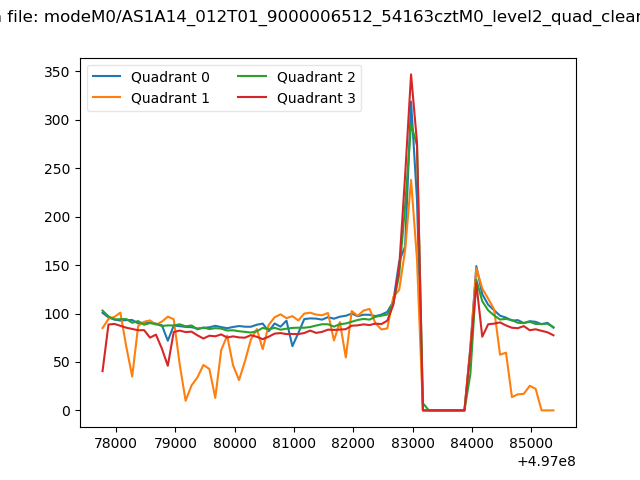 |
|
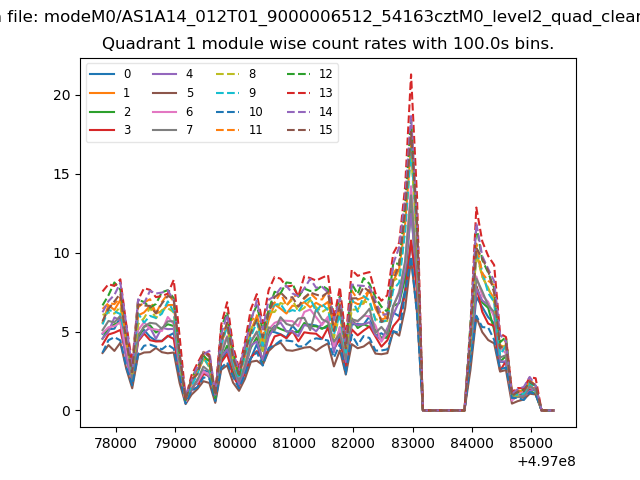
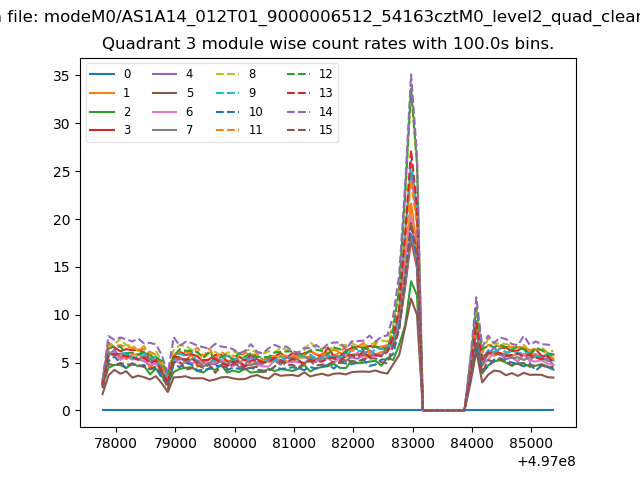
| Module-wise count rates for Quadrant A Data is divided into 100 sec bins |
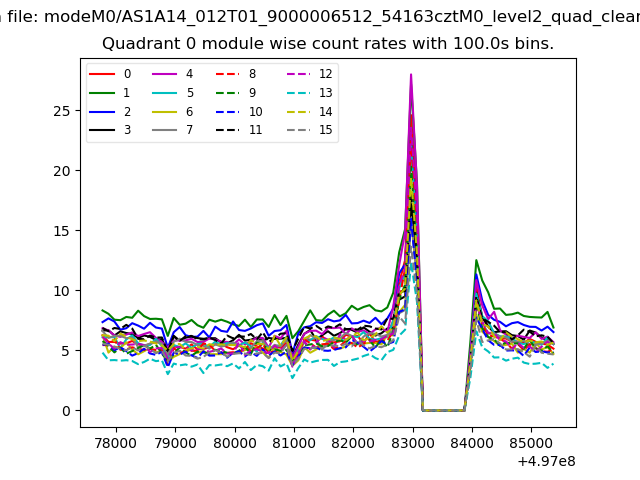 |
 |
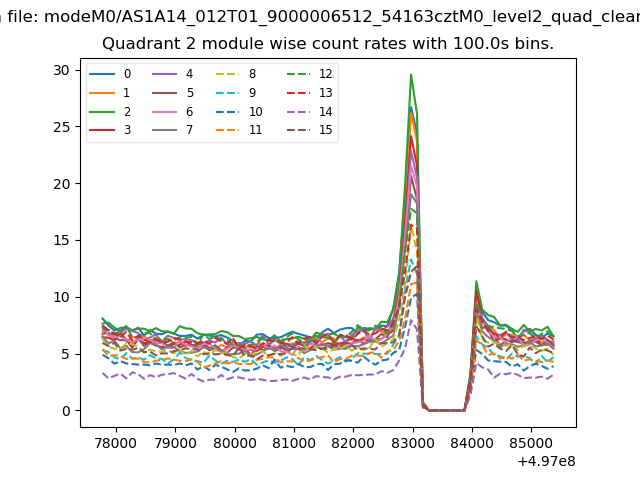
| Module-wise count rates for Quadrant B Data is divided into 100 sec bins |
 |
 |
| Module-wise count rates for Quadrant C Data is divided into 100 sec bins |
 |
 |
| Module-wise count rates for Quadrant D Data is divided into 100 sec bins |
 |
 |
| Parameter | Plot |
|---|---|
| CZT HV Monitor | 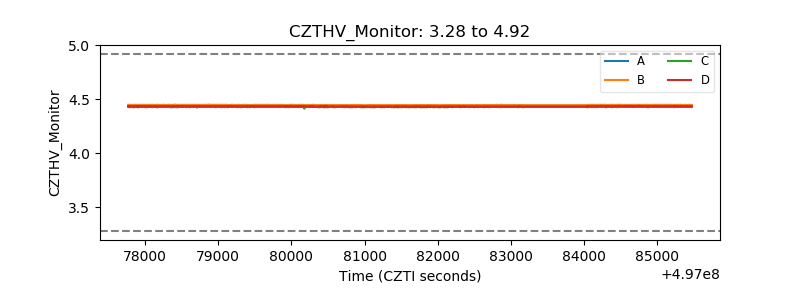 |
| D_VDD | 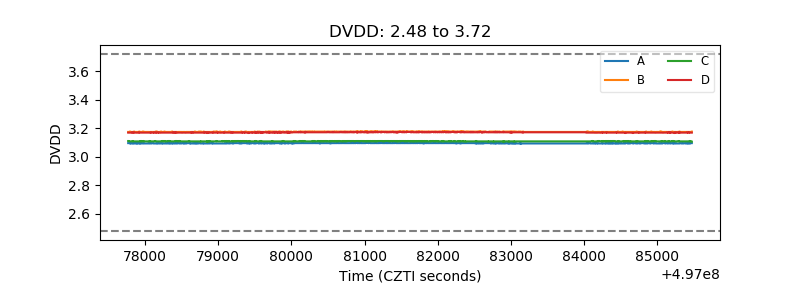 |
| Temperature 1 | 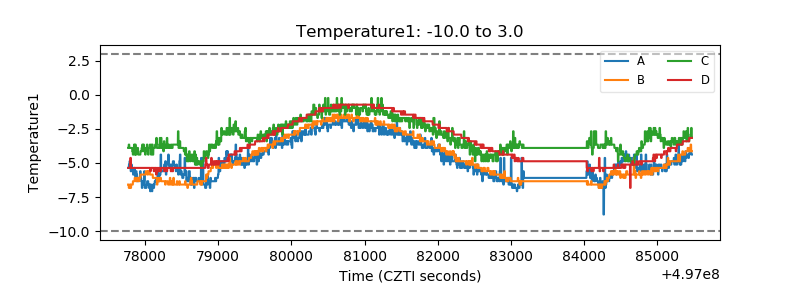 |
| Veto HV Monitor | 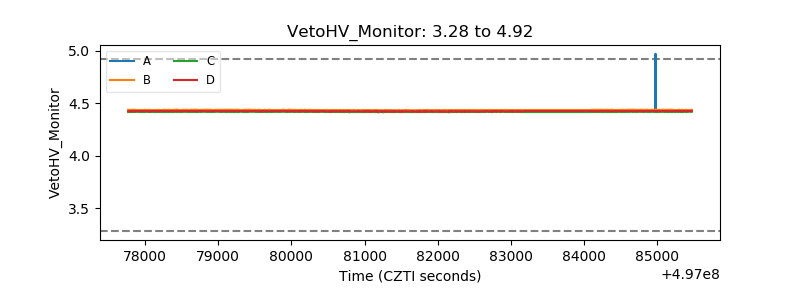 |
| Veto LLD | 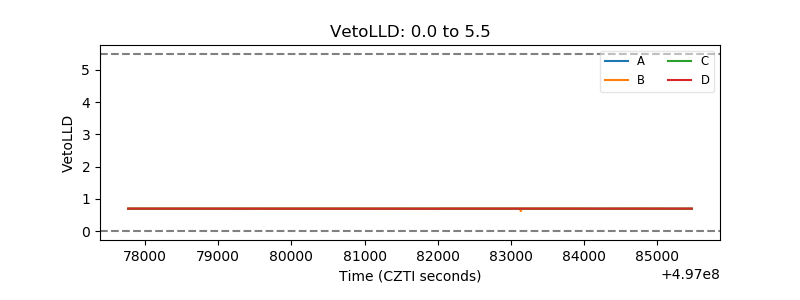 |
| Alpha Counter | 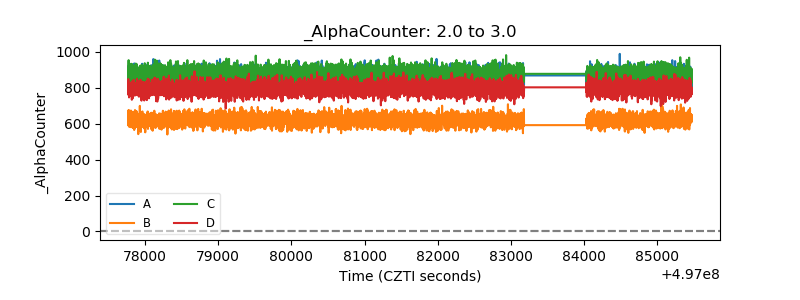 |
| _CPM_Rate | 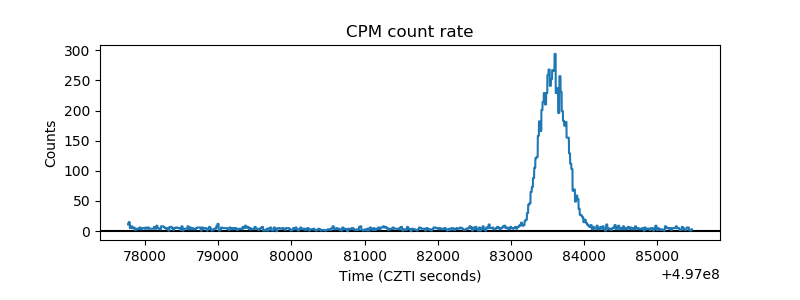 |
| CZT Counter | 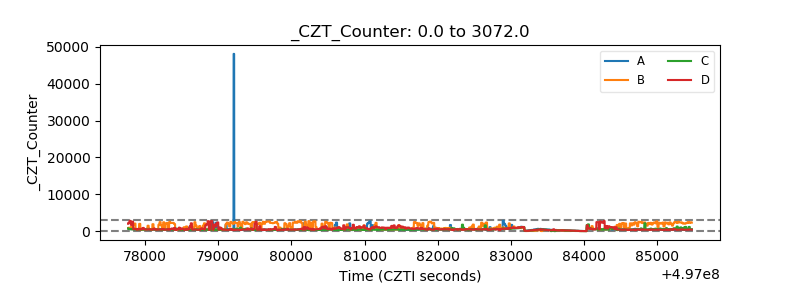 |
| +2.5 Volts monitor |  |
| +5 Volts monitor |  |
| _ROLL_ROT | 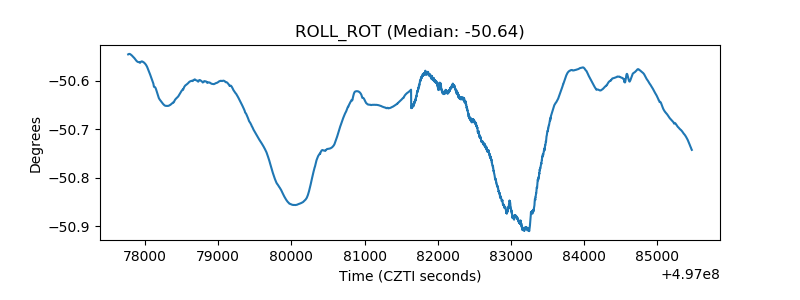 |
| _Roll_DEC | 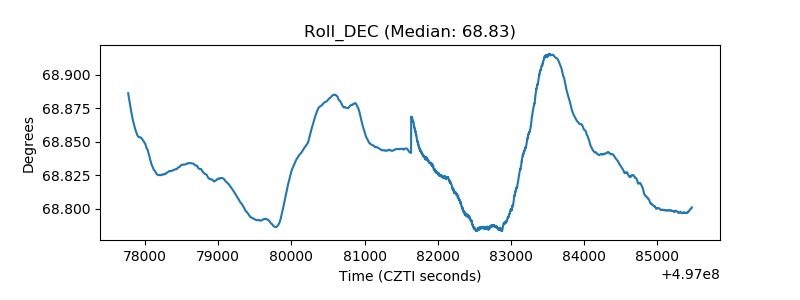 |
| _Roll_RA |  |
| Veto Counter | 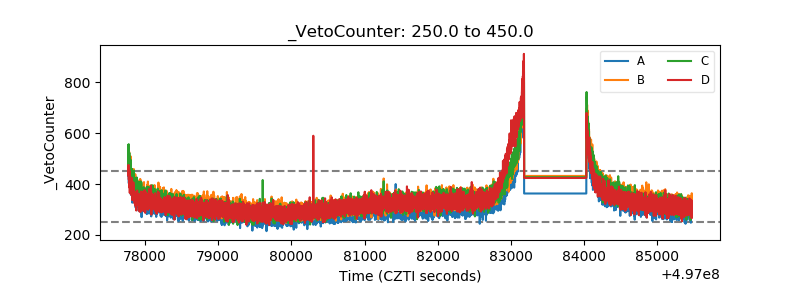 |