| Param | Original file | Final file |
|---|---|---|
| Filename | modeM0/AS1A14_012T01_9000006512_54166cztM0_level2.fits | modeM0/AS1A14_012T01_9000006512_54166cztM0_level2_quad_clean.evt |
| Size (bytes) | 653,590,080 | 81,835,200 |
| Size | 623.3 MB | 78.0 MB |
| Events in quadrant A | 3,328,982 | 618,241 |
| Events in quadrant B | 7,866,905 | 472,759 |
| Events in quadrant C | 3,307,486 | 590,075 |
| Events in quadrant D | 9,197,308 | 353,751 |
| Mode SS | |||
|---|---|---|---|
| Quadrant | BADHDUFLAG | Total packets | Discarded packets |
| A | 0 | 128 | 0 |
| B | 0 | 128 | 0 |
| C | 0 | 128 | 0 |
| D | 0 | 128 | 0 |
| Mode M0 | |||
|---|---|---|---|
| Quadrant | BADHDUFLAG | Total packets | Discarded packets |
| A | 0 | 14324 | 1 |
| B | 0 | 27717 | 1 |
| C | 0 | 14514 | 1 |
| D | 0 | 31699 | 1 |
| Mode M9 | |||
|---|---|---|---|
| Quadrant | BADHDUFLAG | Total packets | Discarded packets |
| A | 0 | 11 | 0 |
| B | 0 | 11 | 0 |
| C | 0 | 11 | 0 |
| D | 0 | 11 | 0 |
| Quadrant | Total seconds | Saturated seconds | Saturation percentage |
|---|---|---|---|
| A | 6347 | 151 | 2.379077% |
| B | 6347 | 1990 | 31.353395% |
| C | 6347 | 112 | 1.764613% |
| D | 6348 | 2493 | 39.272212% |
Noise dominated data is calculated using 1-second bins in cleaned event files. If a bin has >2000 counts, and if more than 50% of those come from <1% of pixels, then it is considered to be noise-dominated and hence unusable.
| Quadrant | # 1 sec bins | Bins with >0 counts | Bins with >2000 counts | High rate bins dominated by noise | Noise dominated (total time) | Noise dominated (detector-on time) | Marked lightcurve |
|---|---|---|---|---|---|---|---|
| A | 7422 | 6348 | 86 | 86 | 1.16% | 1.35% | 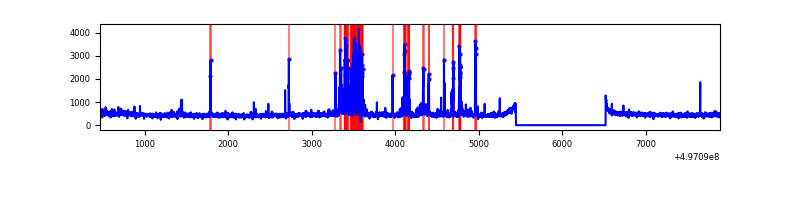 |
| B | 7422 | 6348 | 1362 | 1362 | 18.35% | 21.46% | 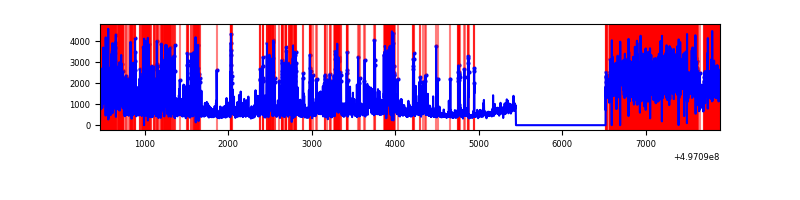 |
| C | 7422 | 6348 | 75 | 75 | 1.01% | 1.18% | 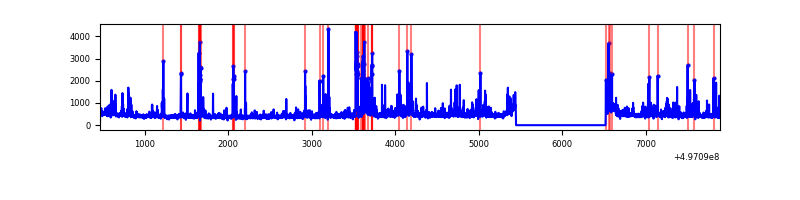 |
| D | 7423 | 6349 | 2120 | 2120 | 28.56% | 33.39% | 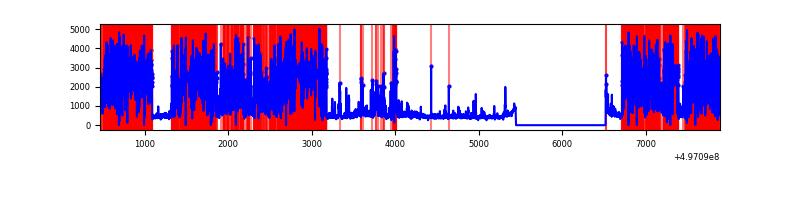 |
Top three noisy pixels from each quadrant. If the there are fewer than three noisy pixels in the level2.evt file, extra rows are filled as -1
| Pixel properties | Quadrant properties | ||||||
|---|---|---|---|---|---|---|---|
| Quadrant | DetID | PixID | Counts | Sigma | Mean | Median | Sigma |
| A | 7 | 29 | 311799 | 1870.69 | 673 | 655 | 166.3 |
| A | 3 | 14 | 139096 | 832.35 | 673 | 655 | 166.3 |
| A | 15 | 174 | 122276 | 731.22 | 673 | 655 | 166.3 |
| B | 5 | 172 | 2531085 | 21081.54 | 564 | 545 | 120.0 |
| B | 6 | 255 | 1965377 | 16368.71 | 564 | 545 | 120.0 |
| B | 15 | 20 | 633694 | 5274.66 | 564 | 545 | 120.0 |
| C | 15 | 177 | 345451 | 1938.28 | 644 | 637 | 177.9 |
| C | 14 | 254 | 208636 | 1169.21 | 644 | 637 | 177.9 |
| C | 12 | 2 | 98583 | 550.58 | 644 | 637 | 177.9 |
| D | 8 | 176 | 6812651 | 47278.48 | 505 | 482 | 144.1 |
| D | 10 | 181 | 94036 | 649.29 | 505 | 482 | 144.1 |
| D | 3 | 176 | 49200 | 338.12 | 505 | 482 | 144.1 |
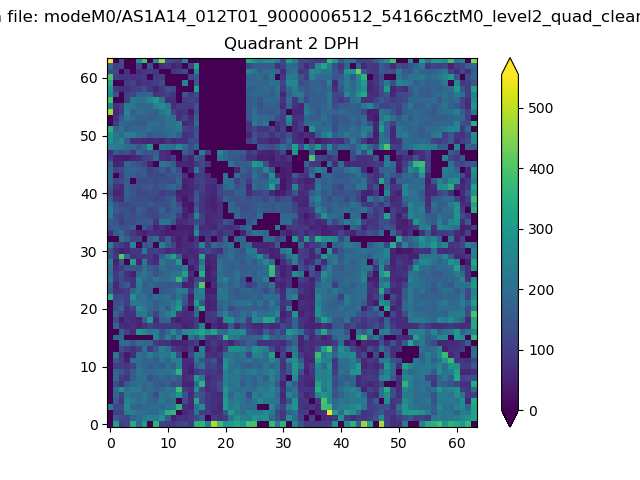
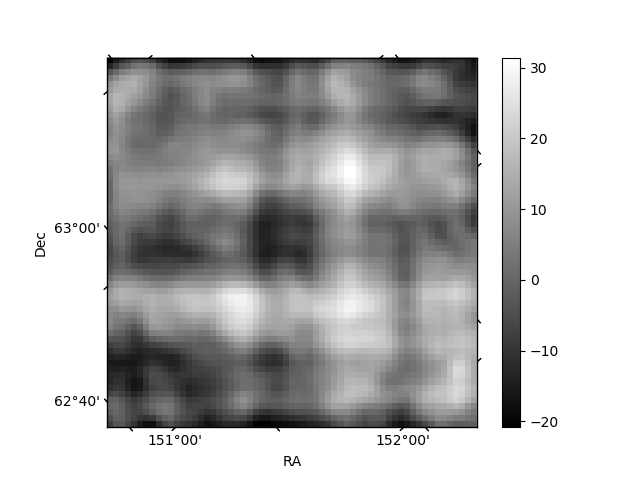
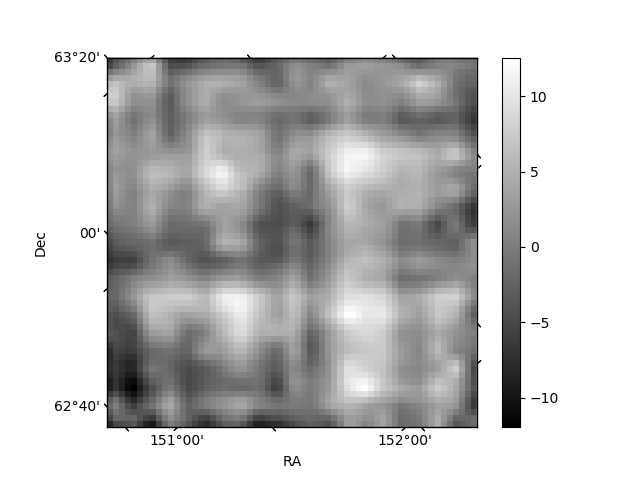
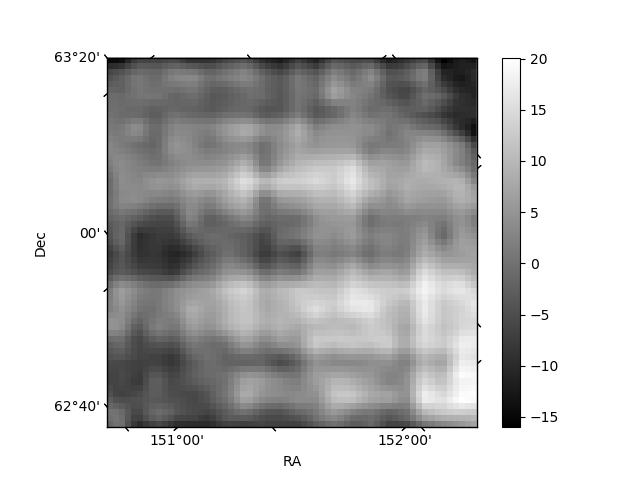
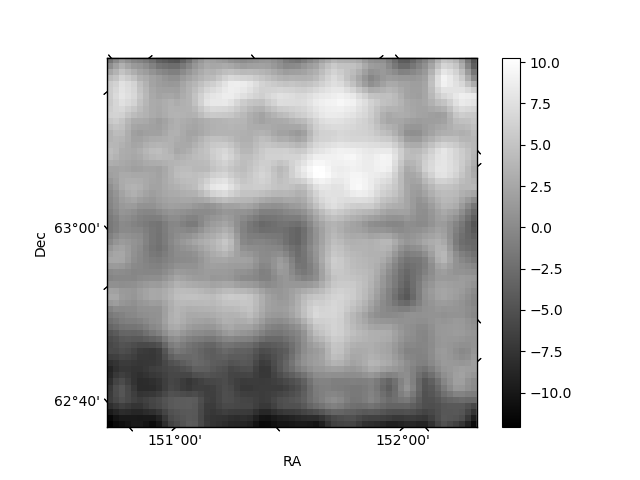
Histogram calculated using DETX and DETY for each event in the final _common_clean file
| Quadrant A | 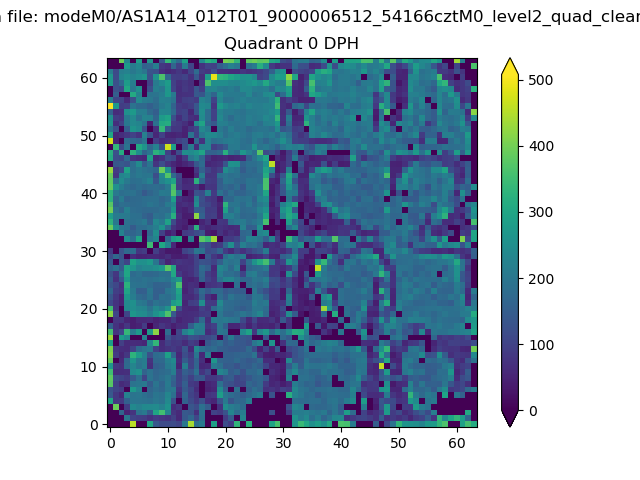 |
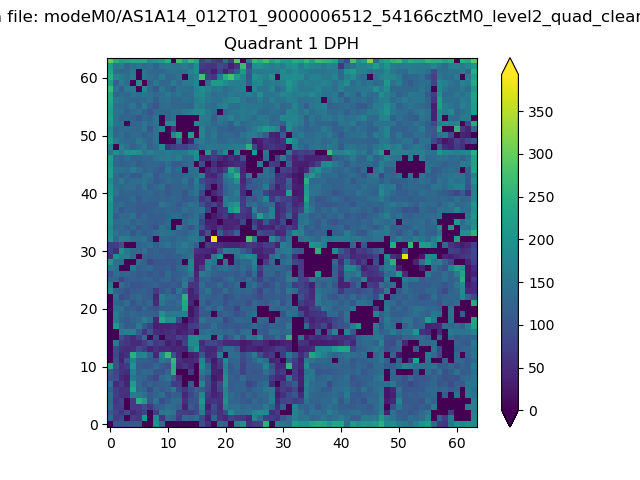 |
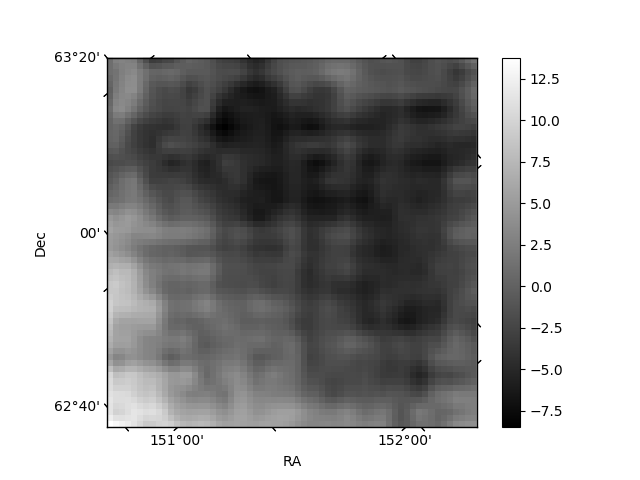
Quadrant B |
|---|---|---|---|
| Quadrant D | 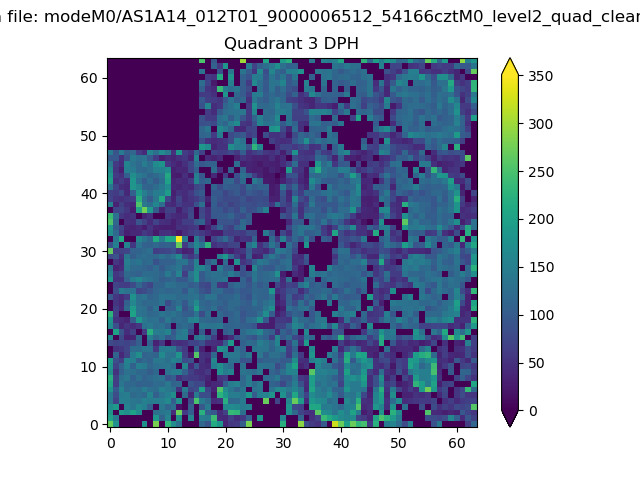 |
 |
Quadrant C |
| Plot type | Count rate plots | Images |
|---|---|---|
| Comparison with Poisson distribution Blue bars denote a histogram of data divided into 1 sec bins. Red curve is a Poisson curve with rate = median count rate of data. |
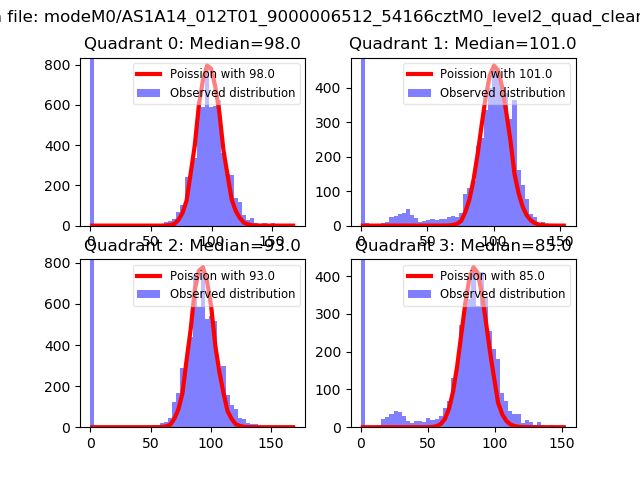 |
 |
| Quadrant-wise count rates Data is divided into 100 sec bins |
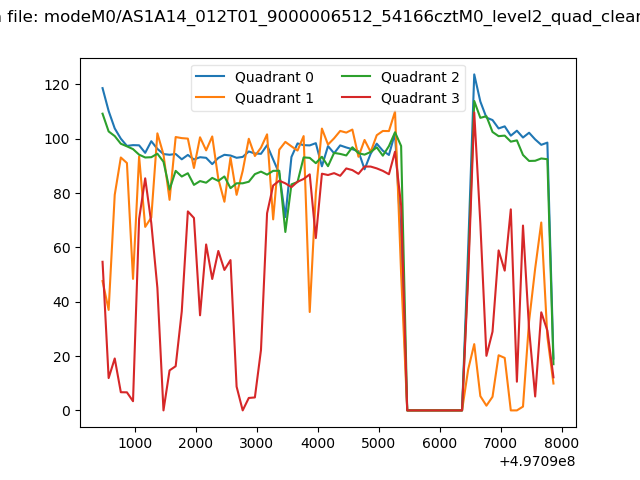 |
|
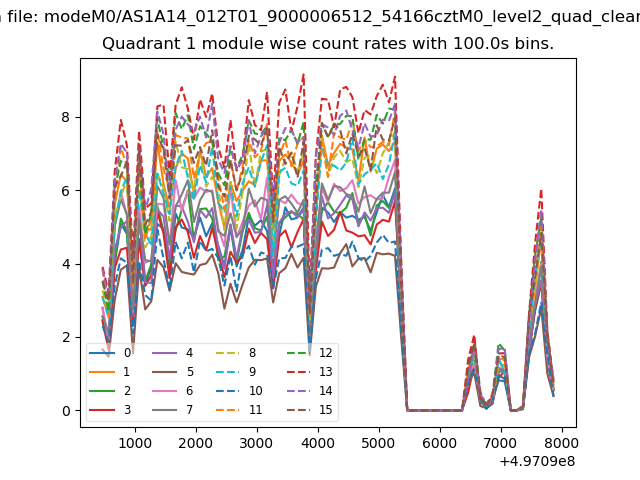
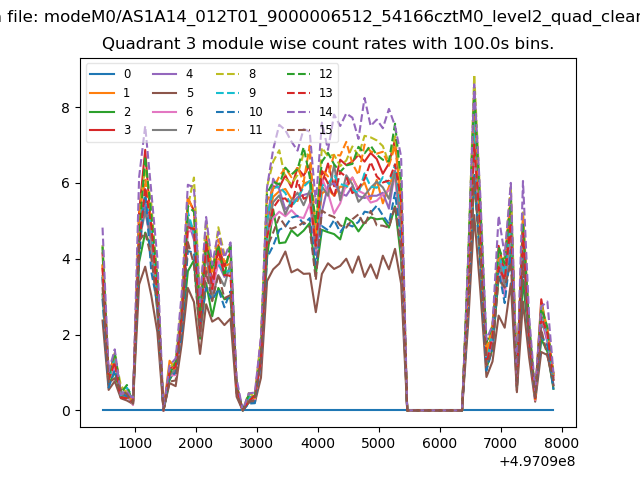
| Module-wise count rates for Quadrant A Data is divided into 100 sec bins |
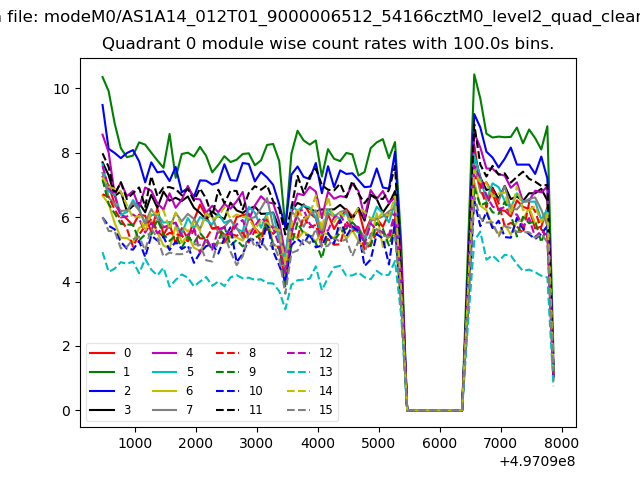 |
 |
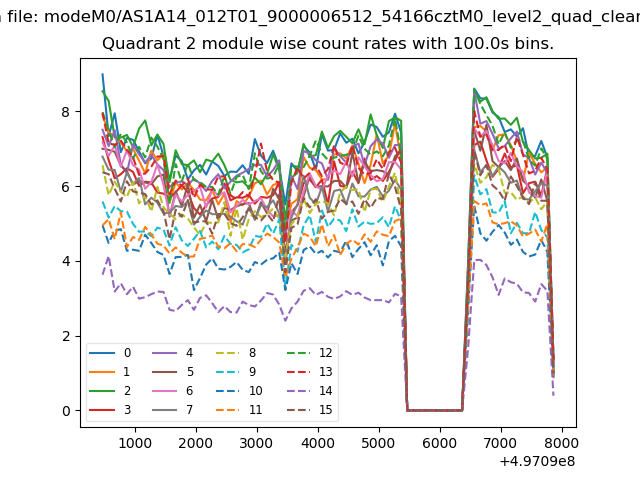
| Module-wise count rates for Quadrant B Data is divided into 100 sec bins |
 |
 |
| Module-wise count rates for Quadrant C Data is divided into 100 sec bins |
 |
 |
| Module-wise count rates for Quadrant D Data is divided into 100 sec bins |
 |
 |
| Parameter | Plot |
|---|---|
| CZT HV Monitor | 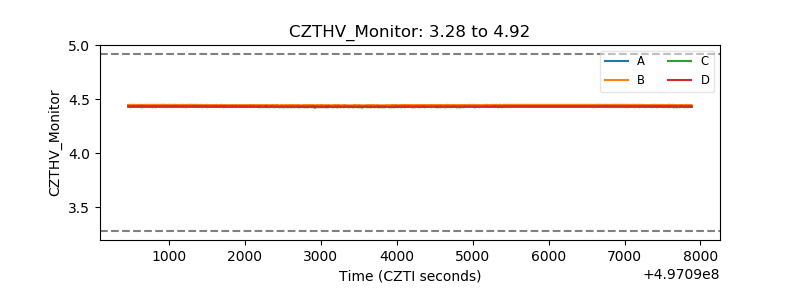 |
| D_VDD | 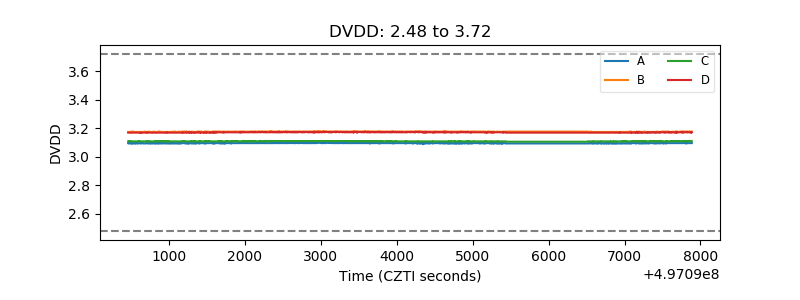 |
| Temperature 1 | 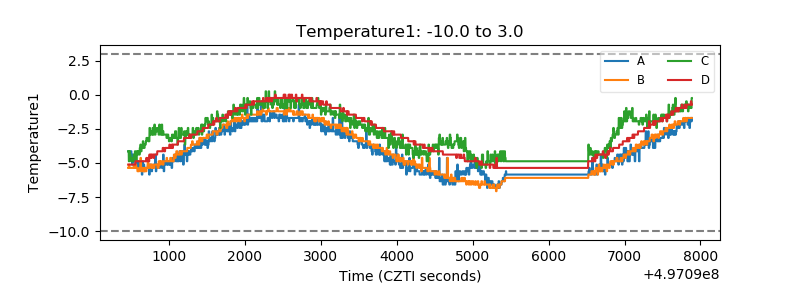 |
| Veto HV Monitor | 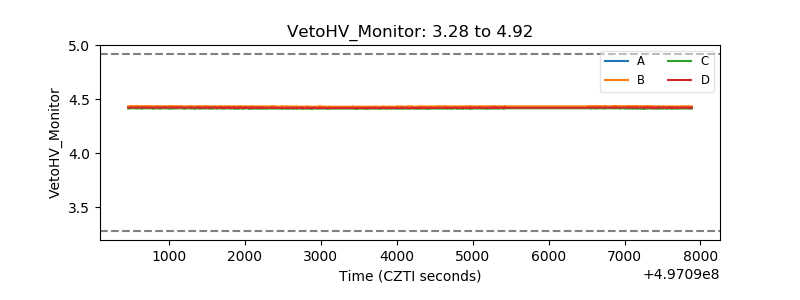 |
| Veto LLD | 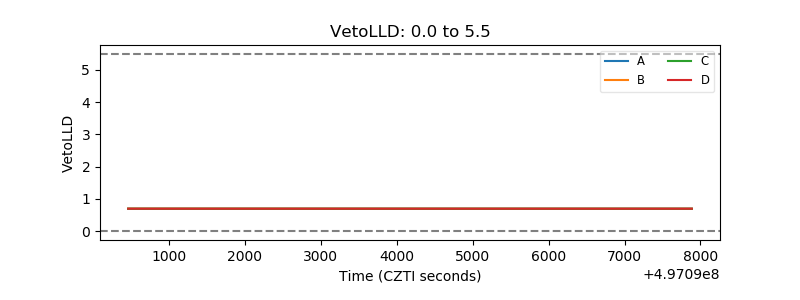 |
| Alpha Counter | 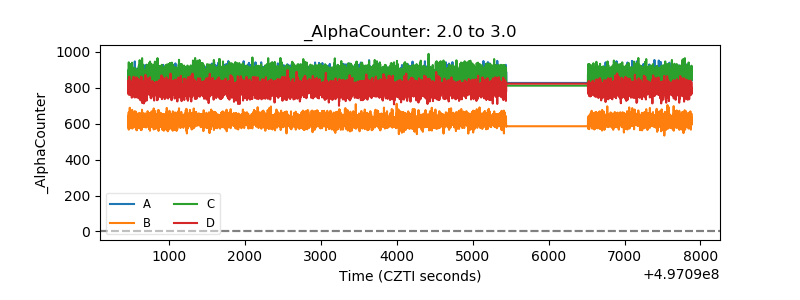 |
| _CPM_Rate | 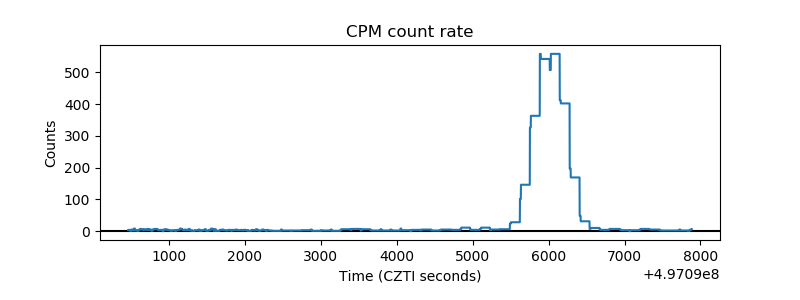 |
| CZT Counter | 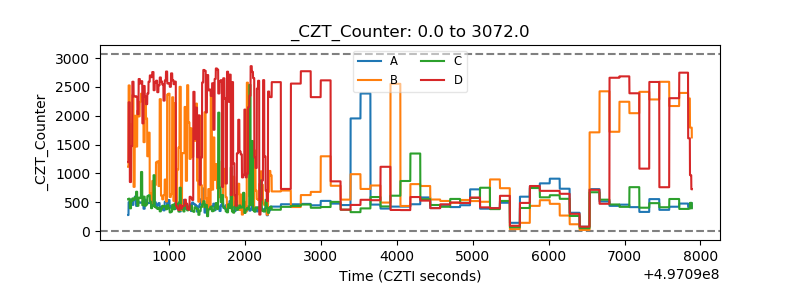 |
| +2.5 Volts monitor | 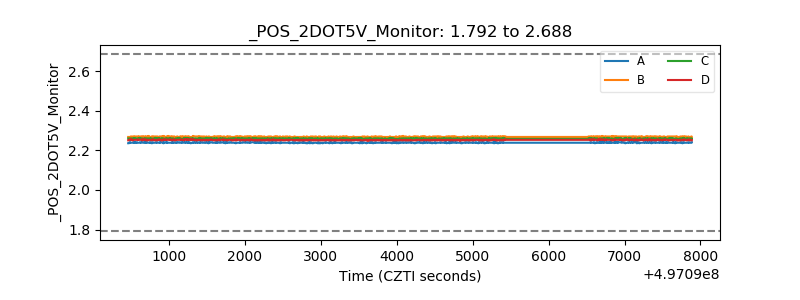 |
| +5 Volts monitor |  |
| _ROLL_ROT | 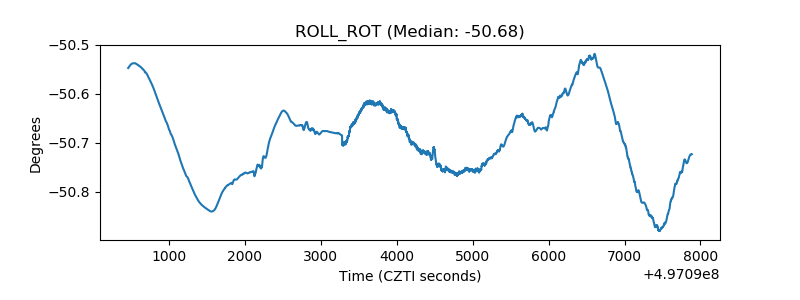 |
| _Roll_DEC | 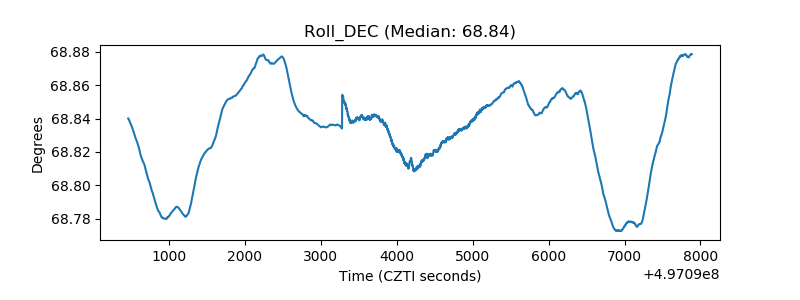 |
| _Roll_RA | 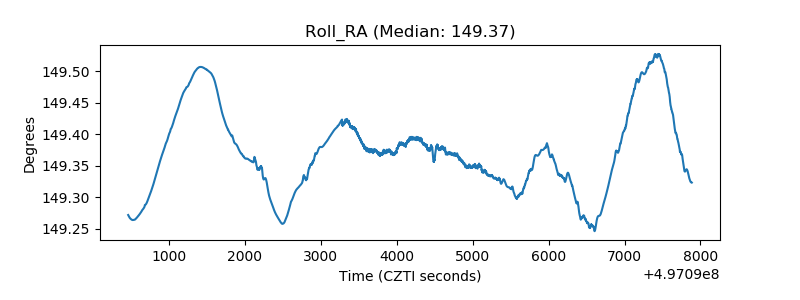 |
| Veto Counter | 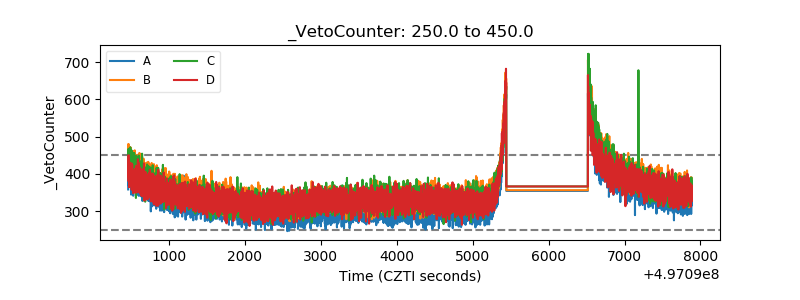 |