| Param | Original file | Final file |
|---|---|---|
| Filename | modeM0/AS1A14_012T01_9000006512_54167cztM0_level2.fits | modeM0/AS1A14_012T01_9000006512_54167cztM0_level2_quad_clean.evt |
| Size (bytes) | 640,123,200 | 77,696,640 |
| Size | 610.5 MB | 74.1 MB |
| Events in quadrant A | 3,648,981 | 579,061 |
| Events in quadrant B | 9,853,172 | 385,064 |
| Events in quadrant C | 3,219,395 | 563,964 |
| Events in quadrant D | 6,504,577 | 402,450 |
| Mode SS | |||
|---|---|---|---|
| Quadrant | BADHDUFLAG | Total packets | Discarded packets |
| A | 0 | 122 | 0 |
| B | 0 | 122 | 0 |
| C | 0 | 122 | 0 |
| D | 0 | 122 | 0 |
| Mode M0 | |||
|---|---|---|---|
| Quadrant | BADHDUFLAG | Total packets | Discarded packets |
| A | 0 | 15068 | 1 |
| B | 0 | 33474 | 14 |
| C | 0 | 13894 | 1 |
| D | 0 | 23611 | 6 |
| Mode M9 | |||
|---|---|---|---|
| Quadrant | BADHDUFLAG | Total packets | Discarded packets |
| A | 0 | 11 | 0 |
| B | 0 | 11 | 0 |
| C | 0 | 11 | 0 |
| D | 0 | 11 | 0 |
| Quadrant | Total seconds | Saturated seconds | Saturation percentage |
|---|---|---|---|
| A | 6040 | 321 | 5.314570% |
| B | 6039 | 2775 | 45.951316% |
| C | 6040 | 113 | 1.870861% |
| D | 6038 | 1533 | 25.389202% |
Noise dominated data is calculated using 1-second bins in cleaned event files. If a bin has >2000 counts, and if more than 50% of those come from <1% of pixels, then it is considered to be noise-dominated and hence unusable.
| Quadrant | # 1 sec bins | Bins with >0 counts | Bins with >2000 counts | High rate bins dominated by noise | Noise dominated (total time) | Noise dominated (detector-on time) | Marked lightcurve |
|---|---|---|---|---|---|---|---|
| A | 7100 | 6041 | 155 | 155 | 2.18% | 2.57% | 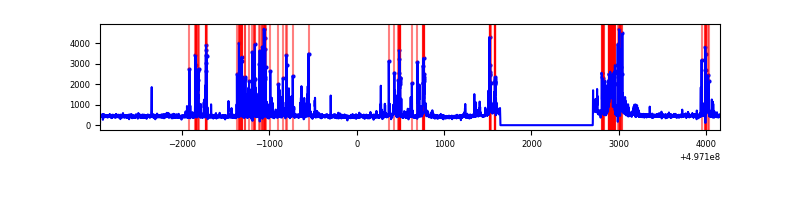 |
| B | 7100 | 6041 | 1942 | 1942 | 27.35% | 32.15% | 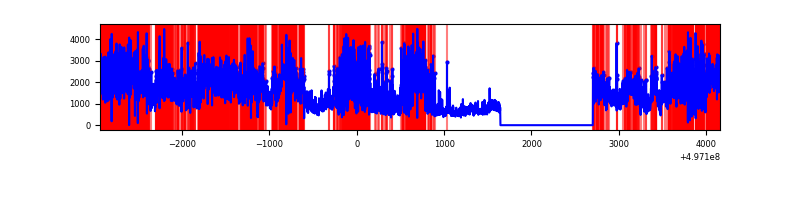 |
| C | 7100 | 6041 | 57 | 57 | 0.80% | 0.94% | 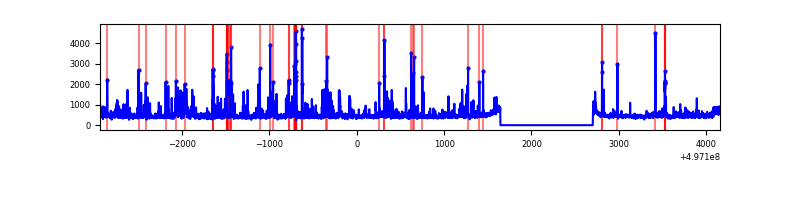 |
| D | 7100 | 6040 | 1224 | 1224 | 17.24% | 20.26% | 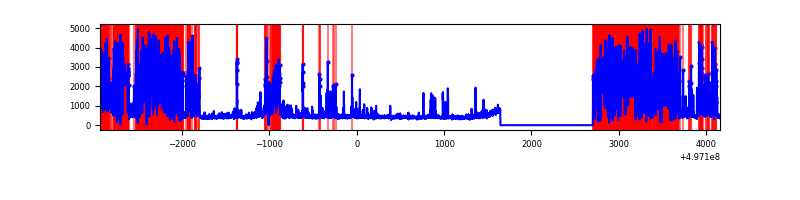 |
Top three noisy pixels from each quadrant. If the there are fewer than three noisy pixels in the level2.evt file, extra rows are filled as -1
| Pixel properties | Quadrant properties | ||||||
|---|---|---|---|---|---|---|---|
| Quadrant | DetID | PixID | Counts | Sigma | Mean | Median | Sigma |
| A | 7 | 29 | 503662 | 3186.65 | 638 | 624 | 157.9 |
| A | 15 | 174 | 497886 | 3150.06 | 638 | 624 | 157.9 |
| A | 3 | 14 | 111118 | 699.96 | 638 | 624 | 157.9 |
| B | 5 | 172 | 5210031 | 46824.43 | 517 | 499 | 111.3 |
| B | 6 | 255 | 945613 | 8494.89 | 517 | 499 | 111.3 |
| B | 15 | 20 | 879078 | 7896.86 | 517 | 499 | 111.3 |
| C | 15 | 177 | 411811 | 2364.43 | 626 | 618 | 173.9 |
| C | 14 | 254 | 111752 | 639.04 | 626 | 618 | 173.9 |
| C | 12 | 250 | 85713 | 489.31 | 626 | 618 | 173.9 |
| D | 8 | 176 | 4010766 | 26645.88 | 526 | 501 | 150.5 |
| D | 3 | 176 | 119582 | 791.22 | 526 | 501 | 150.5 |
| D | 7 | 62 | 78927 | 521.1 | 526 | 501 | 150.5 |
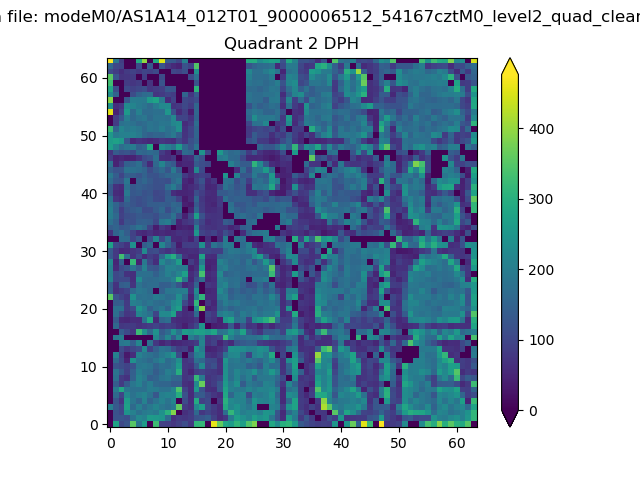
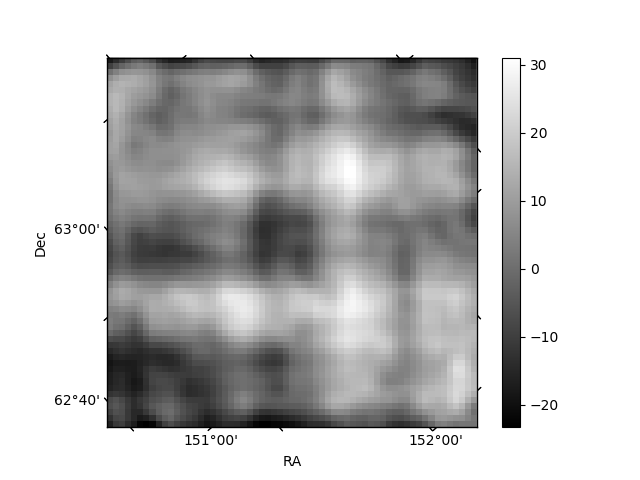
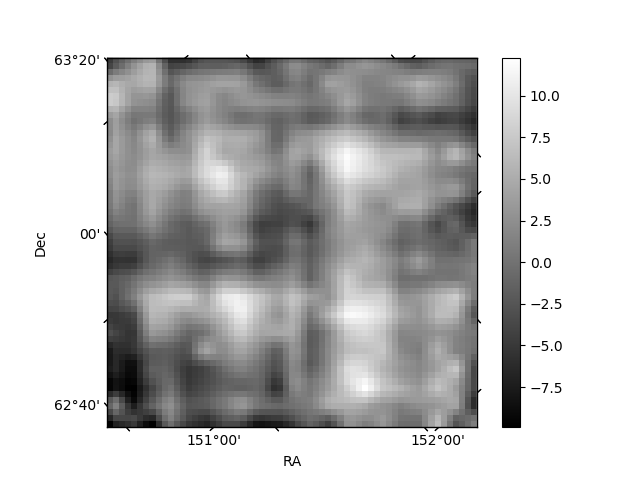
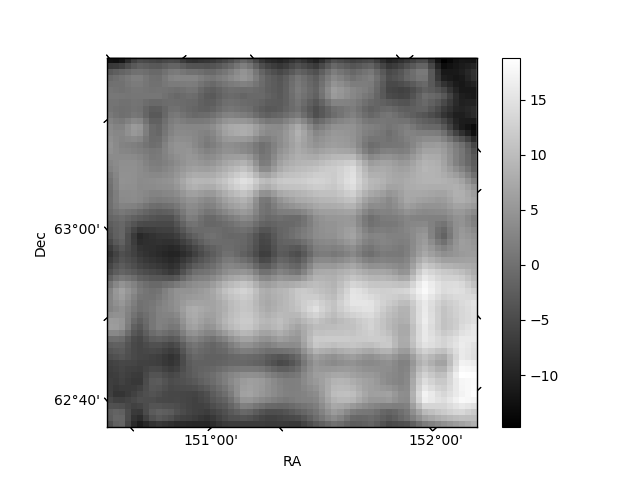
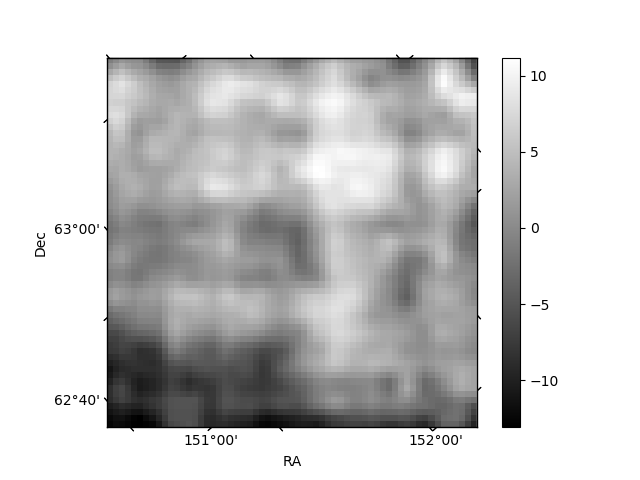
Histogram calculated using DETX and DETY for each event in the final _common_clean file
| Quadrant A | 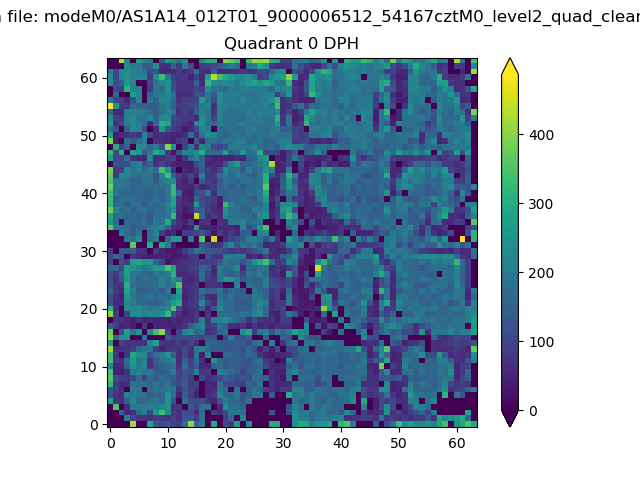 |
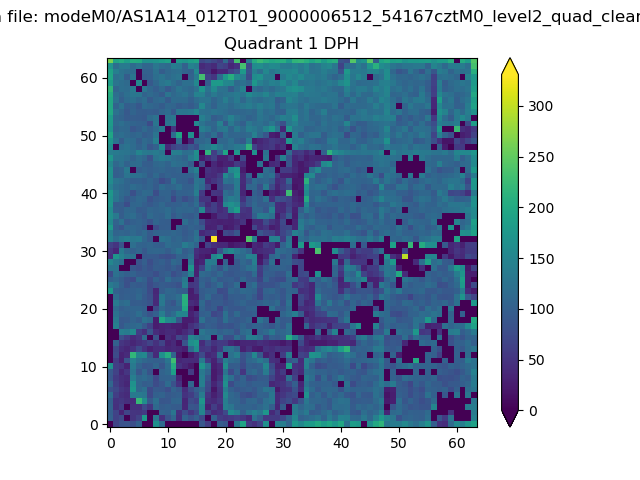 |
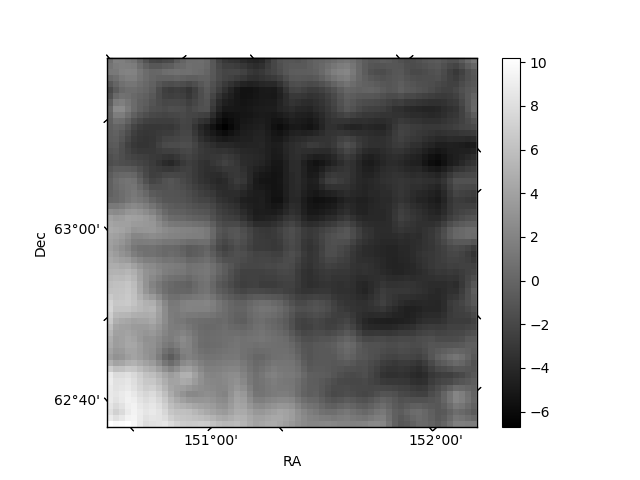
Quadrant B |
|---|---|---|---|
| Quadrant D | 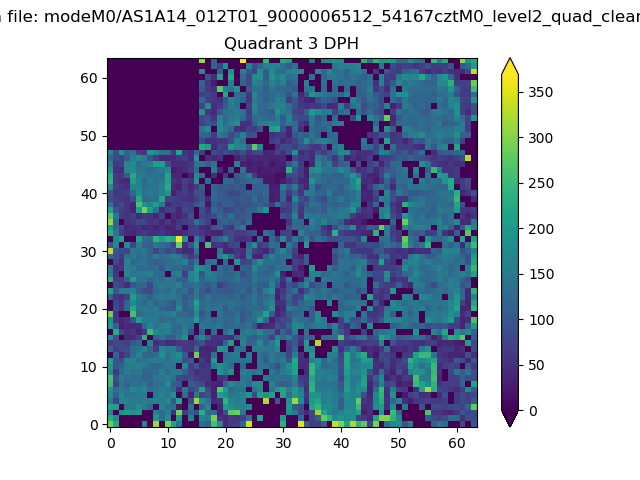 |
 |
Quadrant C |
| Plot type | Count rate plots | Images |
|---|---|---|
| Comparison with Poisson distribution Blue bars denote a histogram of data divided into 1 sec bins. Red curve is a Poisson curve with rate = median count rate of data. |
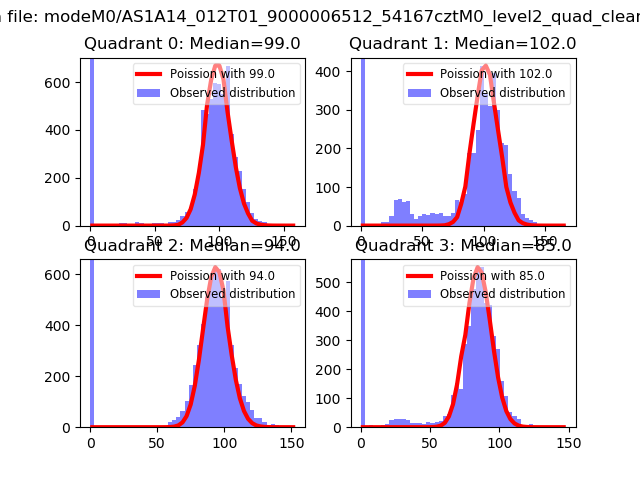 |
 |
| Quadrant-wise count rates Data is divided into 100 sec bins |
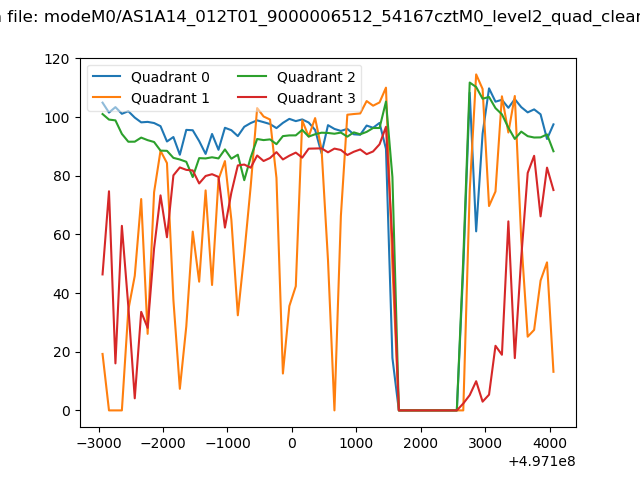 |
|
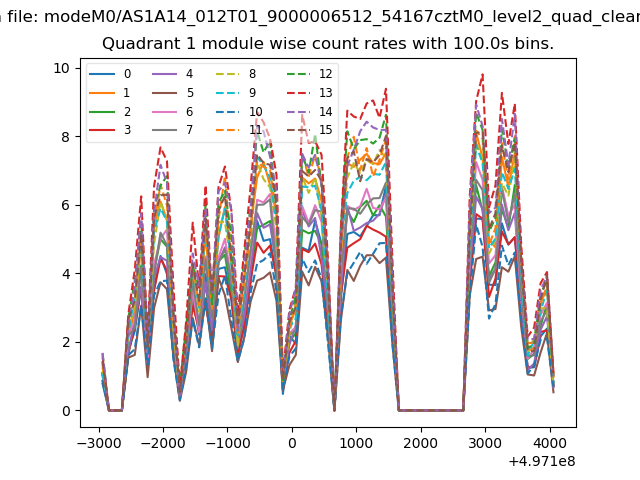
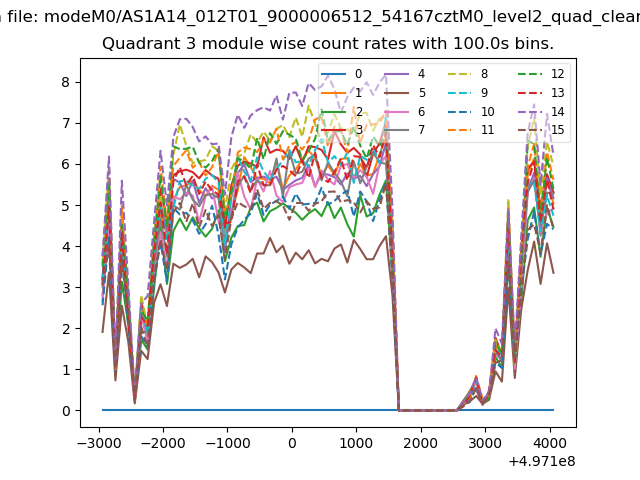
| Module-wise count rates for Quadrant A Data is divided into 100 sec bins |
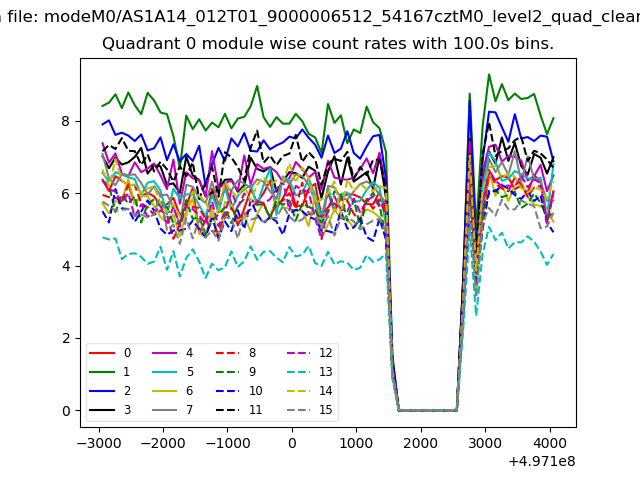 |
 |
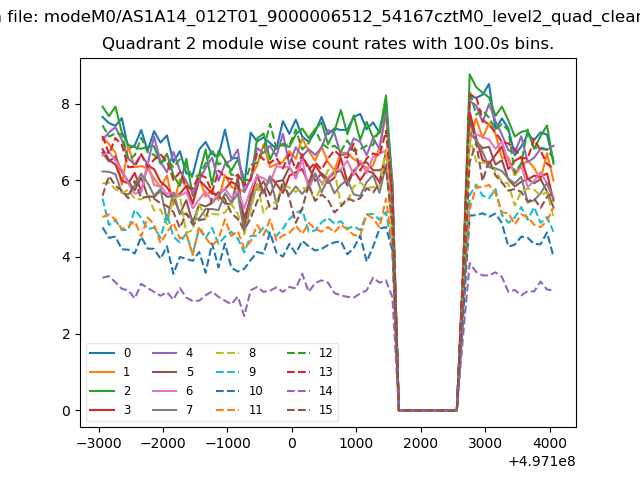
| Module-wise count rates for Quadrant B Data is divided into 100 sec bins |
 |
 |
| Module-wise count rates for Quadrant C Data is divided into 100 sec bins |
 |
 |
| Module-wise count rates for Quadrant D Data is divided into 100 sec bins |
 |
 |
| Parameter | Plot |
|---|---|
| CZT HV Monitor | 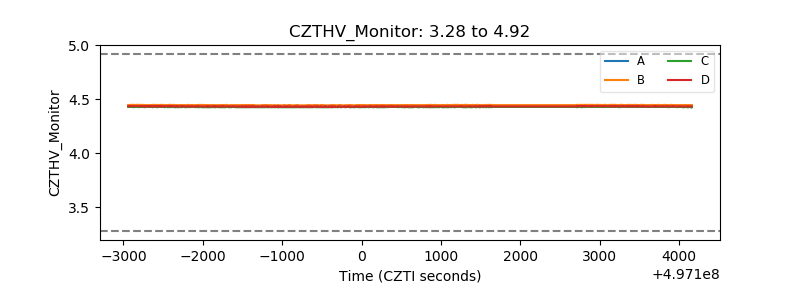 |
| D_VDD | 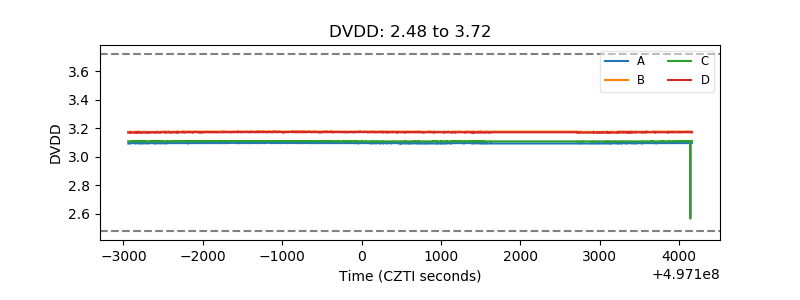 |
| Temperature 1 | 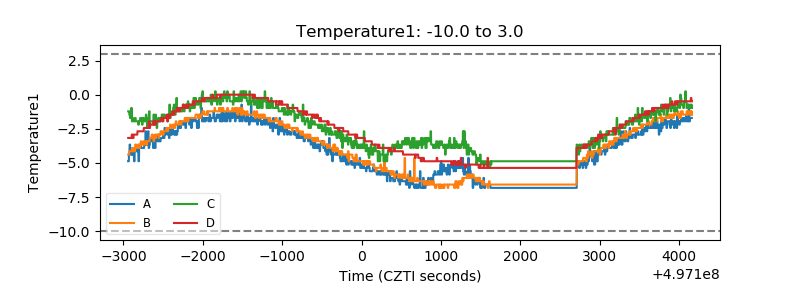 |
| Veto HV Monitor | 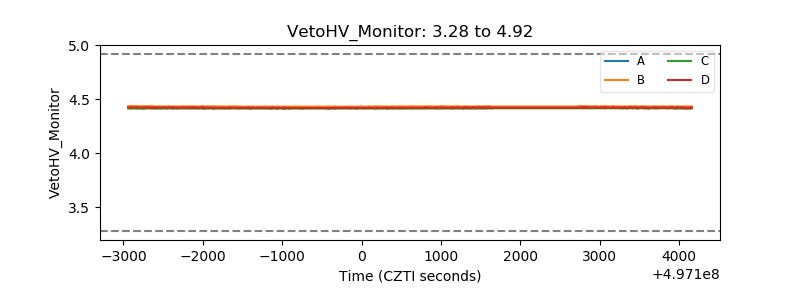 |
| Veto LLD | 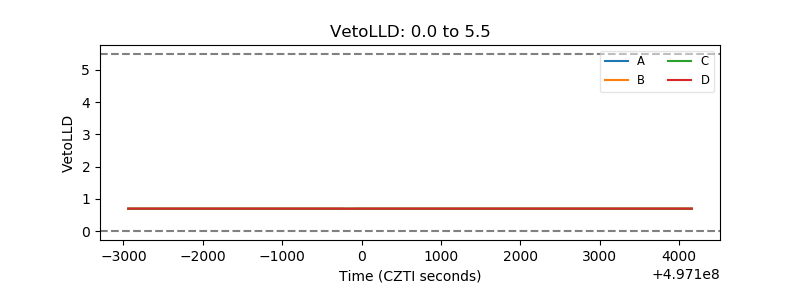 |
| Alpha Counter | 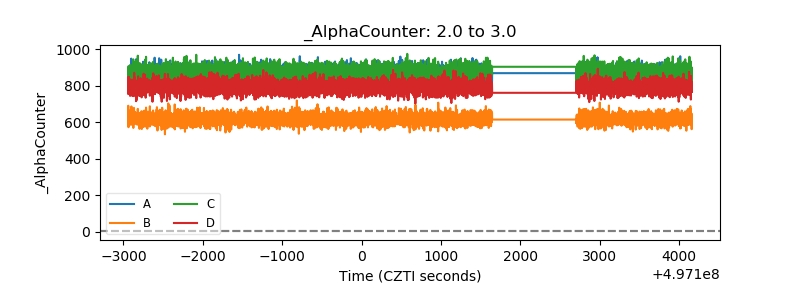 |
| _CPM_Rate | 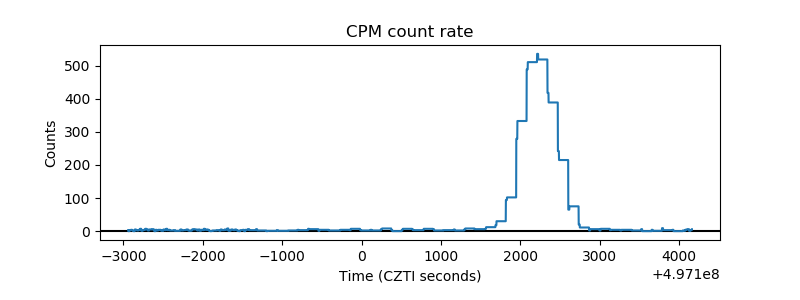 |
| CZT Counter | 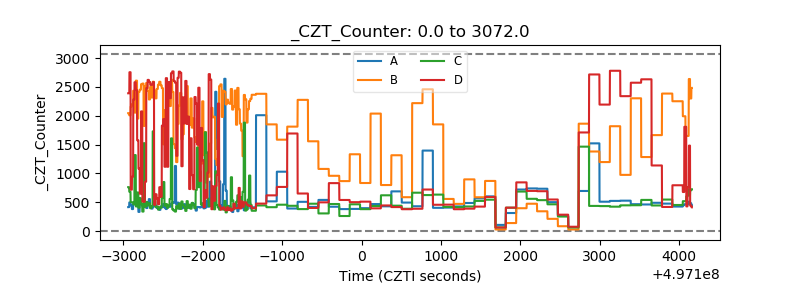 |
| +2.5 Volts monitor | 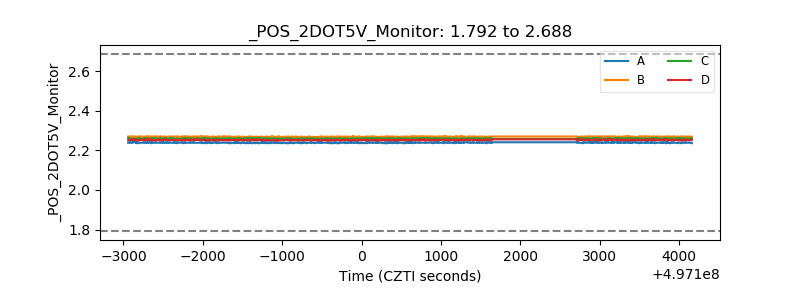 |
| +5 Volts monitor |  |
| _ROLL_ROT | 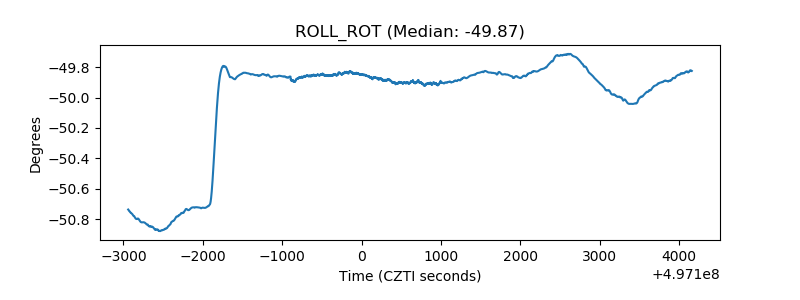 |
| _Roll_DEC | 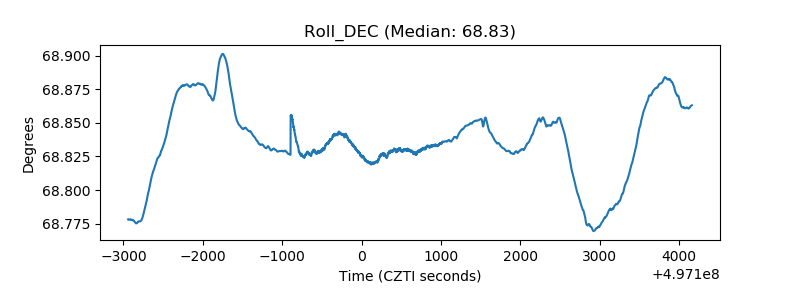 |
| _Roll_RA | 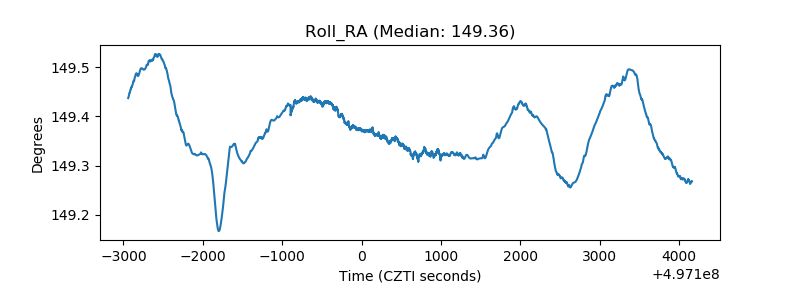 |
| Veto Counter | 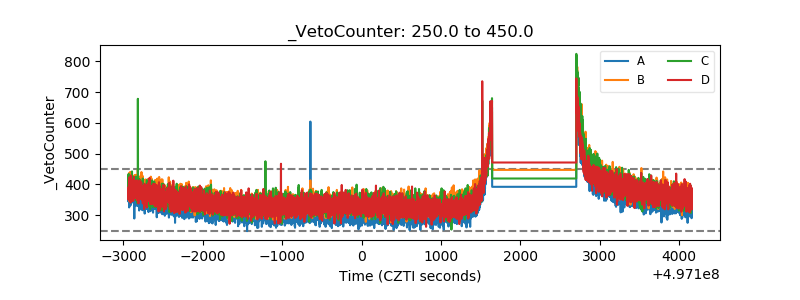 |