| Param | Original file | Final file |
|---|---|---|
| Filename | modeM0/AS1A14_012T01_9000006512_54168cztM0_level2.fits | modeM0/AS1A14_012T01_9000006512_54168cztM0_level2_quad_clean.evt |
| Size (bytes) | 629,176,320 | 88,444,800 |
| Size | 600.0 MB | 84.3 MB |
| Events in quadrant A | 3,803,549 | 645,113 |
| Events in quadrant B | 9,229,708 | 481,824 |
| Events in quadrant C | 3,315,952 | 623,386 |
| Events in quadrant D | 6,421,345 | 461,651 |
| Mode SS | |||
|---|---|---|---|
| Quadrant | BADHDUFLAG | Total packets | Discarded packets |
| A | 0 | 136 | 0 |
| B | 0 | 136 | 0 |
| C | 0 | 136 | 0 |
| D | 0 | 136 | 0 |
| Mode M0 | |||
|---|---|---|---|
| Quadrant | BADHDUFLAG | Total packets | Discarded packets |
| A | 0 | 15952 | 1 |
| B | 0 | 32045 | 1 |
| C | 0 | 14705 | 1 |
| D | 0 | 23795 | 1 |
| Mode M9 | |||
|---|---|---|---|
| Quadrant | BADHDUFLAG | Total packets | Discarded packets |
| A | 0 | 11 | 0 |
| B | 0 | 11 | 0 |
| C | 0 | 11 | 0 |
| D | 0 | 11 | 0 |
| Quadrant | Total seconds | Saturated seconds | Saturation percentage |
|---|---|---|---|
| A | 6685 | 309 | 4.622289% |
| B | 6686 | 2319 | 34.684415% |
| C | 6686 | 92 | 1.376010% |
| D | 6685 | 1493 | 22.333583% |
Noise dominated data is calculated using 1-second bins in cleaned event files. If a bin has >2000 counts, and if more than 50% of those come from <1% of pixels, then it is considered to be noise-dominated and hence unusable.
| Quadrant | # 1 sec bins | Bins with >0 counts | Bins with >2000 counts | High rate bins dominated by noise | Noise dominated (total time) | Noise dominated (detector-on time) | Marked lightcurve |
|---|---|---|---|---|---|---|---|
| A | 7775 | 6686 | 165 | 165 | 2.12% | 2.47% | 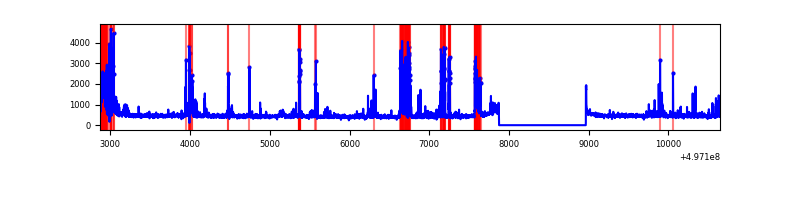 |
| B | 7776 | 6687 | 1718 | 1718 | 22.09% | 25.69% | 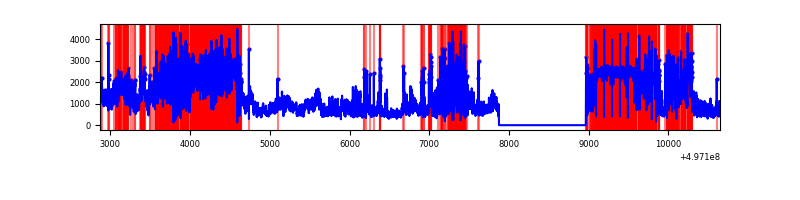 |
| C | 7776 | 6687 | 39 | 39 | 0.50% | 0.58% | 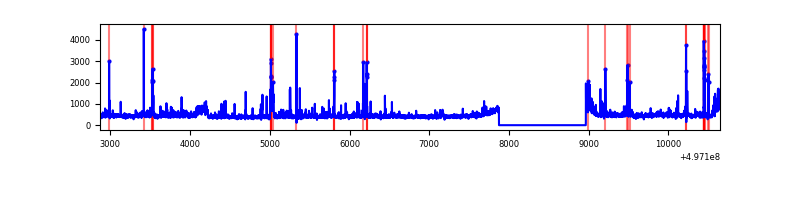 |
| D | 7775 | 6686 | 1234 | 1234 | 15.87% | 18.46% | 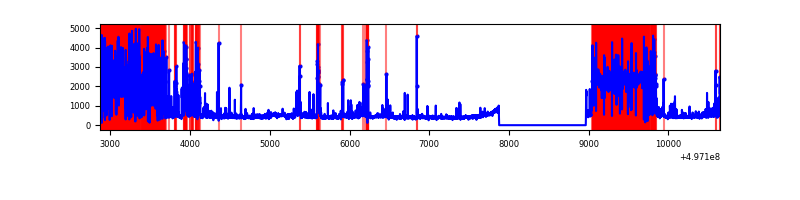 |
Top three noisy pixels from each quadrant. If the there are fewer than three noisy pixels in the level2.evt file, extra rows are filled as -1
| Pixel properties | Quadrant properties | ||||||
|---|---|---|---|---|---|---|---|
| Quadrant | DetID | PixID | Counts | Sigma | Mean | Median | Sigma |
| A | 7 | 29 | 432815 | 2428.41 | 709 | 691 | 177.9 |
| A | 15 | 174 | 339309 | 1902.93 | 709 | 691 | 177.9 |
| A | 3 | 14 | 94174 | 525.35 | 709 | 691 | 177.9 |
| B | 5 | 172 | 4836111 | 39440.98 | 579 | 558 | 122.6 |
| B | 15 | 20 | 768886 | 6266.83 | 579 | 558 | 122.6 |
| B | 4 | 171 | 454210 | 3700.19 | 579 | 558 | 122.6 |
| C | 9 | 38 | 311003 | 1628.08 | 694 | 687 | 190.6 |
| C | 14 | 254 | 81440 | 423.67 | 694 | 687 | 190.6 |
| C | 15 | 177 | 52003 | 269.23 | 694 | 687 | 190.6 |
| D | 8 | 176 | 3591090 | 21629.59 | 581 | 554 | 166.0 |
| D | 3 | 12 | 234287 | 1408.02 | 581 | 554 | 166.0 |
| D | 10 | 181 | 97856 | 586.15 | 581 | 554 | 166.0 |
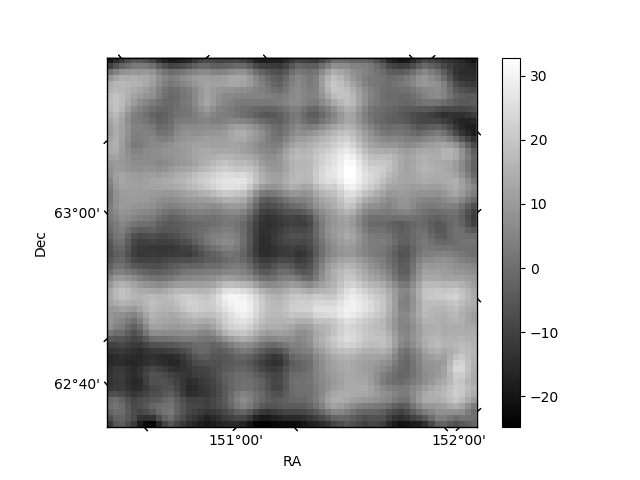
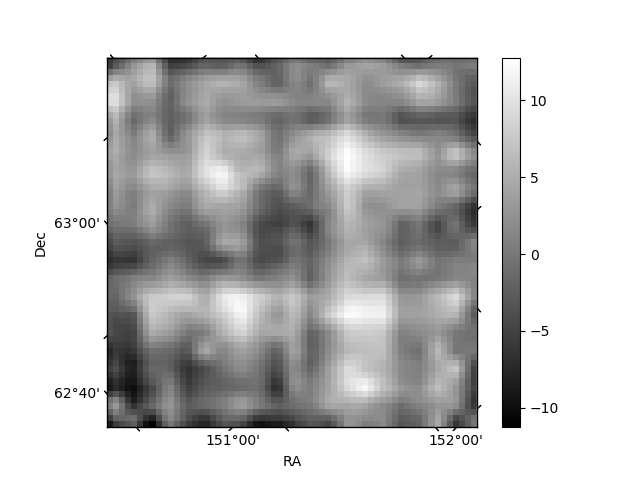
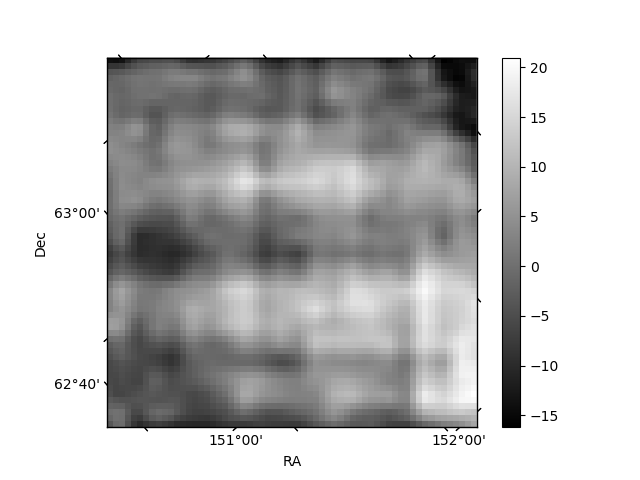
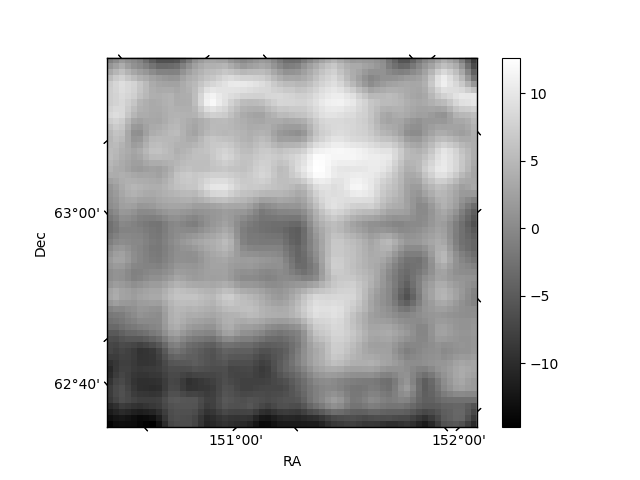
Histogram calculated using DETX and DETY for each event in the final _common_clean file
| Quadrant A | 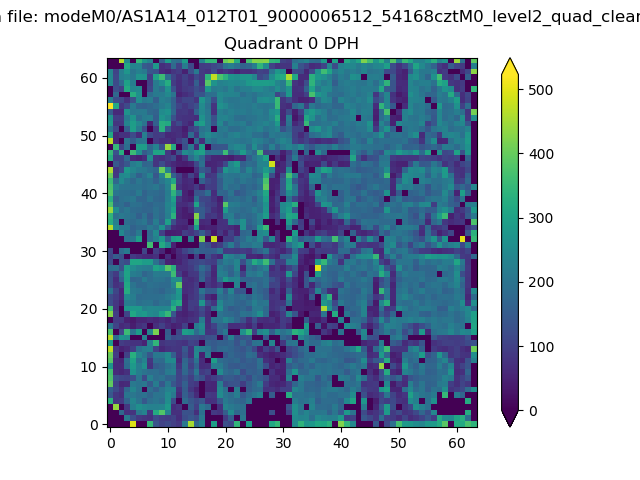 |
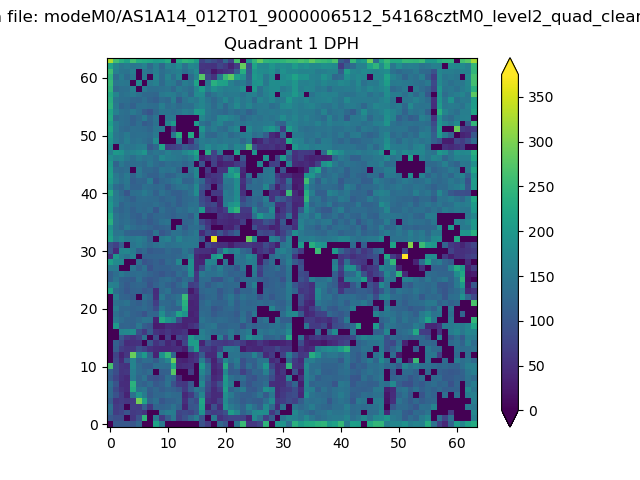 |
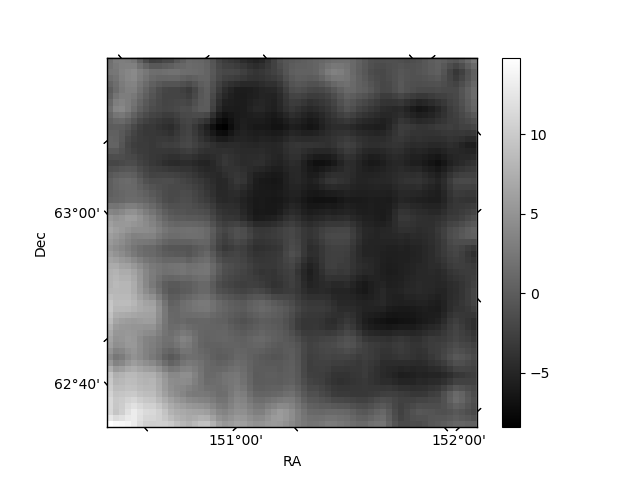
Quadrant B |
|---|---|---|---|
| Quadrant D | 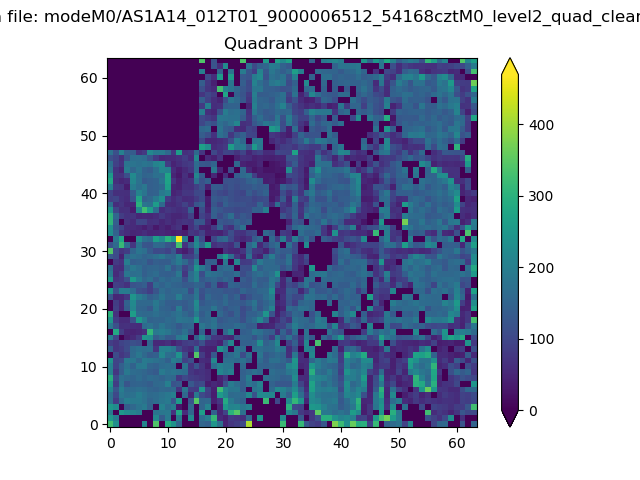 |
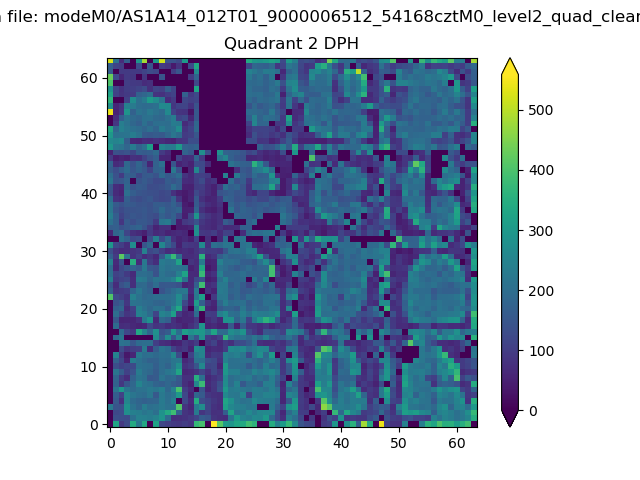 |
Quadrant C |
| Plot type | Count rate plots | Images |
|---|---|---|
| Comparison with Poisson distribution Blue bars denote a histogram of data divided into 1 sec bins. Red curve is a Poisson curve with rate = median count rate of data. |
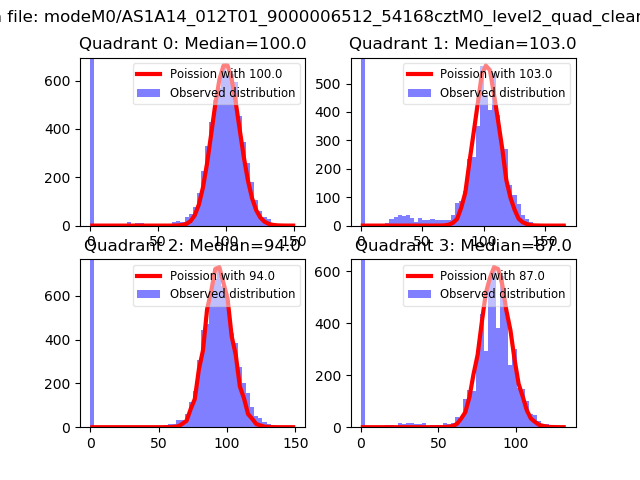 |
 |
| Quadrant-wise count rates Data is divided into 100 sec bins |
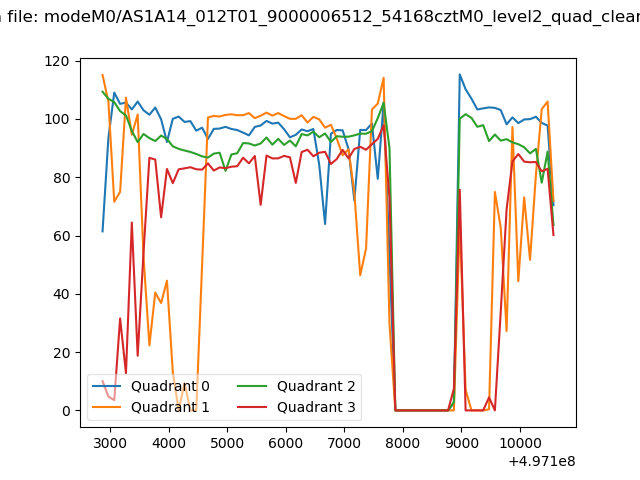 |
|
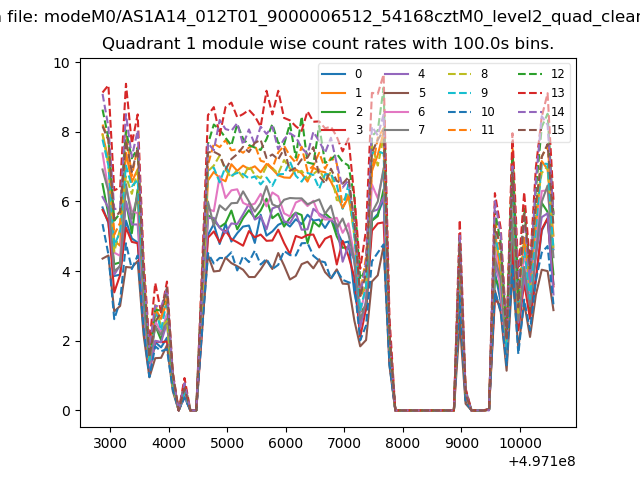
| Module-wise count rates for Quadrant A Data is divided into 100 sec bins |
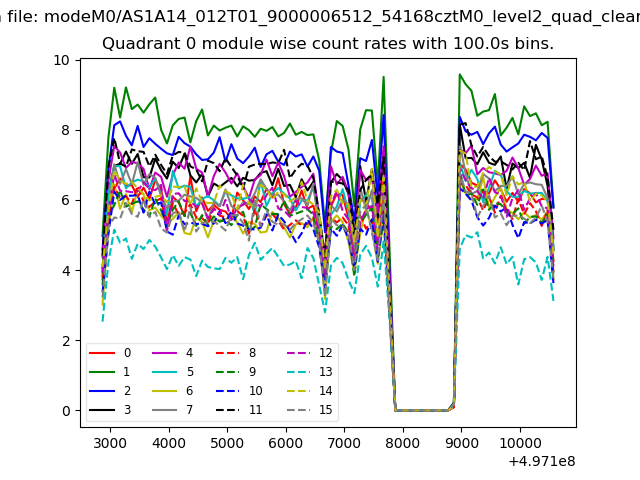 |
 |
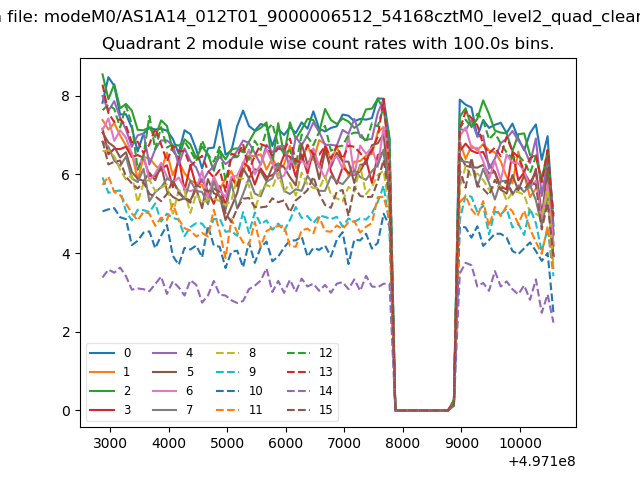
| Module-wise count rates for Quadrant B Data is divided into 100 sec bins |
 |
 |
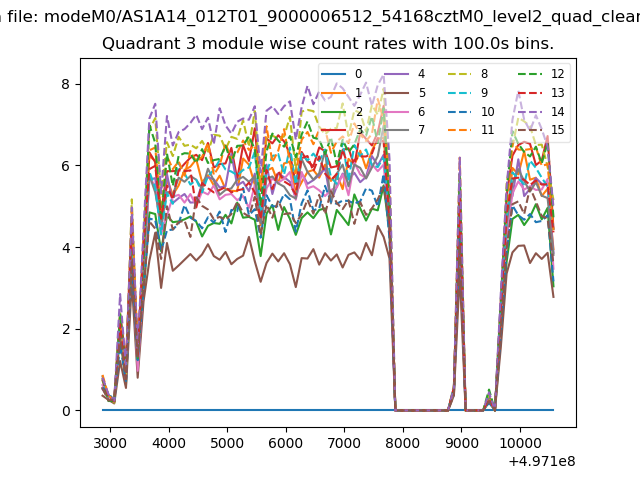
| Module-wise count rates for Quadrant C Data is divided into 100 sec bins |
 |
 |
| Module-wise count rates for Quadrant D Data is divided into 100 sec bins |
 |
 |
| Parameter | Plot |
|---|---|
| CZT HV Monitor | 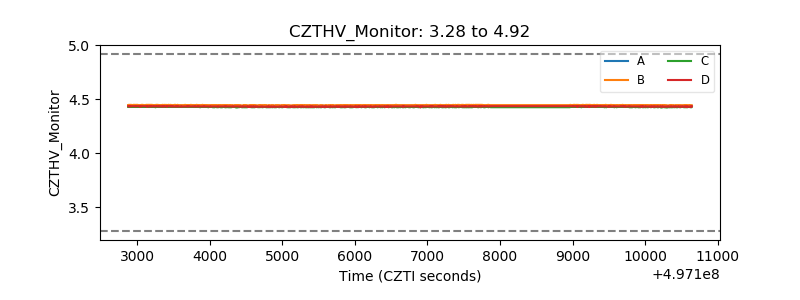 |
| D_VDD | 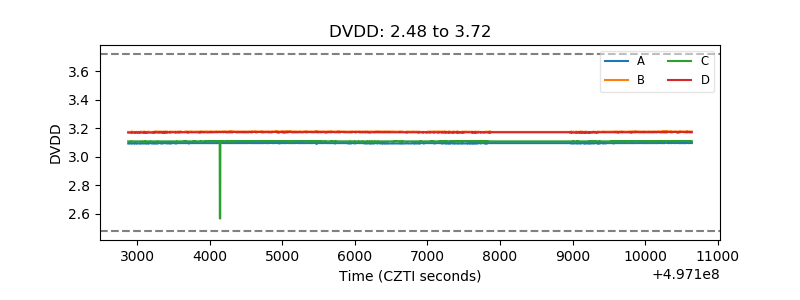 |
| Temperature 1 | 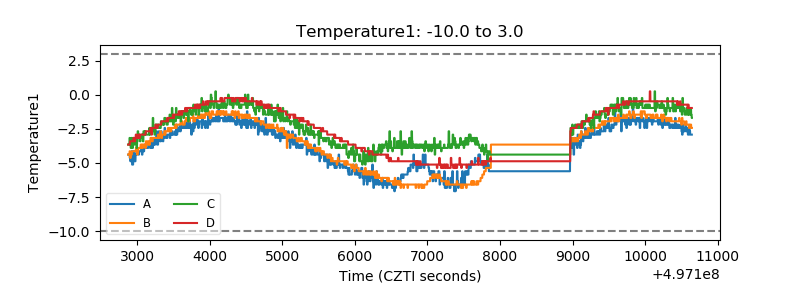 |
| Veto HV Monitor | 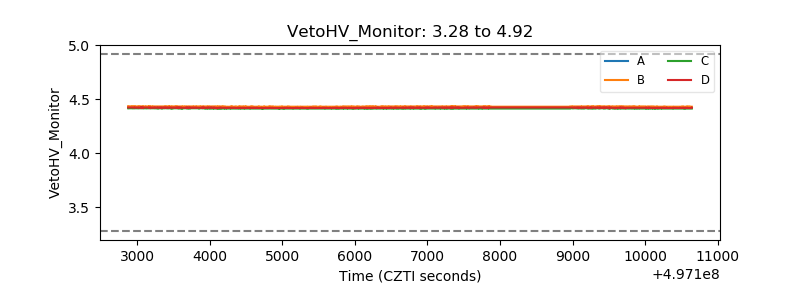 |
| Veto LLD | 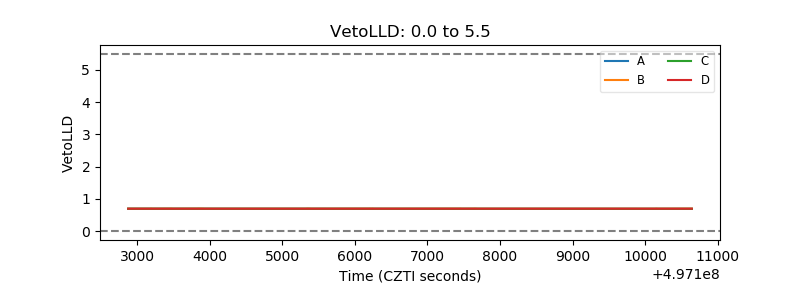 |
| Alpha Counter | 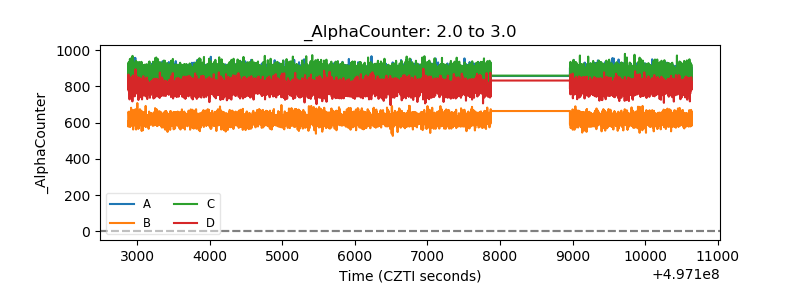 |
| _CPM_Rate | 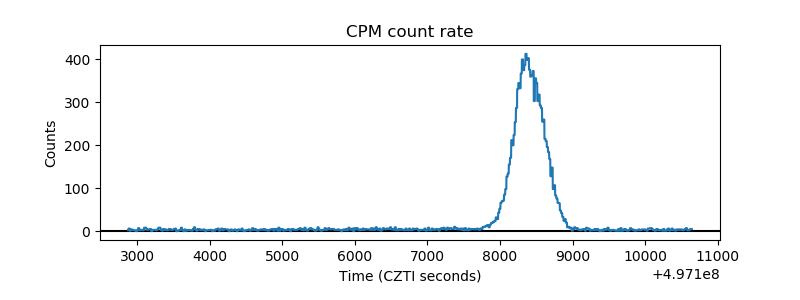 |
| CZT Counter | 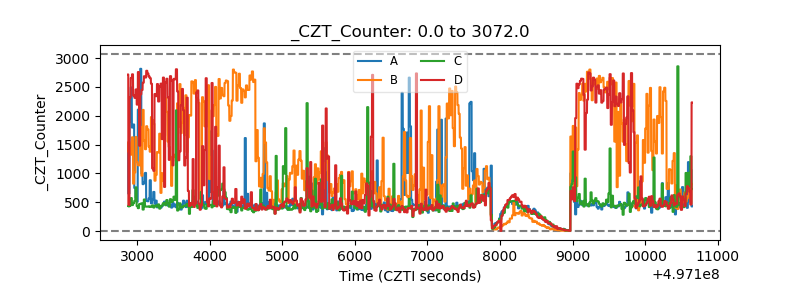 |
| +2.5 Volts monitor | 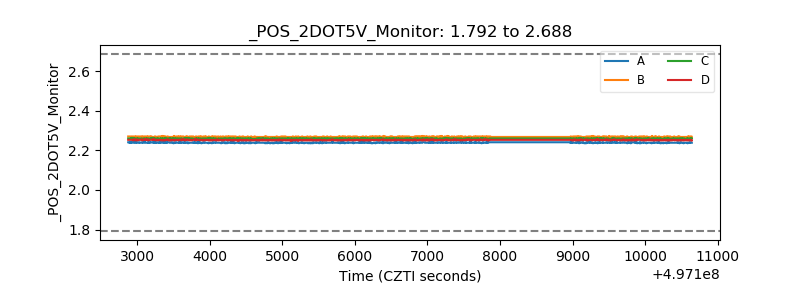 |
| +5 Volts monitor | 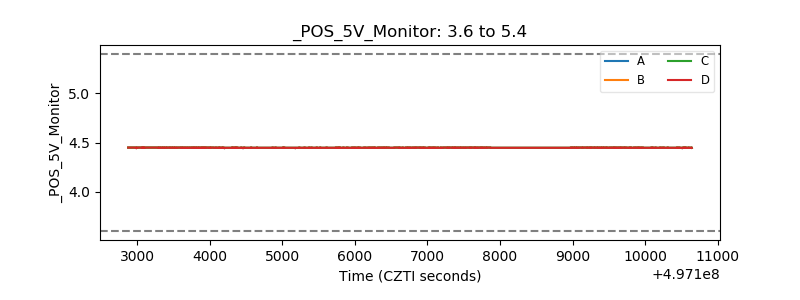 |
| _ROLL_ROT | 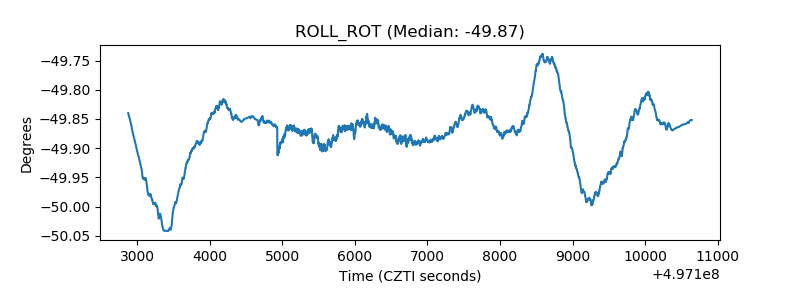 |
| _Roll_DEC | 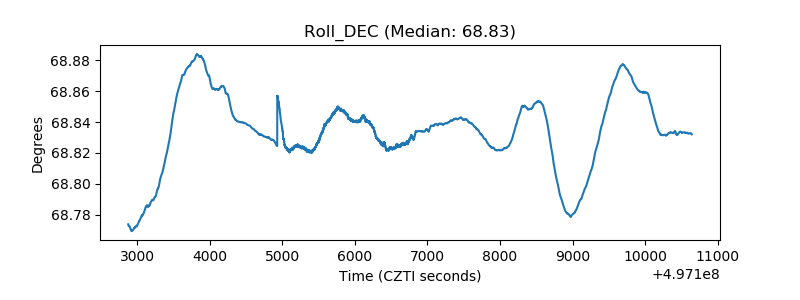 |
| _Roll_RA | 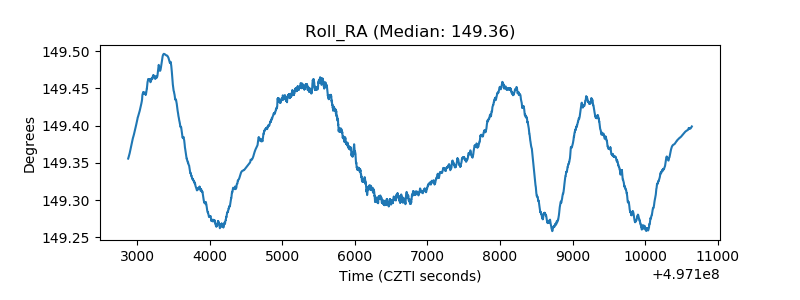 |
| Veto Counter | 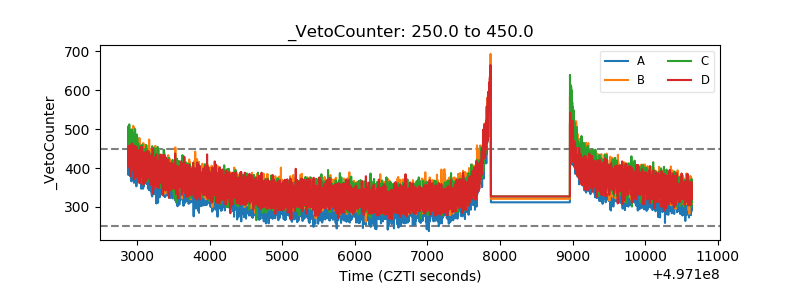 |