| Param | Original file | Final file |
|---|---|---|
| Filename | modeM0/AS1A14_012T01_9000006512_54169cztM0_level2.fits | modeM0/AS1A14_012T01_9000006512_54169cztM0_level2_quad_clean.evt |
| Size (bytes) | 548,760,960 | 83,603,520 |
| Size | 523.3 MB | 79.7 MB |
| Events in quadrant A | 3,260,259 | 595,526 |
| Events in quadrant B | 6,069,649 | 544,102 |
| Events in quadrant C | 3,823,113 | 558,716 |
| Events in quadrant D | 6,679,520 | 401,140 |
| Mode SS | |||
|---|---|---|---|
| Quadrant | BADHDUFLAG | Total packets | Discarded packets |
| A | 0 | 126 | 0 |
| B | 0 | 126 | 0 |
| C | 0 | 126 | 0 |
| D | 0 | 126 | 0 |
| Mode M0 | |||
|---|---|---|---|
| Quadrant | BADHDUFLAG | Total packets | Discarded packets |
| A | 0 | 13988 | 1 |
| B | 0 | 22418 | 1 |
| C | 0 | 15579 | 1 |
| D | 0 | 24313 | 1 |
| Mode M9 | |||
|---|---|---|---|
| Quadrant | BADHDUFLAG | Total packets | Discarded packets |
| A | 0 | 10 | 0 |
| B | 0 | 10 | 0 |
| C | 0 | 10 | 0 |
| D | 0 | 10 | 0 |
| Quadrant | Total seconds | Saturated seconds | Saturation percentage |
|---|---|---|---|
| A | 6186 | 134 | 2.166182% |
| B | 6186 | 1078 | 17.426447% |
| C | 6186 | 152 | 2.457161% |
| D | 6186 | 1623 | 26.236663% |
Noise dominated data is calculated using 1-second bins in cleaned event files. If a bin has >2000 counts, and if more than 50% of those come from <1% of pixels, then it is considered to be noise-dominated and hence unusable.
| Quadrant | # 1 sec bins | Bins with >0 counts | Bins with >2000 counts | High rate bins dominated by noise | Noise dominated (total time) | Noise dominated (detector-on time) | Marked lightcurve |
|---|---|---|---|---|---|---|---|
| A | 7216 | 6187 | 83 | 83 | 1.15% | 1.34% | 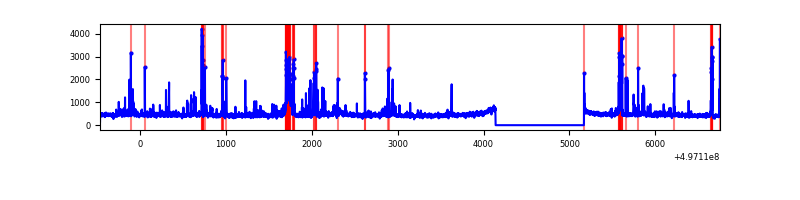 |
| B | 7216 | 6187 | 676 | 676 | 9.37% | 10.93% | 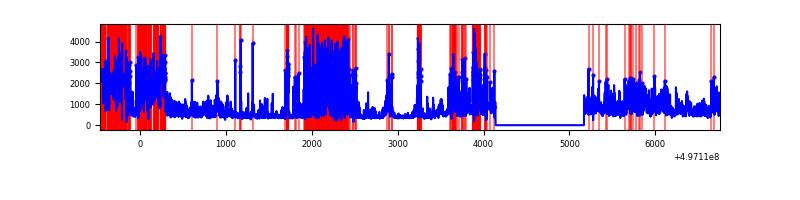 |
| C | 7216 | 6187 | 91 | 91 | 1.26% | 1.47% | 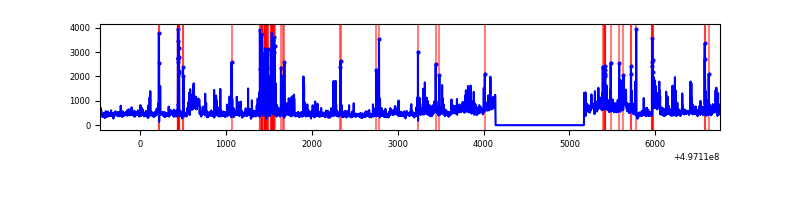 |
| D | 7216 | 6187 | 1323 | 1323 | 18.33% | 21.38% | 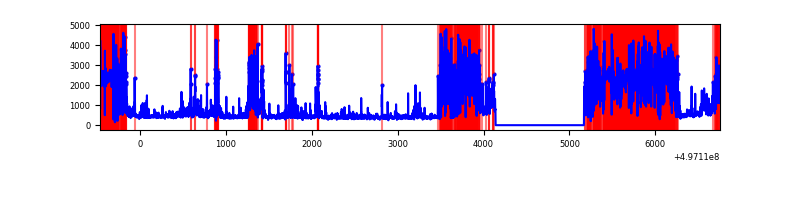 |
Top three noisy pixels from each quadrant. If the there are fewer than three noisy pixels in the level2.evt file, extra rows are filled as -1
| Pixel properties | Quadrant properties | ||||||
|---|---|---|---|---|---|---|---|
| Quadrant | DetID | PixID | Counts | Sigma | Mean | Median | Sigma |
| A | 7 | 29 | 181420 | 1106.04 | 650 | 633 | 163.5 |
| A | 15 | 174 | 134840 | 821.06 | 650 | 633 | 163.5 |
| A | 3 | 14 | 117187 | 713.06 | 650 | 633 | 163.5 |
| B | 5 | 172 | 1210800 | 9566.26 | 593 | 573 | 126.5 |
| B | 15 | 20 | 822843 | 6499.65 | 593 | 573 | 126.5 |
| B | 6 | 255 | 780063 | 6161.49 | 593 | 573 | 126.5 |
| C | 10 | 171 | 360941 | 2081.4 | 629 | 624 | 173.1 |
| C | 9 | 38 | 296859 | 1711.23 | 629 | 624 | 173.1 |
| C | 12 | 252 | 255265 | 1470.96 | 629 | 624 | 173.1 |
| D | 8 | 176 | 4003058 | 26711.75 | 522 | 496 | 149.8 |
| D | 3 | 12 | 394333 | 2628.34 | 522 | 496 | 149.8 |
| D | 5 | 173 | 41395 | 272.95 | 522 | 496 | 149.8 |
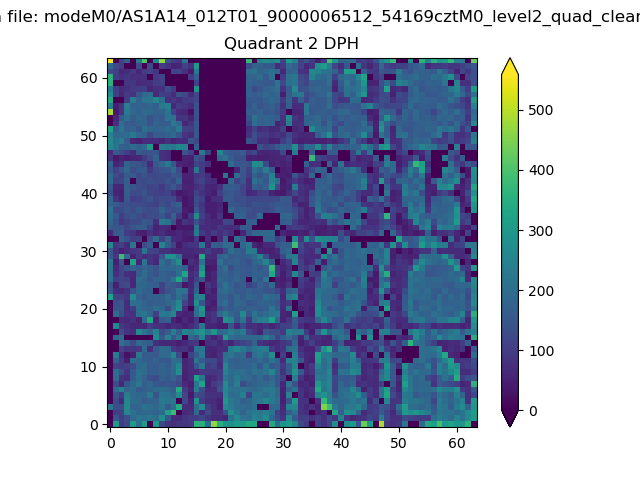
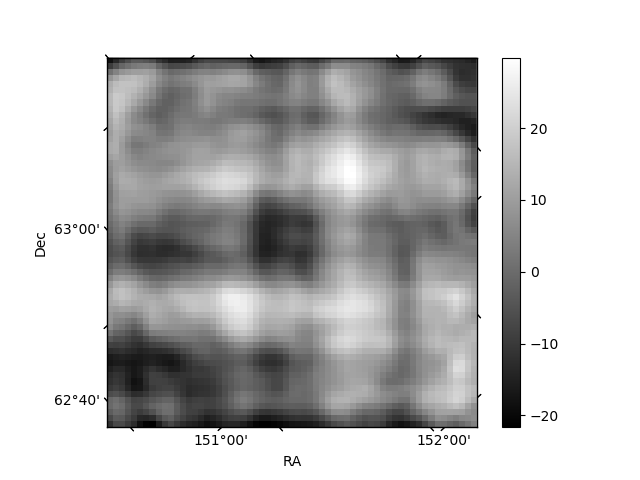
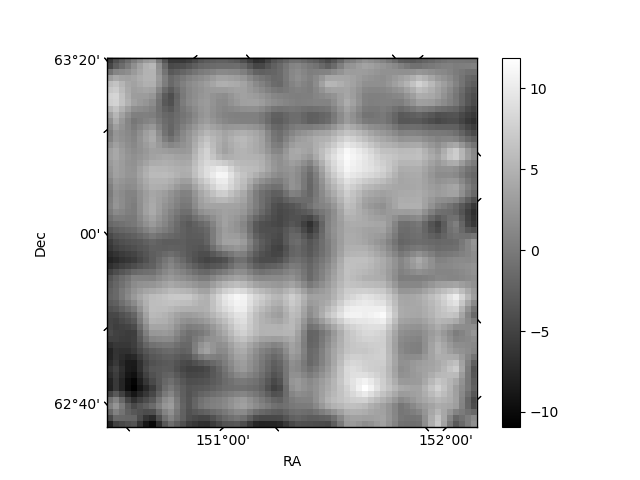
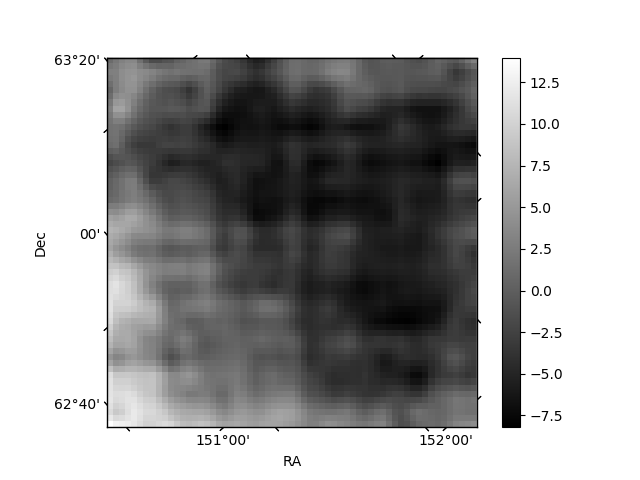
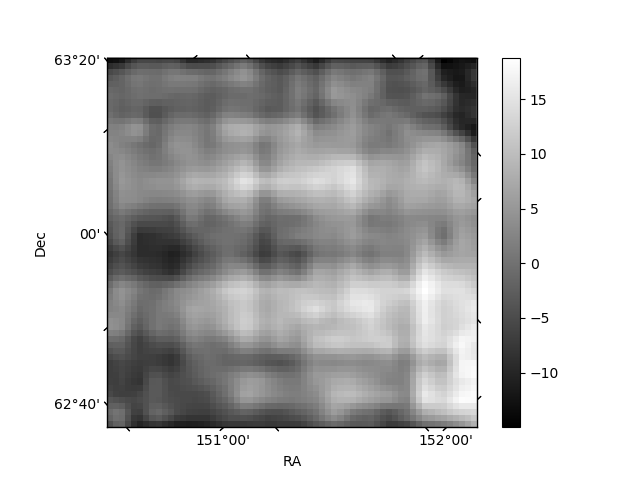
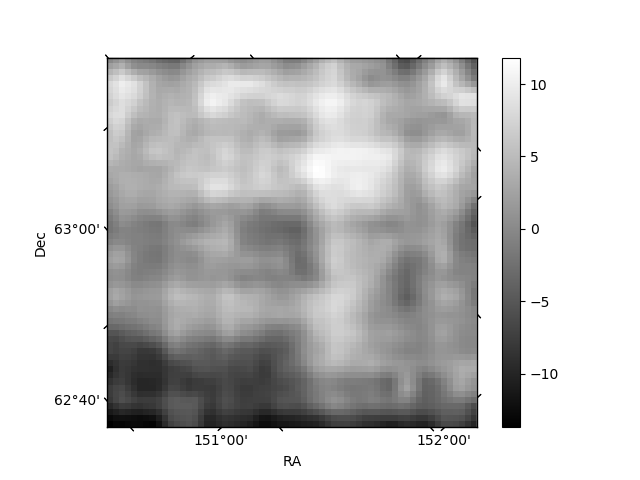
Histogram calculated using DETX and DETY for each event in the final _common_clean file
| Quadrant A | 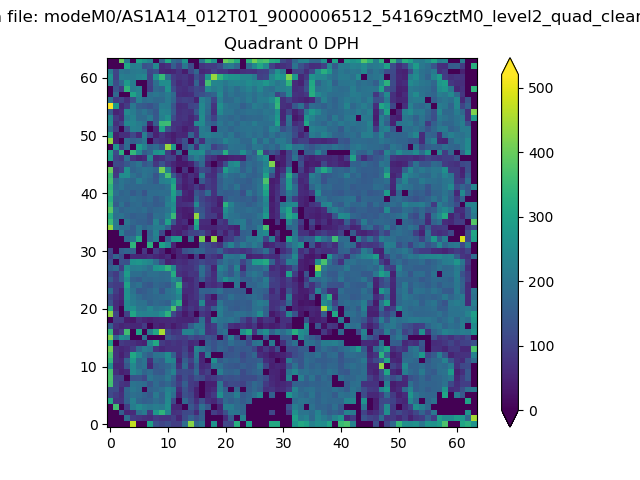 |
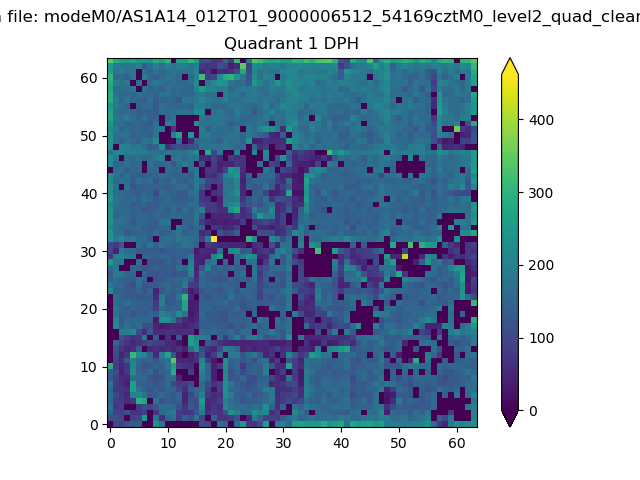 |
Quadrant B |
|---|---|---|---|
| Quadrant D | 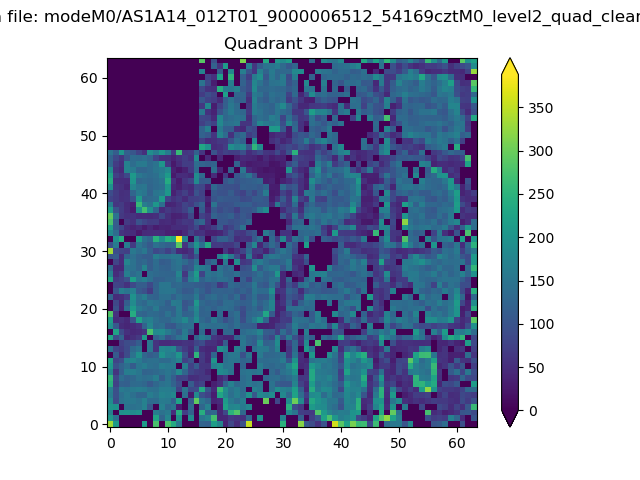 |
 |
Quadrant C |
| Plot type | Count rate plots | Images |
|---|---|---|
| Comparison with Poisson distribution Blue bars denote a histogram of data divided into 1 sec bins. Red curve is a Poisson curve with rate = median count rate of data. |
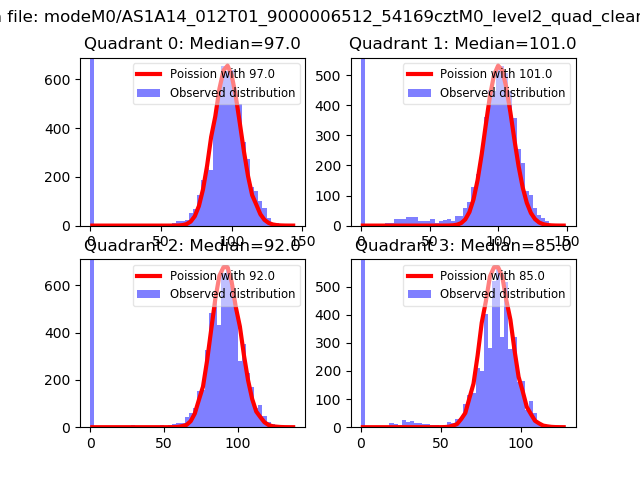 |
 |
| Quadrant-wise count rates Data is divided into 100 sec bins |
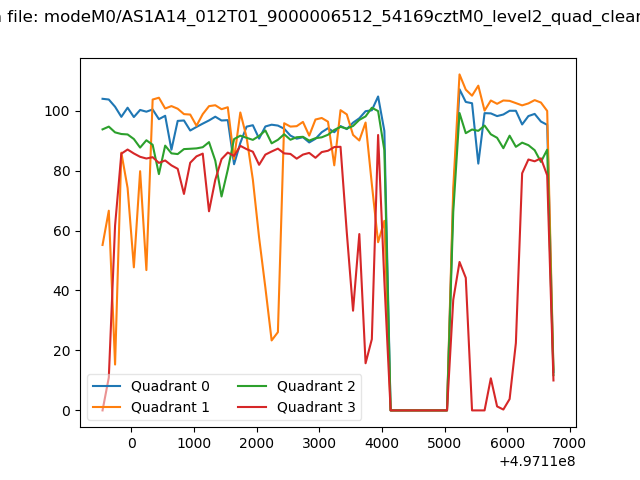 |
|
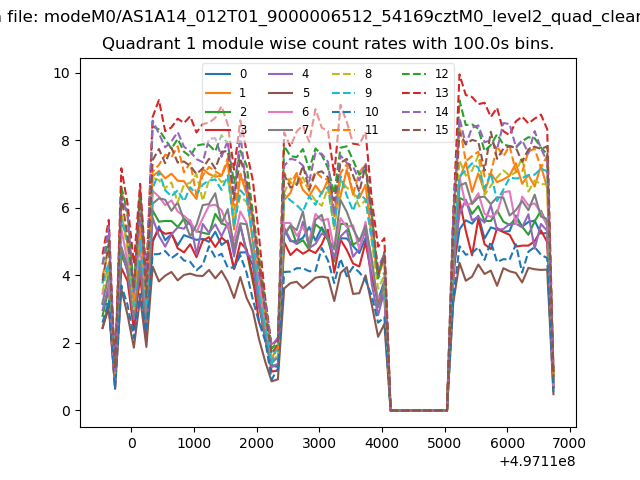
| Module-wise count rates for Quadrant A Data is divided into 100 sec bins |
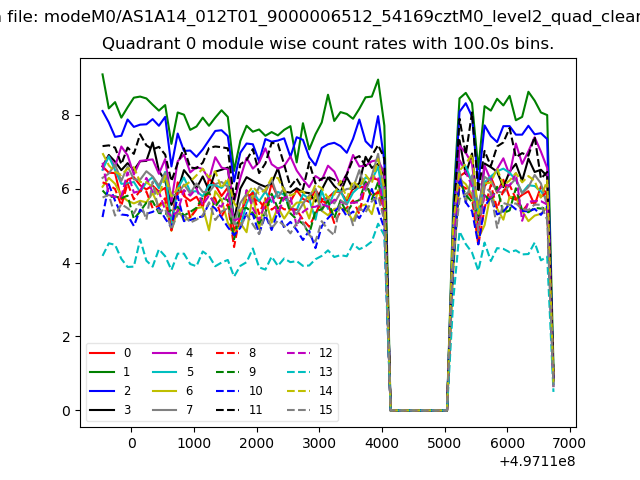 |
 |
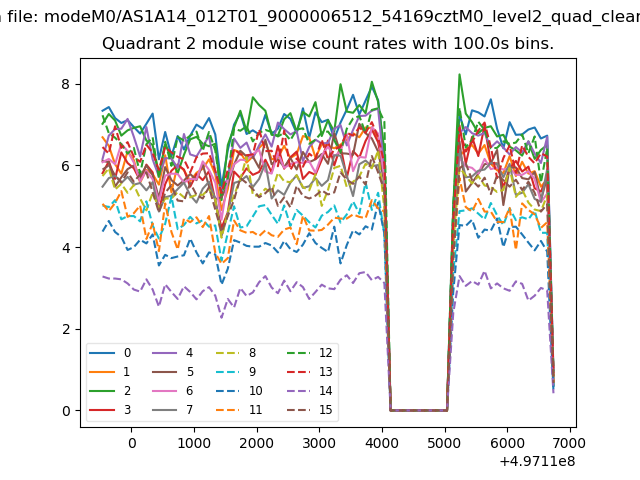
| Module-wise count rates for Quadrant B Data is divided into 100 sec bins |
 |
 |
| Module-wise count rates for Quadrant C Data is divided into 100 sec bins |
 |
 |
| Module-wise count rates for Quadrant D Data is divided into 100 sec bins |
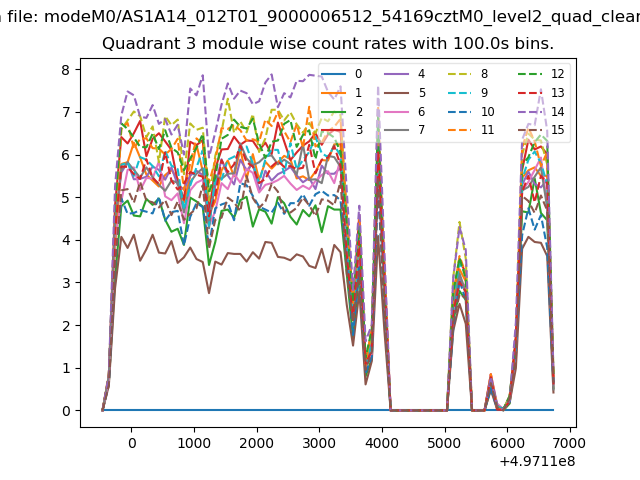 |
 |
| Parameter | Plot |
|---|---|
| CZT HV Monitor | 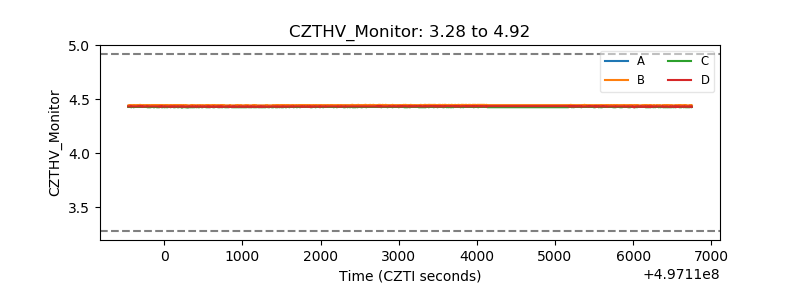 |
| D_VDD | 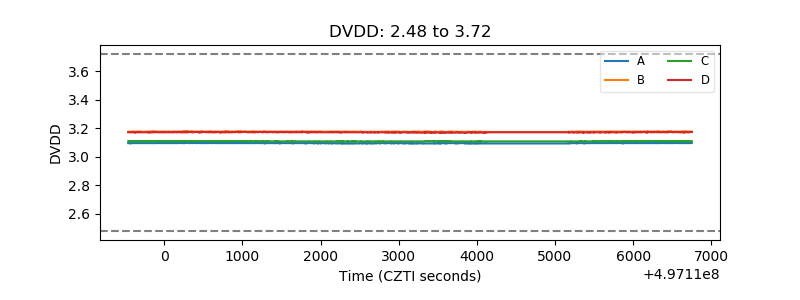 |
| Temperature 1 | 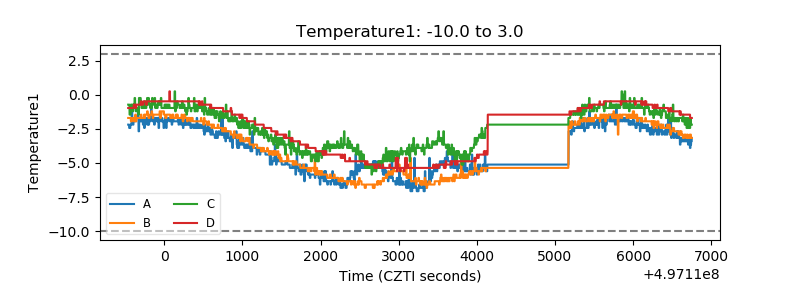 |
| Veto HV Monitor | 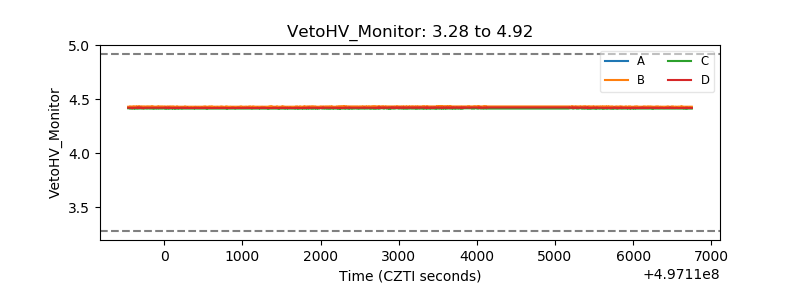 |
| Veto LLD | 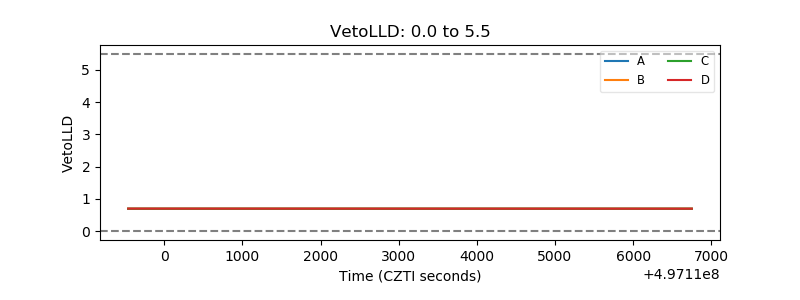 |
| Alpha Counter | 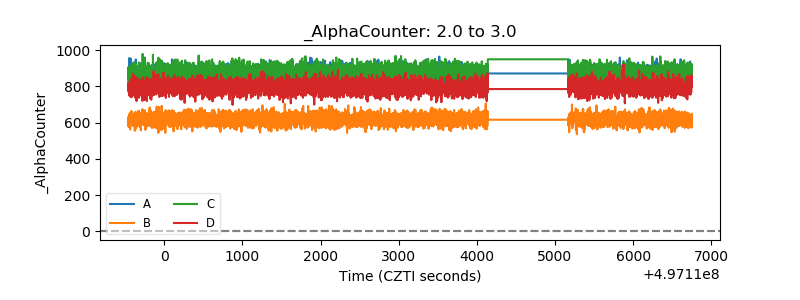 |
| _CPM_Rate | 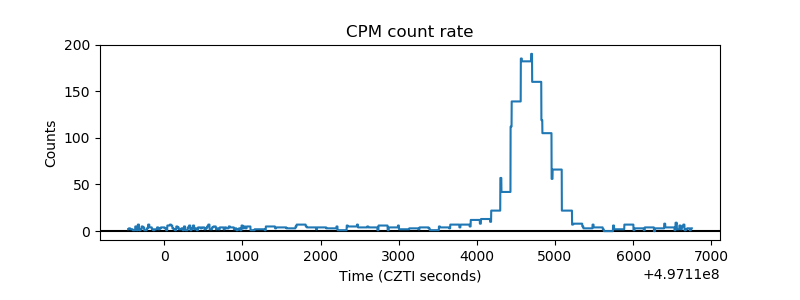 |
| CZT Counter | 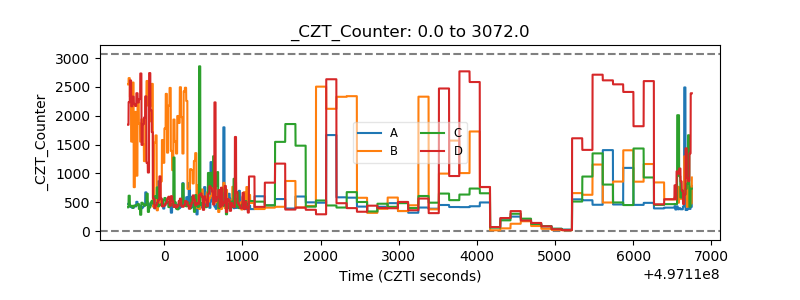 |
| +2.5 Volts monitor |  |
| +5 Volts monitor | 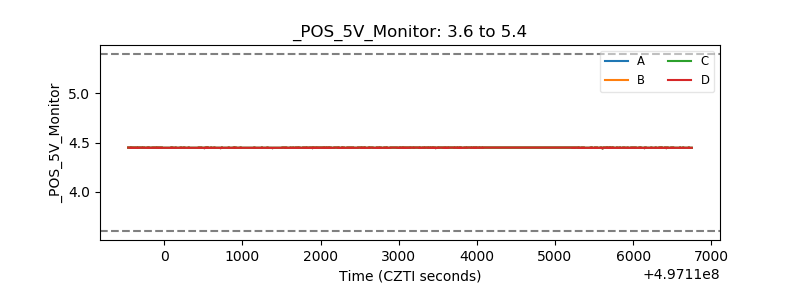 |
| _ROLL_ROT | 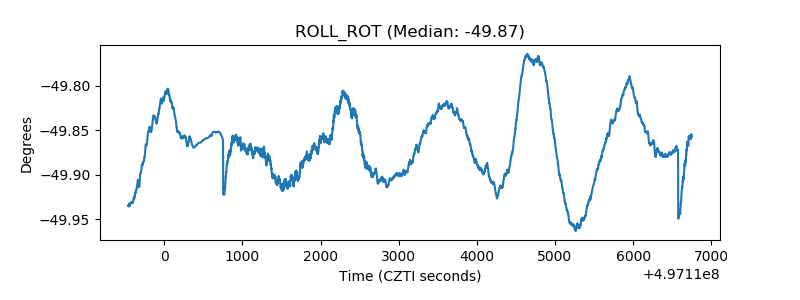 |
| _Roll_DEC | 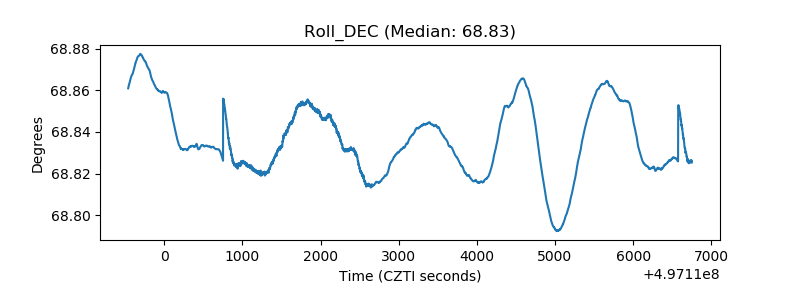 |
| _Roll_RA | 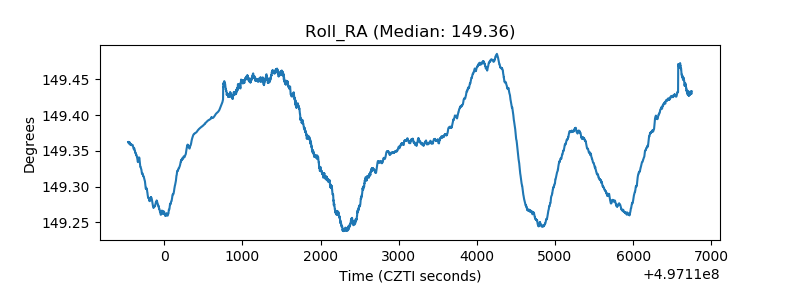 |
| Veto Counter | 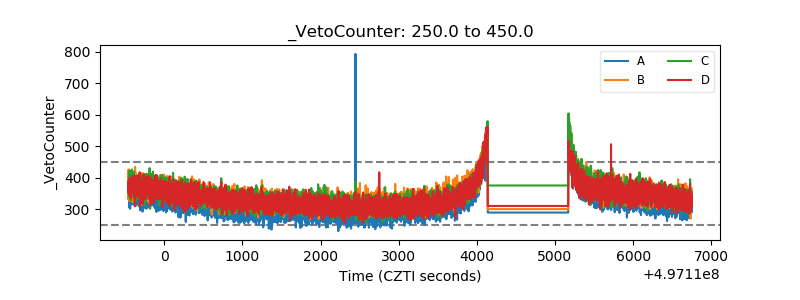 |