| Param | Original file | Final file |
|---|---|---|
| Filename | modeM0/AS1A14_012T01_9000006512_54170cztM0_level2.fits | modeM0/AS1A14_012T01_9000006512_54170cztM0_level2_quad_clean.evt |
| Size (bytes) | 673,764,480 | 86,878,080 |
| Size | 642.6 MB | 82.9 MB |
| Events in quadrant A | 4,328,602 | 604,602 |
| Events in quadrant B | 5,947,999 | 641,044 |
| Events in quadrant C | 4,530,094 | 590,044 |
| Events in quadrant D | 9,619,495 | 332,420 |
| Mode SS | |||
|---|---|---|---|
| Quadrant | BADHDUFLAG | Total packets | Discarded packets |
| A | 0 | 134 | 0 |
| B | 0 | 134 | 0 |
| C | 0 | 134 | 0 |
| D | 0 | 134 | 0 |
| Mode M0 | |||
|---|---|---|---|
| Quadrant | BADHDUFLAG | Total packets | Discarded packets |
| A | 0 | 17741 | 1 |
| B | 0 | 22313 | 1 |
| C | 0 | 17846 | 1 |
| D | 0 | 33277 | 1 |
| Mode M9 | |||
|---|---|---|---|
| Quadrant | BADHDUFLAG | Total packets | Discarded packets |
| A | 0 | 7 | 0 |
| B | 0 | 7 | 0 |
| C | 0 | 7 | 0 |
| D | 0 | 7 | 0 |
| Quadrant | Total seconds | Saturated seconds | Saturation percentage |
|---|---|---|---|
| A | 6631 | 471 | 7.103001% |
| B | 6632 | 529 | 7.976478% |
| C | 6632 | 308 | 4.644150% |
| D | 6632 | 2827 | 42.626659% |
Noise dominated data is calculated using 1-second bins in cleaned event files. If a bin has >2000 counts, and if more than 50% of those come from <1% of pixels, then it is considered to be noise-dominated and hence unusable.
| Quadrant | # 1 sec bins | Bins with >0 counts | Bins with >2000 counts | High rate bins dominated by noise | Noise dominated (total time) | Noise dominated (detector-on time) | Marked lightcurve |
|---|---|---|---|---|---|---|---|
| A | 7331 | 6632 | 309 | 309 | 4.21% | 4.66% | 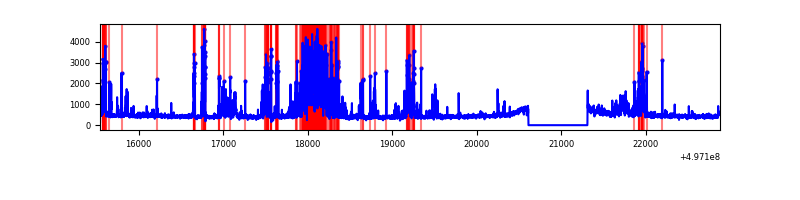 |
| B | 7332 | 6633 | 178 | 178 | 2.43% | 2.68% | 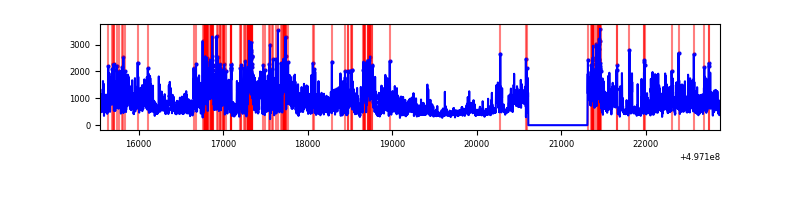 |
| C | 7332 | 6633 | 200 | 200 | 2.73% | 3.02% | 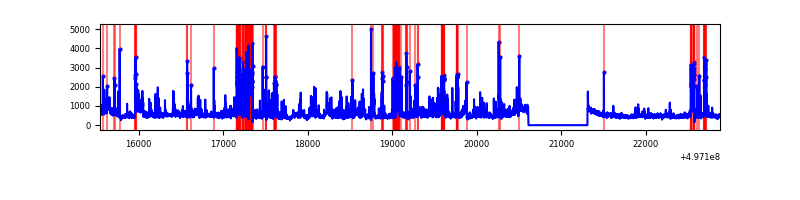 |
| D | 7332 | 6632 | 2182 | 2182 | 29.76% | 32.90% | 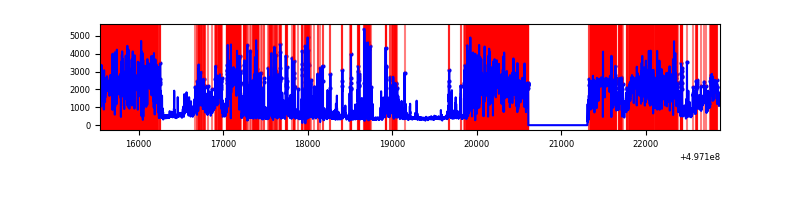 |
Top three noisy pixels from each quadrant. If the there are fewer than three noisy pixels in the level2.evt file, extra rows are filled as -1
| Pixel properties | Quadrant properties | ||||||
|---|---|---|---|---|---|---|---|
| Quadrant | DetID | PixID | Counts | Sigma | Mean | Median | Sigma |
| A | 7 | 29 | 826878 | 4857.49 | 686 | 667 | 170.1 |
| A | 15 | 174 | 328537 | 1927.63 | 686 | 667 | 170.1 |
| A | 0 | 8 | 238747 | 1399.73 | 686 | 667 | 170.1 |
| B | 15 | 20 | 2131130 | 14856.67 | 675 | 651 | 143.4 |
| B | 5 | 172 | 579006 | 4033.1 | 675 | 651 | 143.4 |
| B | 4 | 171 | 235497 | 1637.67 | 675 | 651 | 143.4 |
| C | 15 | 177 | 1009417 | 5497.23 | 676 | 669 | 183.5 |
| C | 9 | 38 | 309767 | 1684.45 | 676 | 669 | 183.5 |
| C | 10 | 171 | 252885 | 1374.47 | 676 | 669 | 183.5 |
| D | 8 | 176 | 6551086 | 49880.82 | 454 | 432 | 131.3 |
| D | 2 | 165 | 506526 | 3853.72 | 454 | 432 | 131.3 |
| D | 3 | 144 | 281733 | 2142.0 | 454 | 432 | 131.3 |
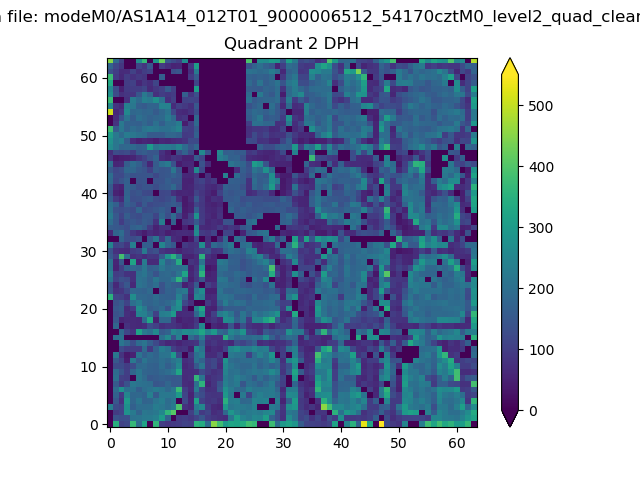
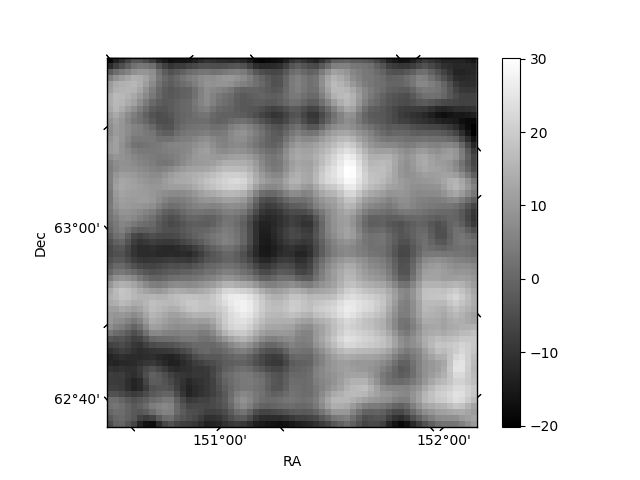
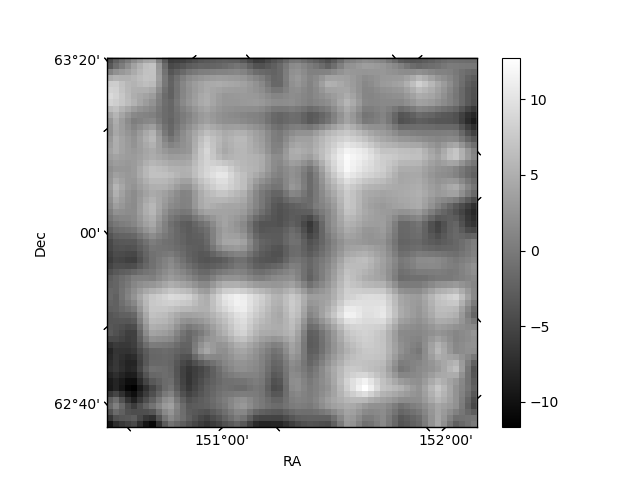
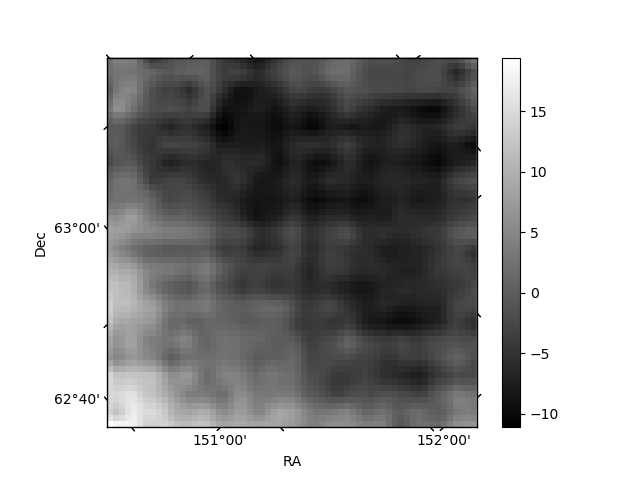
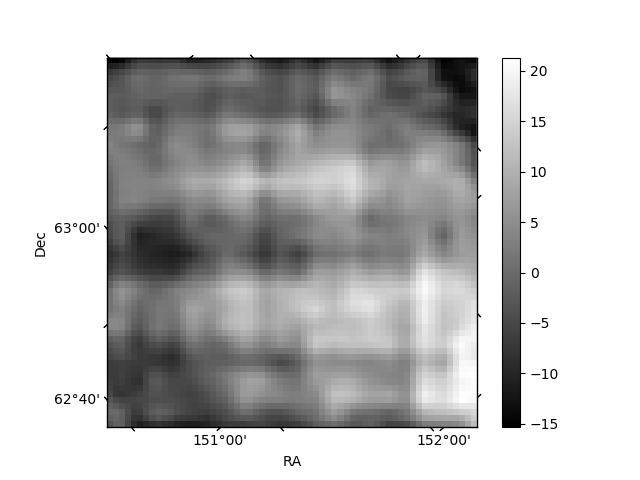
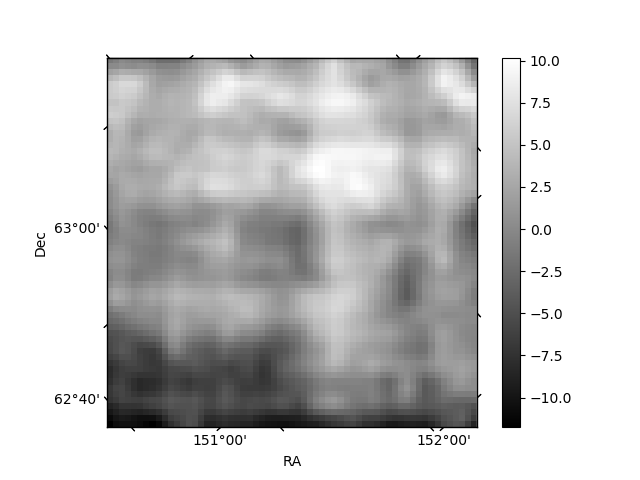
Histogram calculated using DETX and DETY for each event in the final _common_clean file
| Quadrant A | 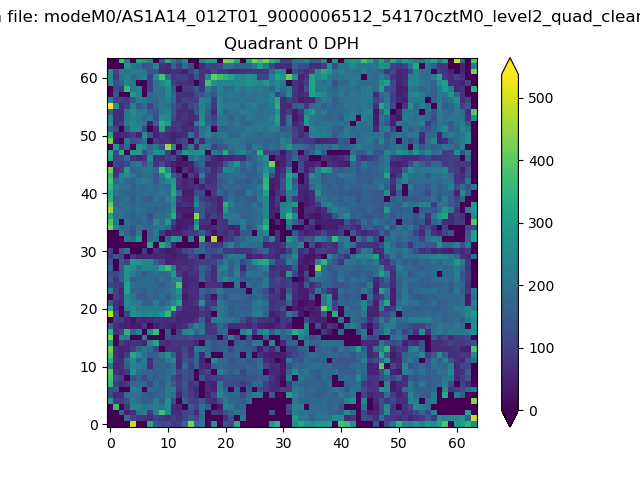 |
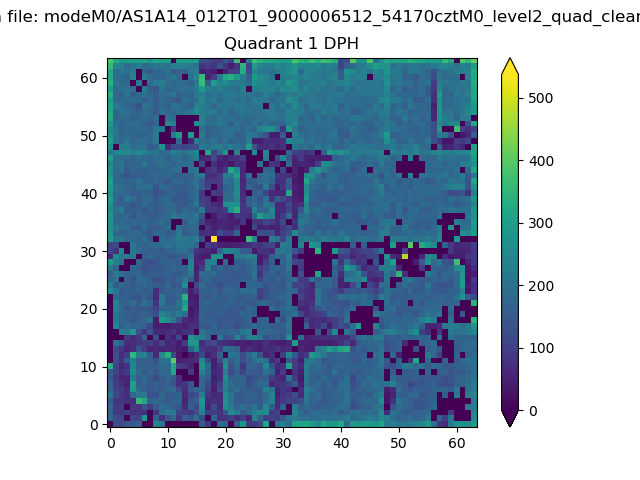 |
Quadrant B |
|---|---|---|---|
| Quadrant D | 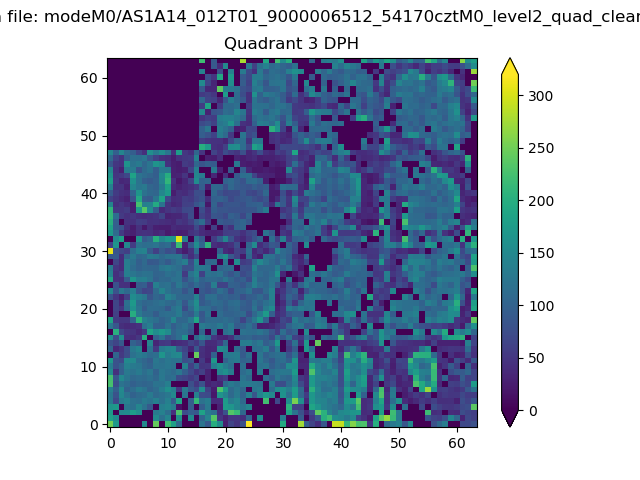 |
 |
Quadrant C |
| Plot type | Count rate plots | Images |
|---|---|---|
| Comparison with Poisson distribution Blue bars denote a histogram of data divided into 1 sec bins. Red curve is a Poisson curve with rate = median count rate of data. |
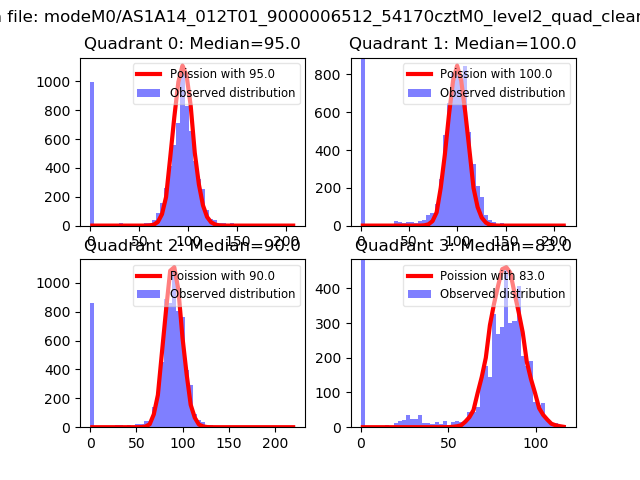 |
 |
| Quadrant-wise count rates Data is divided into 100 sec bins |
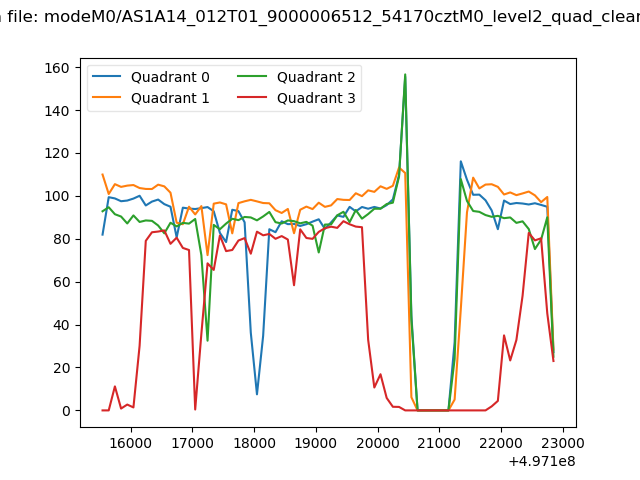 |
|
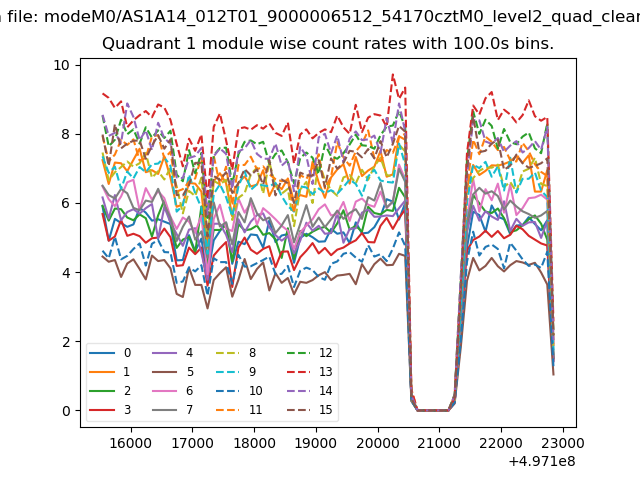
| Module-wise count rates for Quadrant A Data is divided into 100 sec bins |
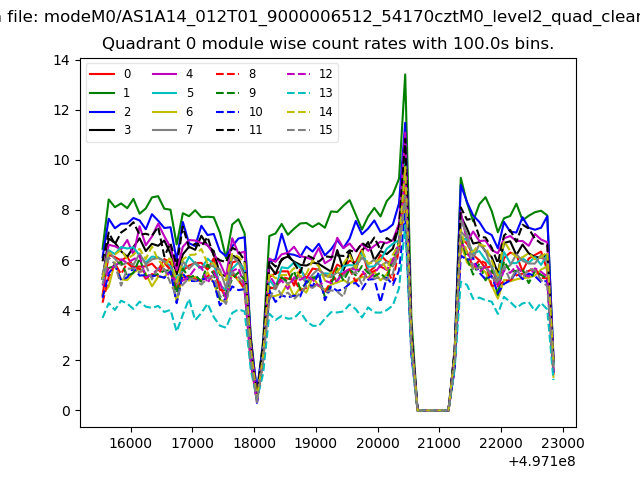 |
 |
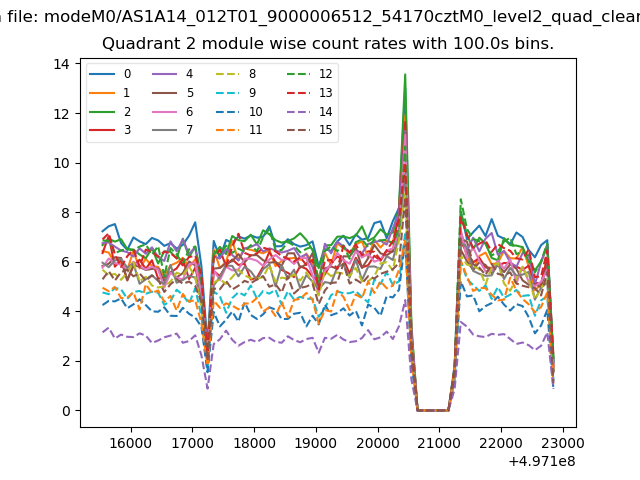
| Module-wise count rates for Quadrant B Data is divided into 100 sec bins |
 |
 |
| Module-wise count rates for Quadrant C Data is divided into 100 sec bins |
 |
 |
| Module-wise count rates for Quadrant D Data is divided into 100 sec bins |
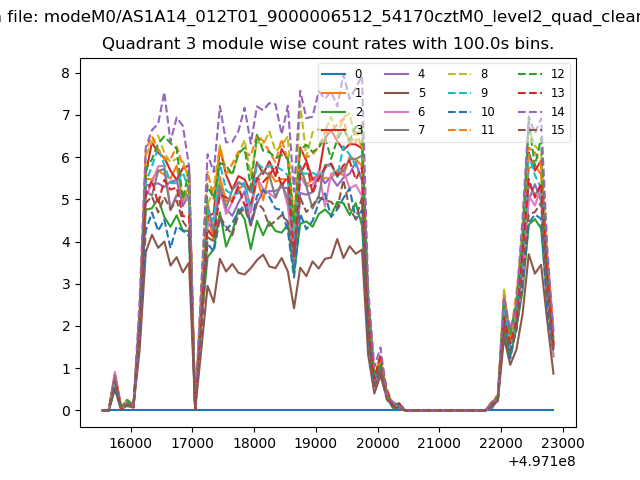 |
 |
| Parameter | Plot |
|---|---|
| CZT HV Monitor | 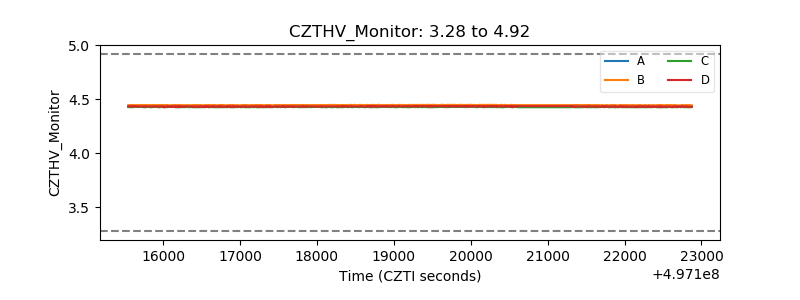 |
| D_VDD | 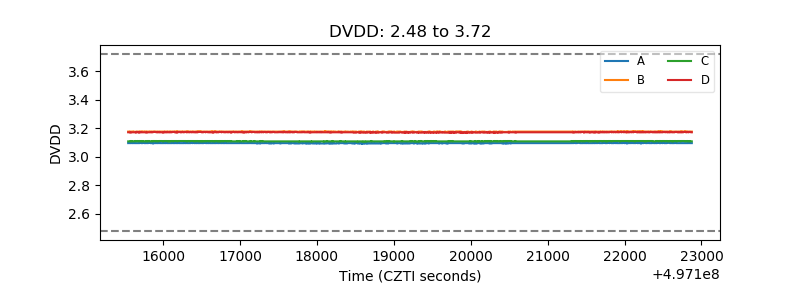 |
| Temperature 1 | 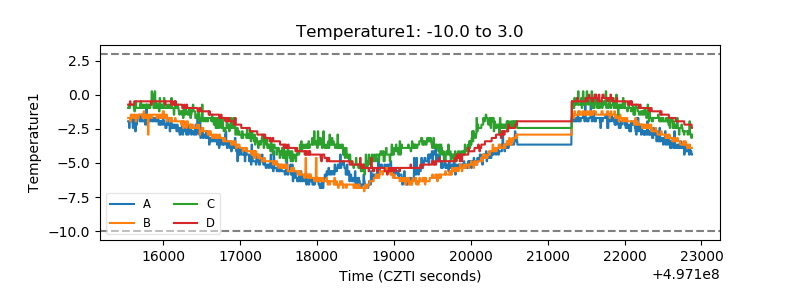 |
| Veto HV Monitor | 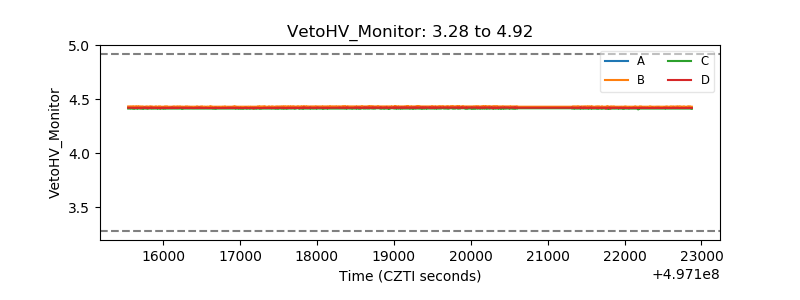 |
| Veto LLD | 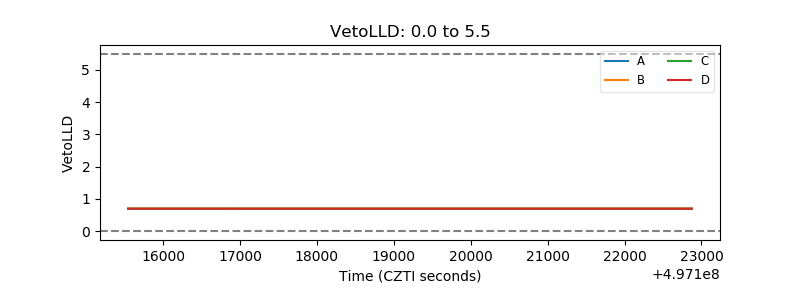 |
| Alpha Counter | 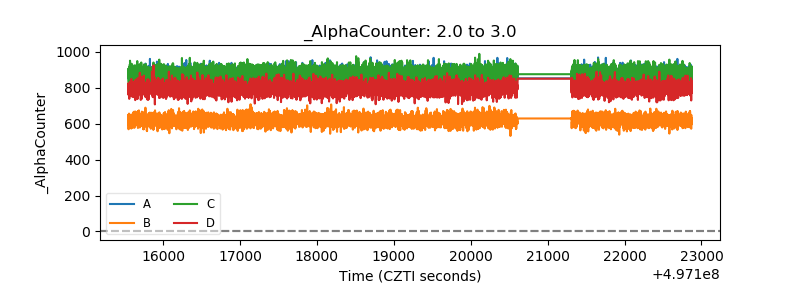 |
| _CPM_Rate | 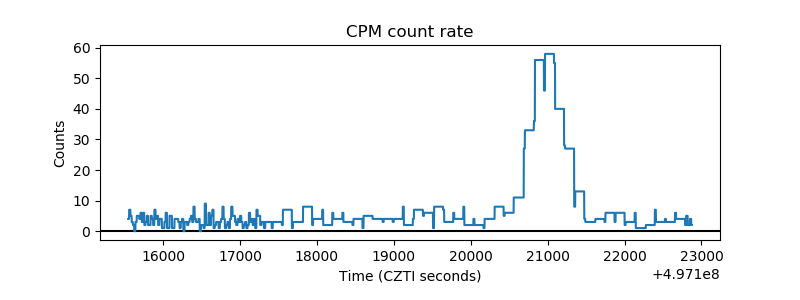 |
| CZT Counter | 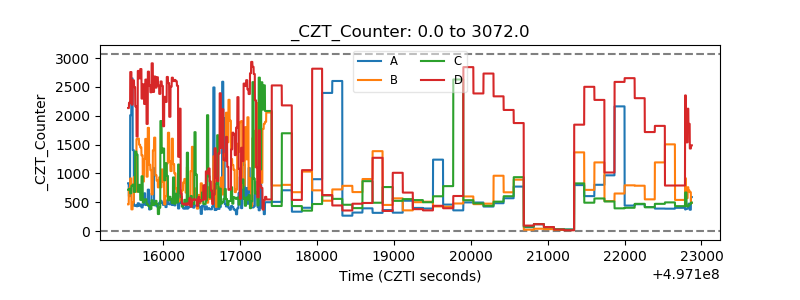 |
| +2.5 Volts monitor |  |
| +5 Volts monitor |  |
| _ROLL_ROT | 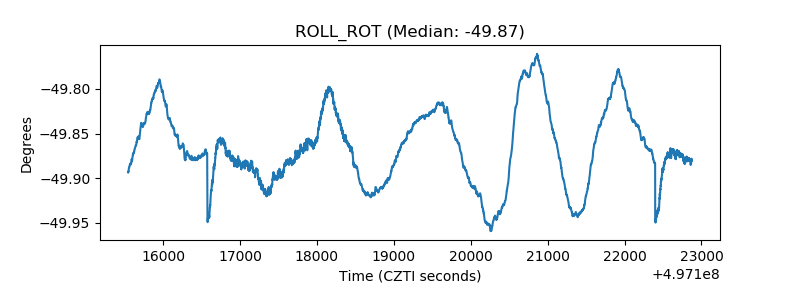 |
| _Roll_DEC | 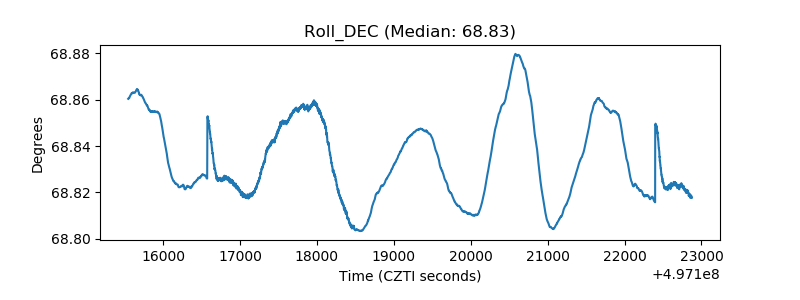 |
| _Roll_RA | 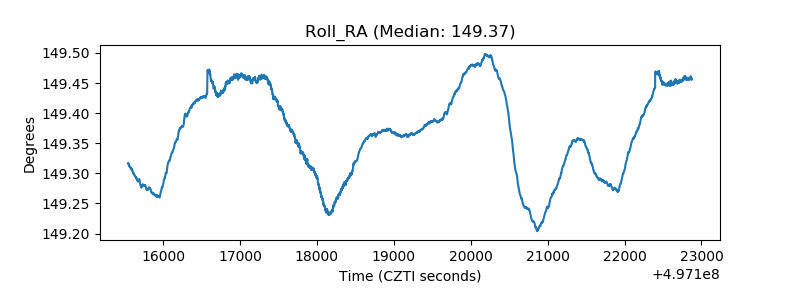 |
| Veto Counter | 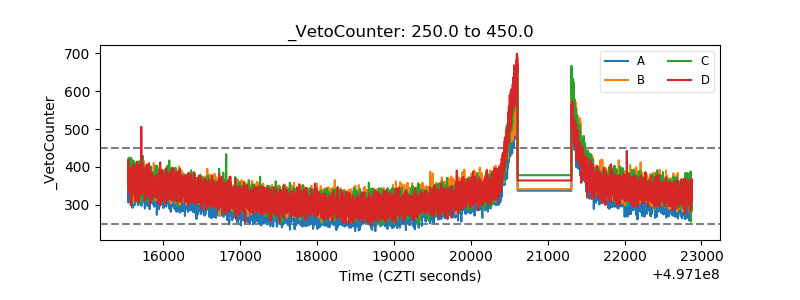 |