| Param | Original file | Final file |
|---|---|---|
| Filename | modeM0/AS1A14_012T01_9000006512_54171cztM0_level2.fits | modeM0/AS1A14_012T01_9000006512_54171cztM0_level2_quad_clean.evt |
| Size (bytes) | 836,006,400 | 92,911,680 |
| Size | 797.3 MB | 88.6 MB |
| Events in quadrant A | 5,172,016 | 672,331 |
| Events in quadrant B | 6,255,610 | 692,335 |
| Events in quadrant C | 4,814,679 | 668,557 |
| Events in quadrant D | 14,121,317 | 257,001 |
| Mode SS | |||
|---|---|---|---|
| Quadrant | BADHDUFLAG | Total packets | Discarded packets |
| A | 0 | 152 | 0 |
| B | 0 | 152 | 0 |
| C | 0 | 152 | 0 |
| D | 0 | 152 | 0 |
| Mode M0 | |||
|---|---|---|---|
| Quadrant | BADHDUFLAG | Total packets | Discarded packets |
| A | 0 | 20953 | 2 |
| B | 0 | 23845 | 2 |
| C | 0 | 19461 | 2 |
| D | 0 | 47147 | 2 |
| Mode M9 | |||
|---|---|---|---|
| Quadrant | BADHDUFLAG | Total packets | Discarded packets |
| A | 0 | 2 | 0 |
| B | 0 | 3 | 0 |
| C | 0 | 3 | 0 |
| D | 0 | 3 | 0 |
| Quadrant | Total seconds | Saturated seconds | Saturation percentage |
|---|---|---|---|
| A | 7512 | 655 | 8.719382% |
| B | 7512 | 944 | 12.566560% |
| C | 7512 | 342 | 4.552716% |
| D | 7512 | 4641 | 61.781150% |
Noise dominated data is calculated using 1-second bins in cleaned event files. If a bin has >2000 counts, and if more than 50% of those come from <1% of pixels, then it is considered to be noise-dominated and hence unusable.
| Quadrant | # 1 sec bins | Bins with >0 counts | Bins with >2000 counts | High rate bins dominated by noise | Noise dominated (total time) | Noise dominated (detector-on time) | Marked lightcurve |
|---|---|---|---|---|---|---|---|
| A | 7692 | 7513 | 388 | 388 | 5.04% | 5.16% | 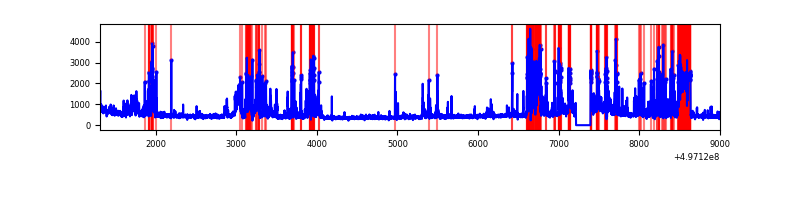 |
| B | 7692 | 7513 | 531 | 531 | 6.90% | 7.07% | 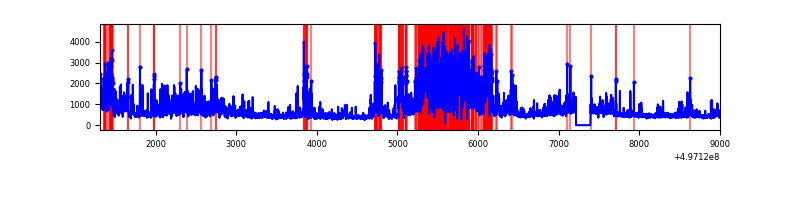 |
| C | 7692 | 7513 | 175 | 175 | 2.28% | 2.33% | 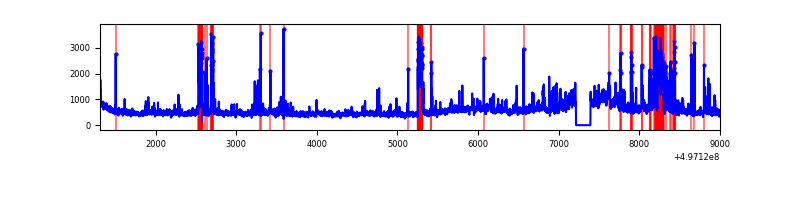 |
| D | 7692 | 7512 | 3774 | 3774 | 49.06% | 50.24% | 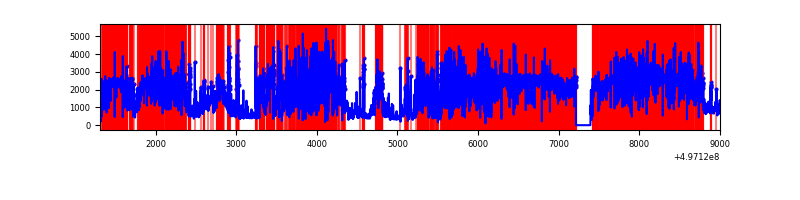 |
Top three noisy pixels from each quadrant. If the there are fewer than three noisy pixels in the level2.evt file, extra rows are filled as -1
| Pixel properties | Quadrant properties | ||||||
|---|---|---|---|---|---|---|---|
| Quadrant | DetID | PixID | Counts | Sigma | Mean | Median | Sigma |
| A | 7 | 29 | 1180737 | 6213.62 | 774 | 755 | 189.9 |
| A | 15 | 174 | 566043 | 2976.73 | 774 | 755 | 189.9 |
| A | 0 | 8 | 122884 | 643.11 | 774 | 755 | 189.9 |
| B | 4 | 171 | 1914804 | 11764.76 | 760 | 731 | 162.7 |
| B | 15 | 20 | 766001 | 4703.7 | 760 | 731 | 162.7 |
| B | 5 | 172 | 176425 | 1079.89 | 760 | 731 | 162.7 |
| C | 9 | 38 | 655641 | 3075.15 | 781 | 771 | 213.0 |
| C | 10 | 171 | 539645 | 2530.46 | 781 | 771 | 213.0 |
| C | 15 | 177 | 235174 | 1100.71 | 781 | 771 | 213.0 |
| D | 8 | 176 | 10938073 | 88960.95 | 425 | 405 | 122.9 |
| D | 2 | 165 | 856926 | 6966.47 | 425 | 405 | 122.9 |
| D | 11 | 176 | 165110 | 1339.62 | 425 | 405 | 122.9 |
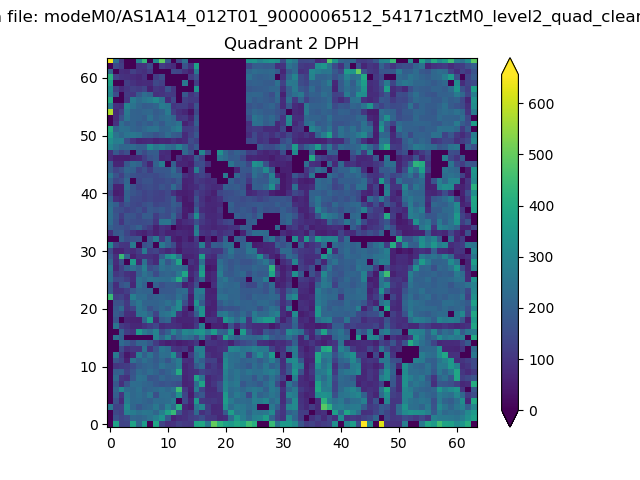
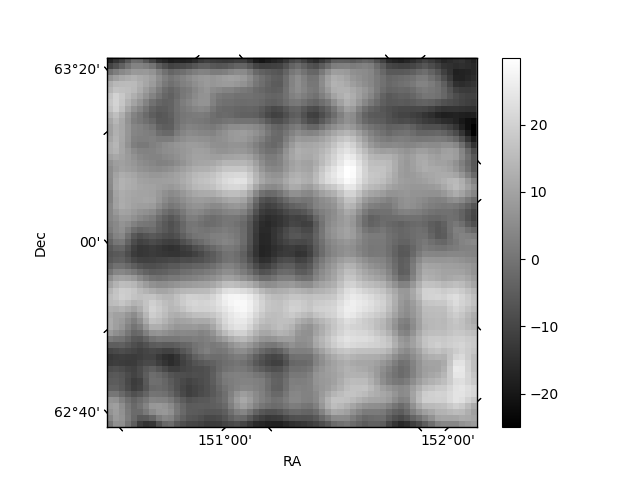
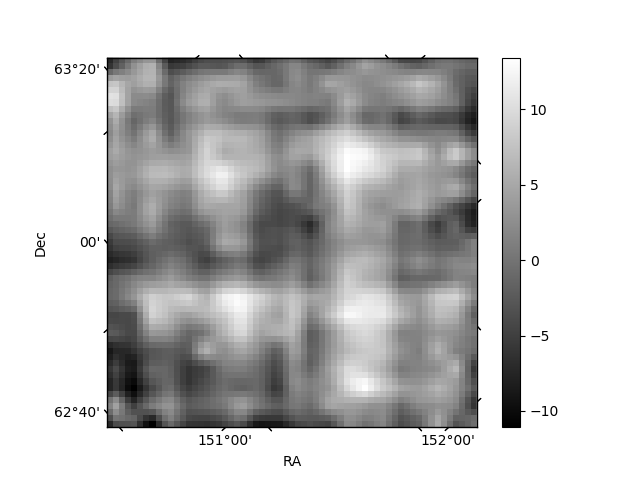
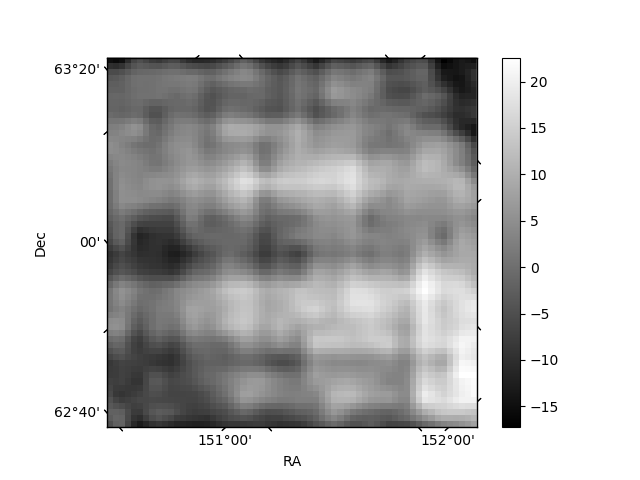
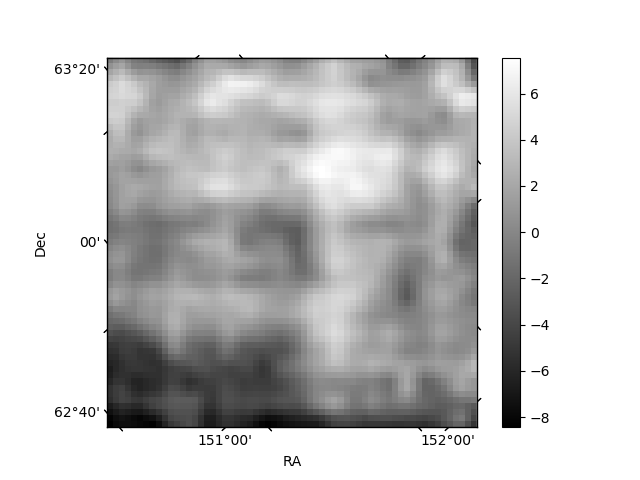
Histogram calculated using DETX and DETY for each event in the final _common_clean file
| Quadrant A | 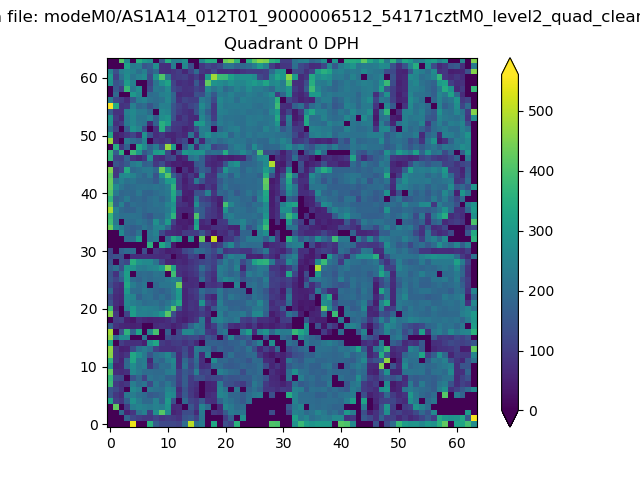 |
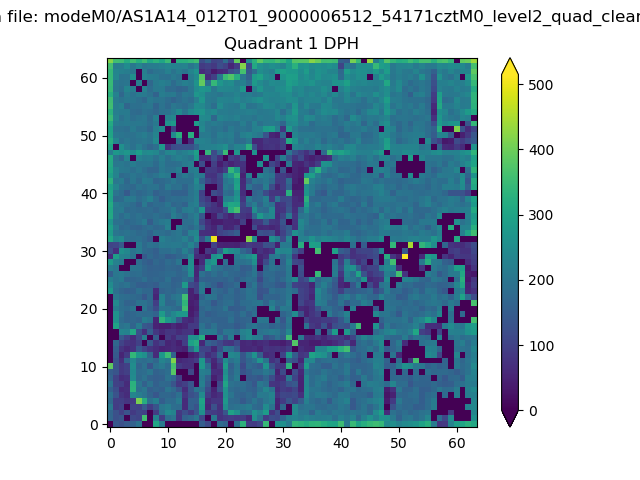 |
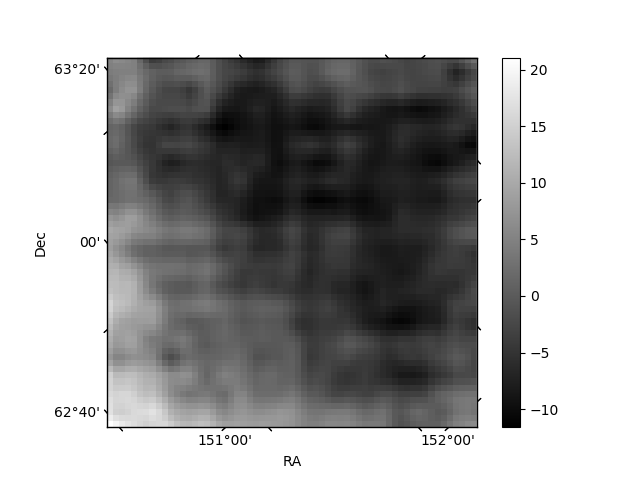
Quadrant B |
|---|---|---|---|
| Quadrant D | 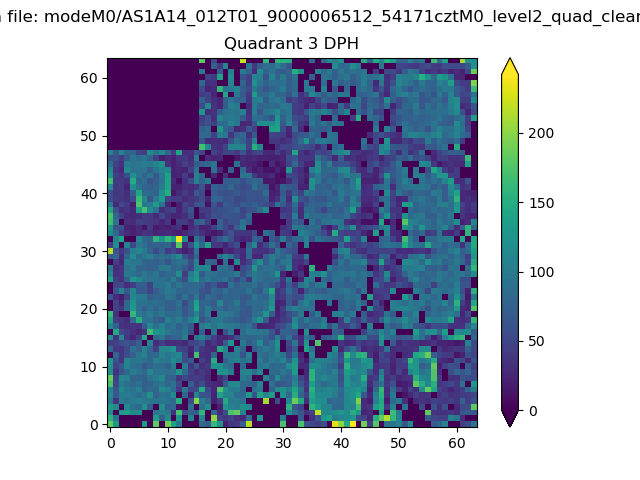 |
 |
Quadrant C |
| Plot type | Count rate plots | Images |
|---|---|---|
| Comparison with Poisson distribution Blue bars denote a histogram of data divided into 1 sec bins. Red curve is a Poisson curve with rate = median count rate of data. |
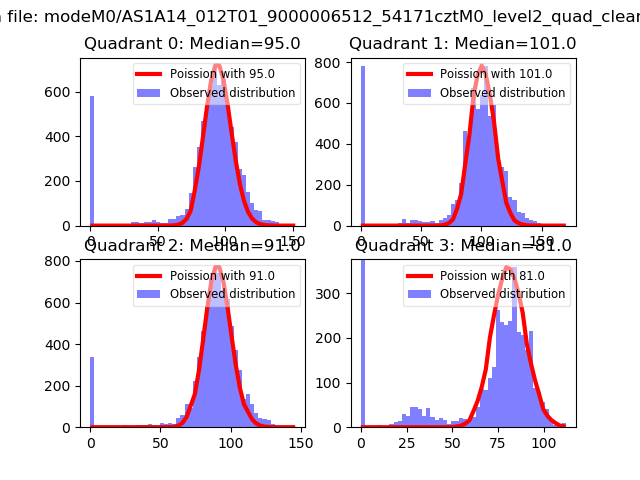 |
 |
| Quadrant-wise count rates Data is divided into 100 sec bins |
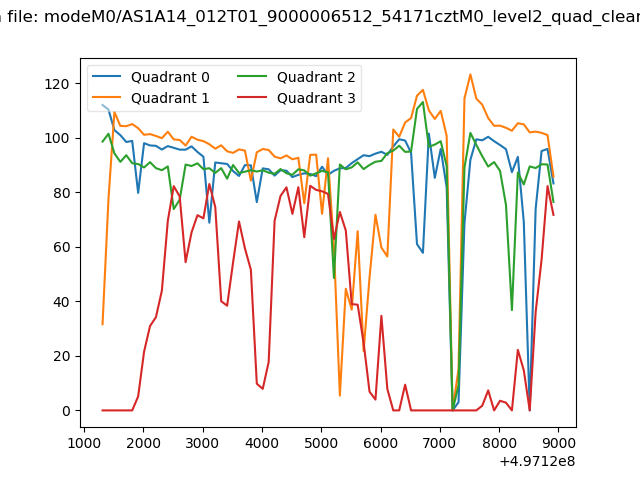 |
|
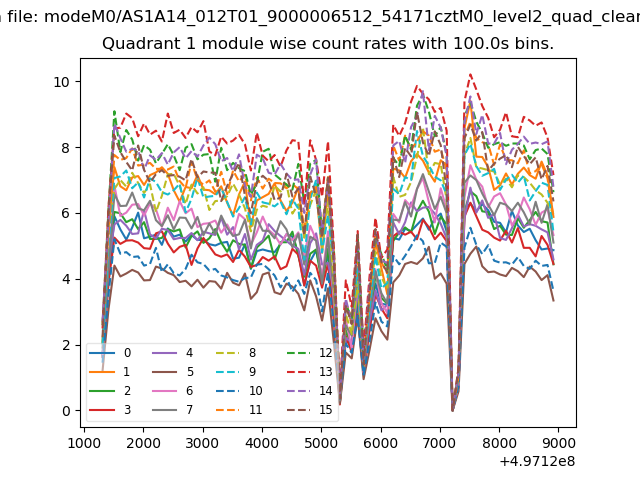
| Module-wise count rates for Quadrant A Data is divided into 100 sec bins |
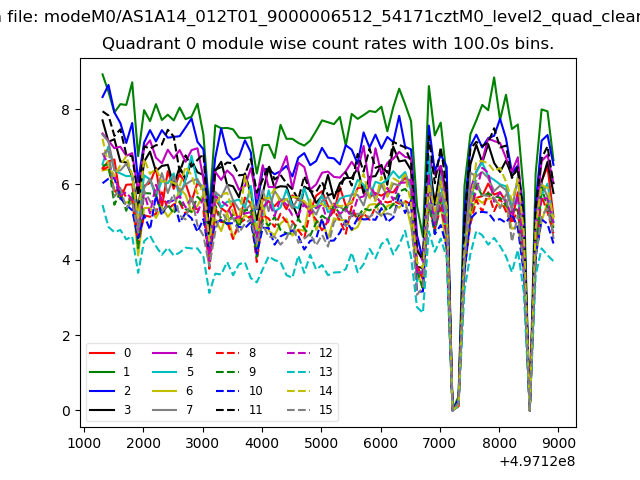 |
 |
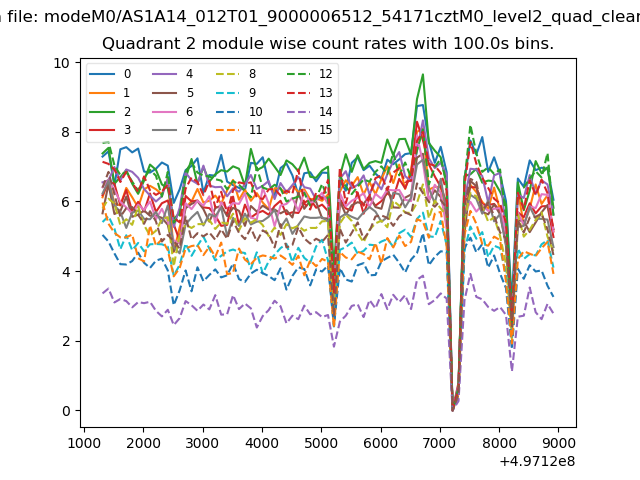
| Module-wise count rates for Quadrant B Data is divided into 100 sec bins |
 |
 |
| Module-wise count rates for Quadrant C Data is divided into 100 sec bins |
 |
 |
| Module-wise count rates for Quadrant D Data is divided into 100 sec bins |
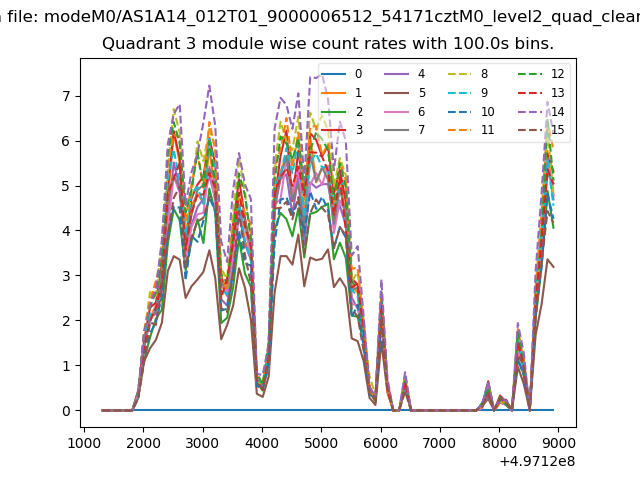 |
 |
| Parameter | Plot |
|---|---|
| CZT HV Monitor | 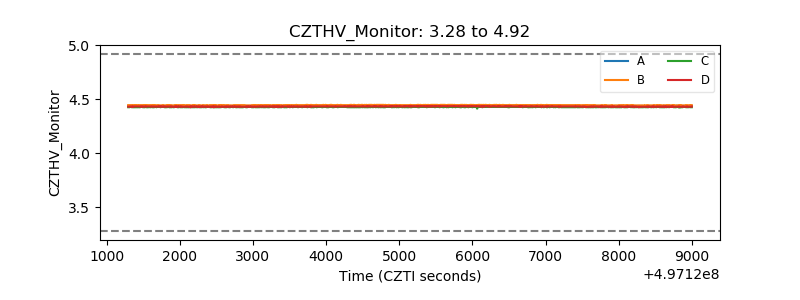 |
| D_VDD | 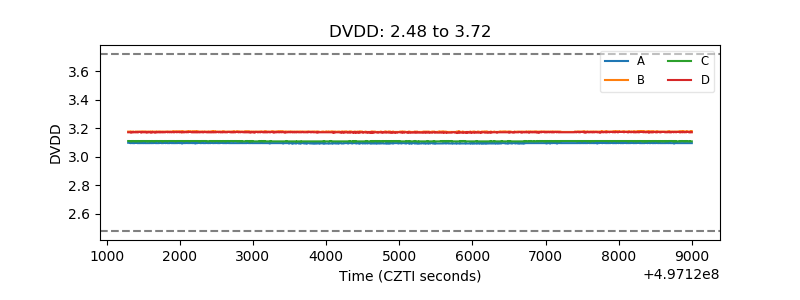 |
| Temperature 1 | 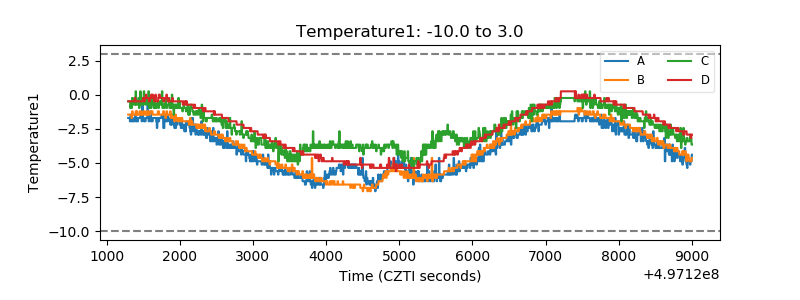 |
| Veto HV Monitor | 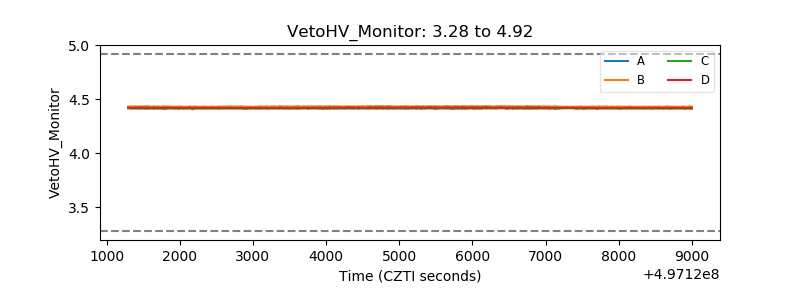 |
| Veto LLD | 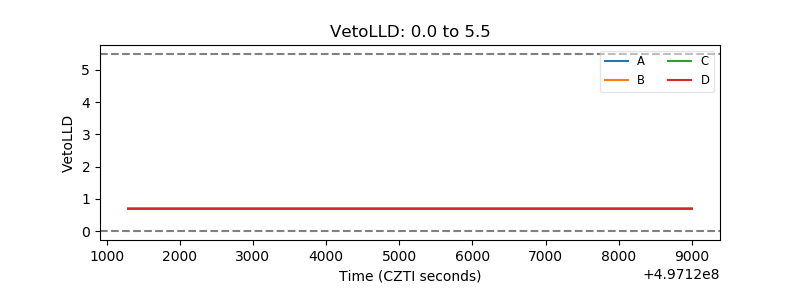 |
| Alpha Counter | 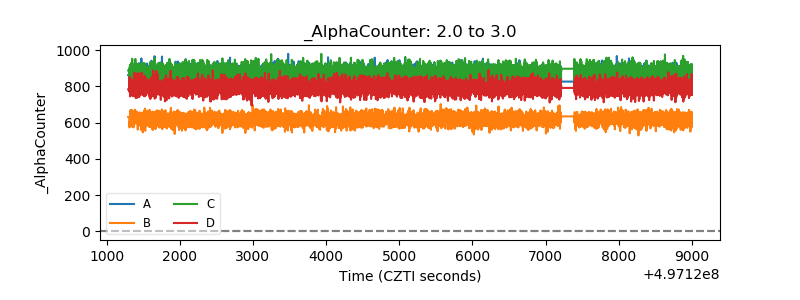 |
| _CPM_Rate | 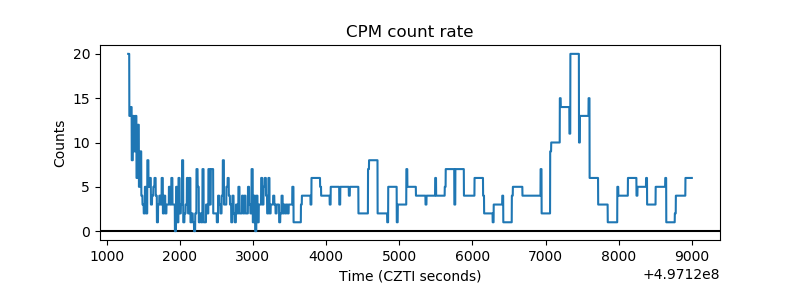 |
| CZT Counter | 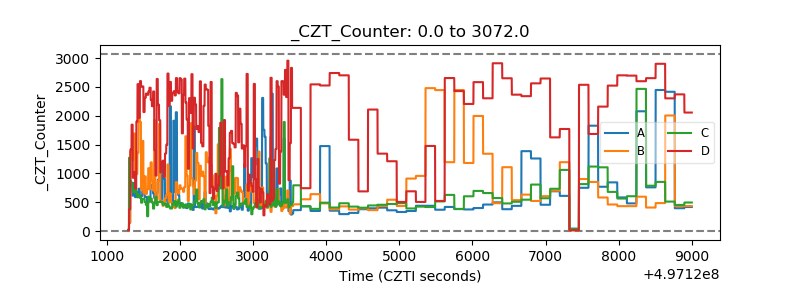 |
| +2.5 Volts monitor |  |
| +5 Volts monitor |  |
| _ROLL_ROT | 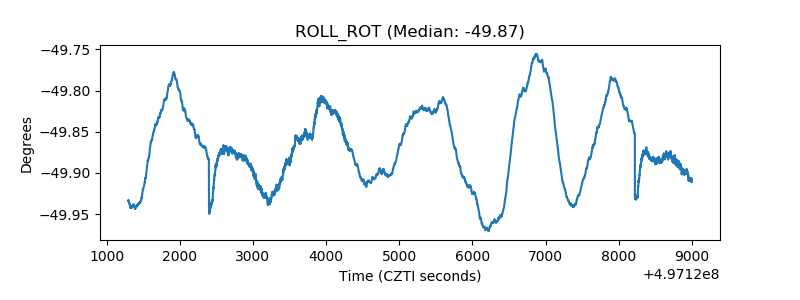 |
| _Roll_DEC | 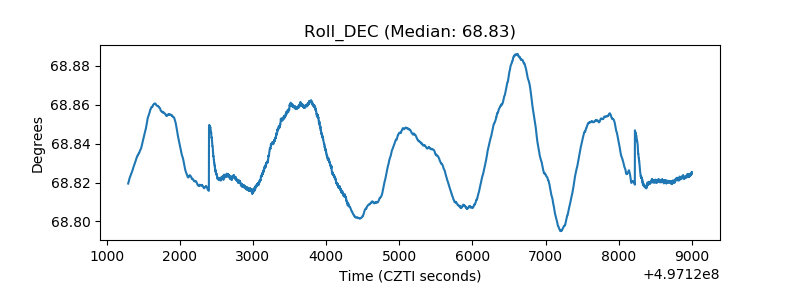 |
| _Roll_RA | 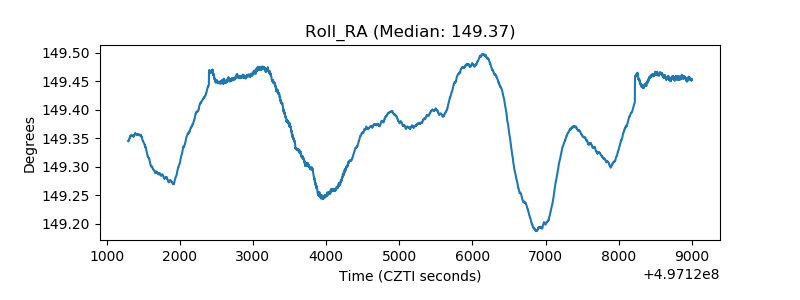 |
| Veto Counter | 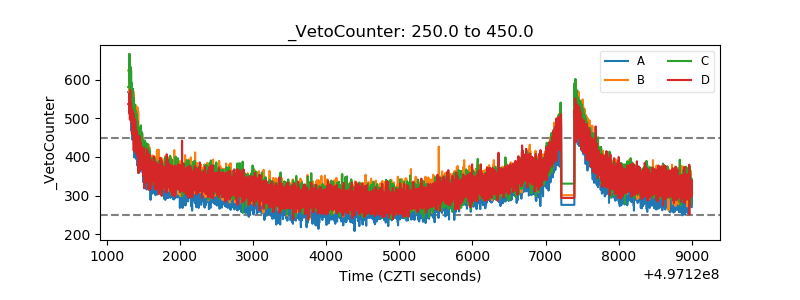 |