| Param | Original file | Final file |
|---|---|---|
| Filename | modeM0/AS1A14_012T01_9000006512_54172cztM0_level2.fits | modeM0/AS1A14_012T01_9000006512_54172cztM0_level2_quad_clean.evt |
| Size (bytes) | 754,292,160 | 106,767,360 |
| Size | 719.3 MB | 101.8 MB |
| Events in quadrant A | 6,061,507 | 694,300 |
| Events in quadrant B | 4,085,523 | 822,862 |
| Events in quadrant C | 5,410,144 | 721,466 |
| Events in quadrant D | 11,737,717 | 432,949 |
| Mode SS | |||
|---|---|---|---|
| Quadrant | BADHDUFLAG | Total packets | Discarded packets |
| A | 0 | 160 | 0 |
| B | 0 | 160 | 0 |
| C | 0 | 160 | 0 |
| D | 0 | 160 | 0 |
| Mode M0 | |||
|---|---|---|---|
| Quadrant | BADHDUFLAG | Total packets | Discarded packets |
| A | 0 | 23855 | 1 |
| B | 0 | 18042 | 1 |
| C | 0 | 21406 | 2 |
| D | 0 | 40488 | 1 |
| Mode M9 | |||
|---|---|---|---|
| Quadrant | BADHDUFLAG | Total packets | Discarded packets |
| A | 1 | 140456246376488 | 140454020513838 |
| B | 1 | -1 | -1 |
| C | 1 | -1 | -1 |
| D | 1 | -1 | -1 |
| Quadrant | Total seconds | Saturated seconds | Saturation percentage |
|---|---|---|---|
| A | 8079 | 977 | 12.093081% |
| B | 8079 | 105 | 1.299666% |
| C | 8078 | 262 | 3.243377% |
| D | 8078 | 3103 | 38.412974% |
Noise dominated data is calculated using 1-second bins in cleaned event files. If a bin has >2000 counts, and if more than 50% of those come from <1% of pixels, then it is considered to be noise-dominated and hence unusable.
| Quadrant | # 1 sec bins | Bins with >0 counts | Bins with >2000 counts | High rate bins dominated by noise | Noise dominated (total time) | Noise dominated (detector-on time) | Marked lightcurve |
|---|---|---|---|---|---|---|---|
| A | 8079 | 8079 | 685 | 685 | 8.48% | 8.48% | 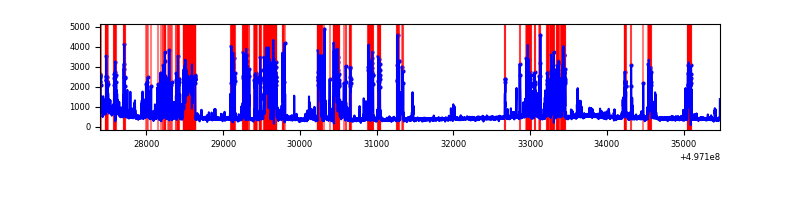 |
| B | 8079 | 8079 | 28 | 28 | 0.35% | 0.35% | 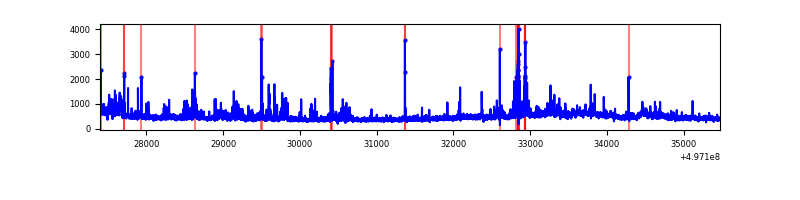 |
| C | 8078 | 8078 | 159 | 159 | 1.97% | 1.97% | 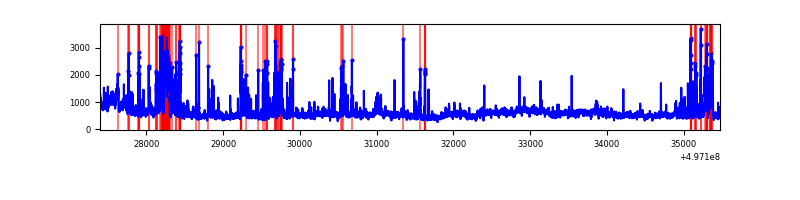 |
| D | 8078 | 8078 | 2620 | 2620 | 32.43% | 32.43% | 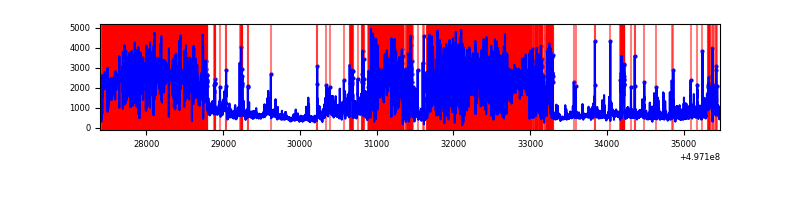 |
Top three noisy pixels from each quadrant. If the there are fewer than three noisy pixels in the level2.evt file, extra rows are filled as -1
| Pixel properties | Quadrant properties | ||||||
|---|---|---|---|---|---|---|---|
| Quadrant | DetID | PixID | Counts | Sigma | Mean | Median | Sigma |
| A | 7 | 29 | 2007444 | 9915.96 | 812 | 792 | 202.4 |
| A | 15 | 174 | 417897 | 2061.14 | 812 | 792 | 202.4 |
| A | 0 | 8 | 264115 | 1301.22 | 812 | 792 | 202.4 |
| B | 4 | 171 | 149380 | 817.45 | 855 | 825 | 181.7 |
| B | 7 | 0 | 137214 | 750.5 | 855 | 825 | 181.7 |
| B | 15 | 20 | 115936 | 633.42 | 855 | 825 | 181.7 |
| C | 10 | 171 | 872043 | 3804.53 | 840 | 831 | 229.0 |
| C | 15 | 177 | 489153 | 2132.47 | 840 | 831 | 229.0 |
| C | 9 | 38 | 473172 | 2062.69 | 840 | 831 | 229.0 |
| D | 8 | 176 | 7301308 | 41322.05 | 624 | 597 | 176.7 |
| D | 2 | 165 | 1001575 | 5665.54 | 624 | 597 | 176.7 |
| D | 3 | 12 | 221383 | 1249.65 | 624 | 597 | 176.7 |
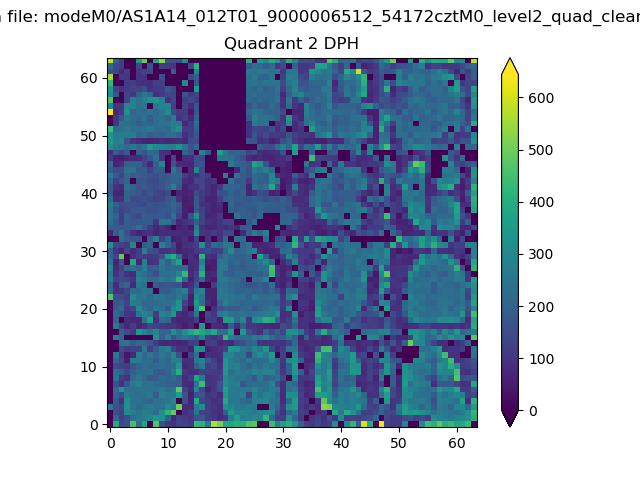
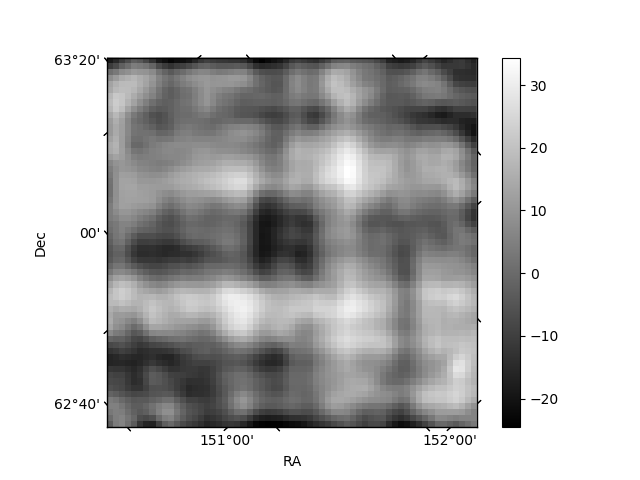
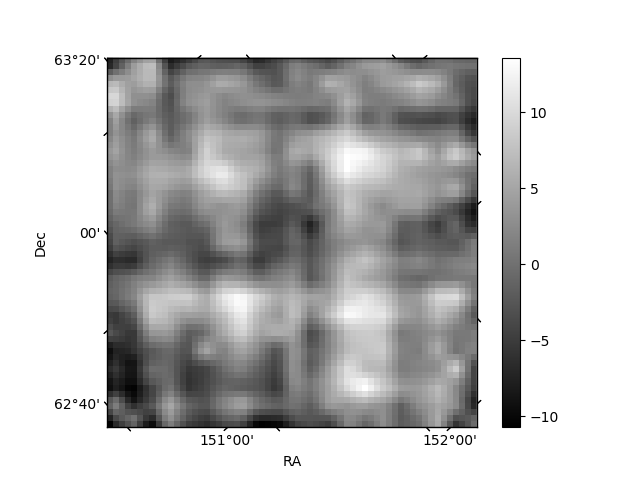
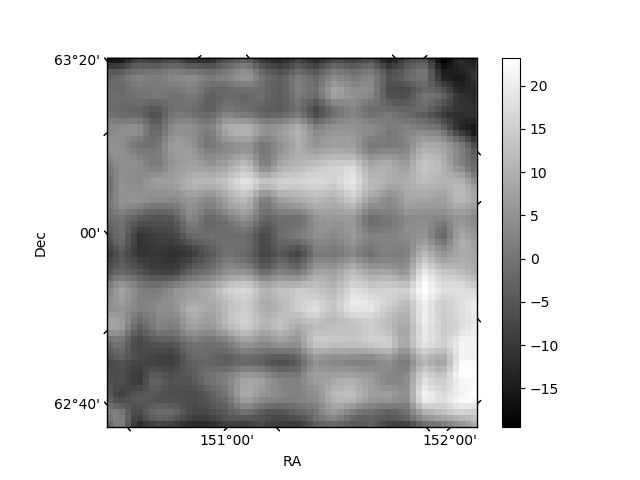
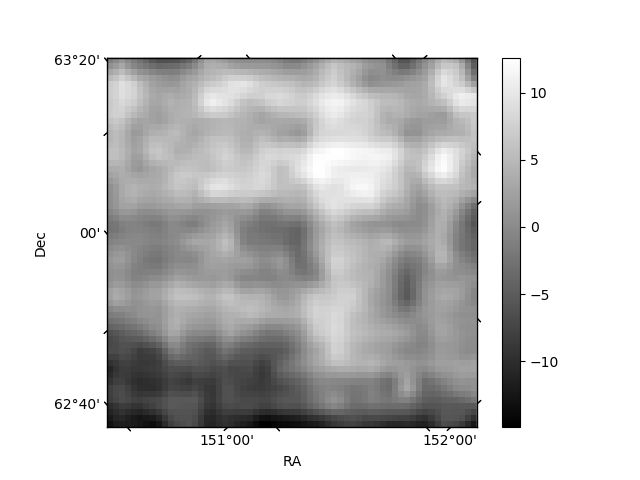
Histogram calculated using DETX and DETY for each event in the final _common_clean file
| Quadrant A | 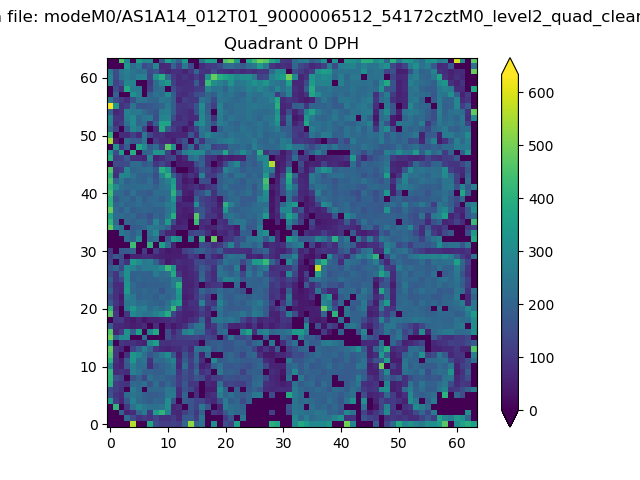 |
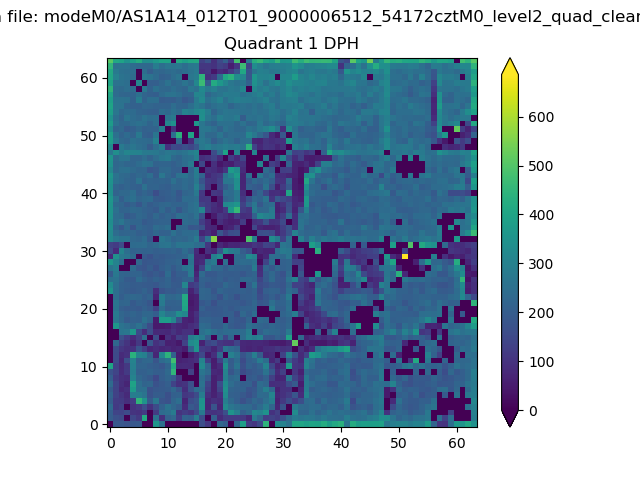 |
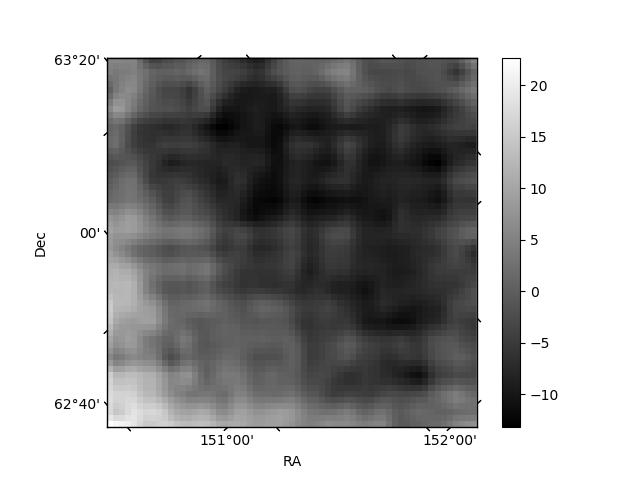
Quadrant B |
|---|---|---|---|
| Quadrant D | 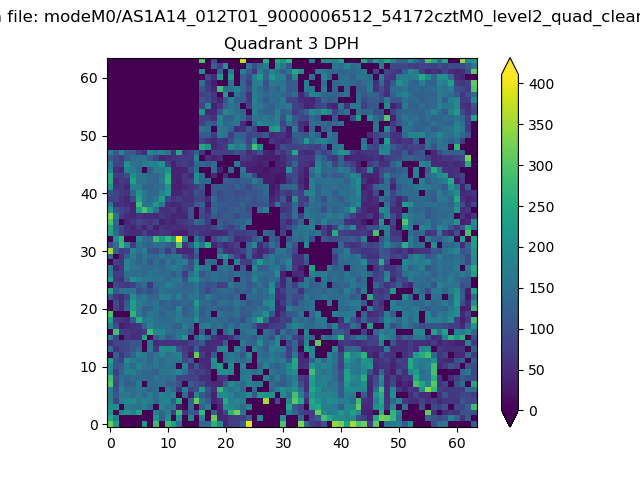 |
 |
Quadrant C |
| Plot type | Count rate plots | Images |
|---|---|---|
| Comparison with Poisson distribution Blue bars denote a histogram of data divided into 1 sec bins. Red curve is a Poisson curve with rate = median count rate of data. |
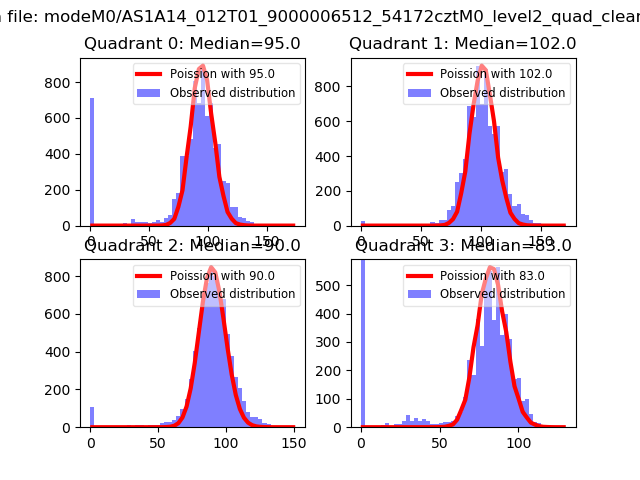 |
 |
| Quadrant-wise count rates Data is divided into 100 sec bins |
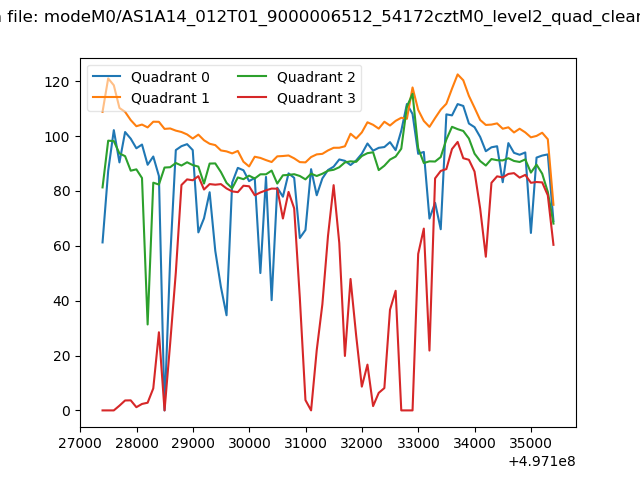 |
|
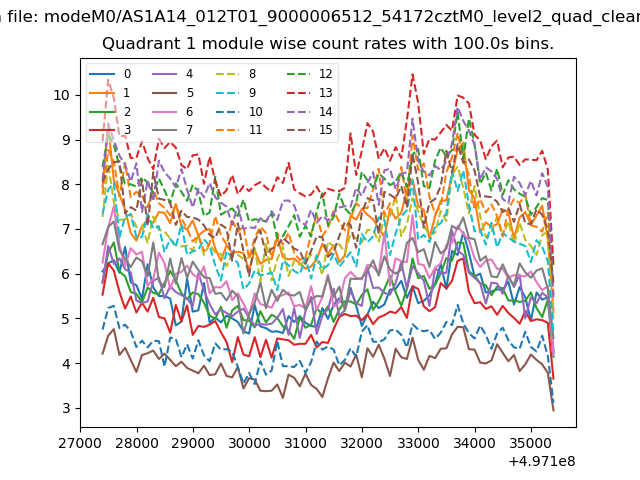
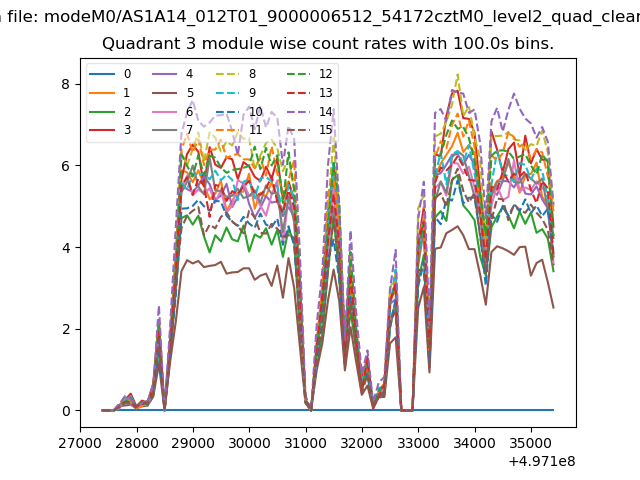
| Module-wise count rates for Quadrant A Data is divided into 100 sec bins |
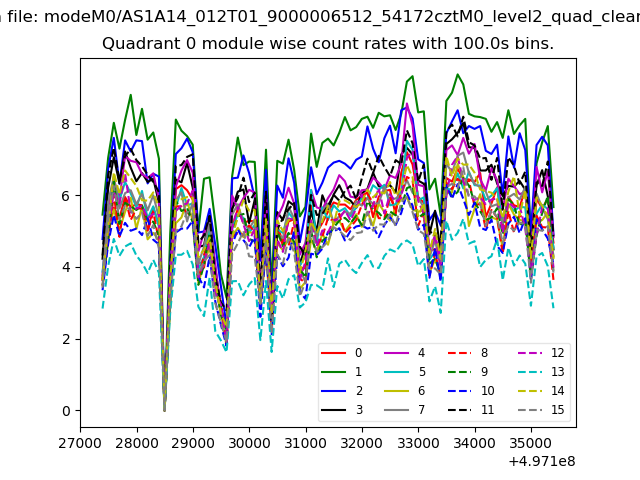 |
 |
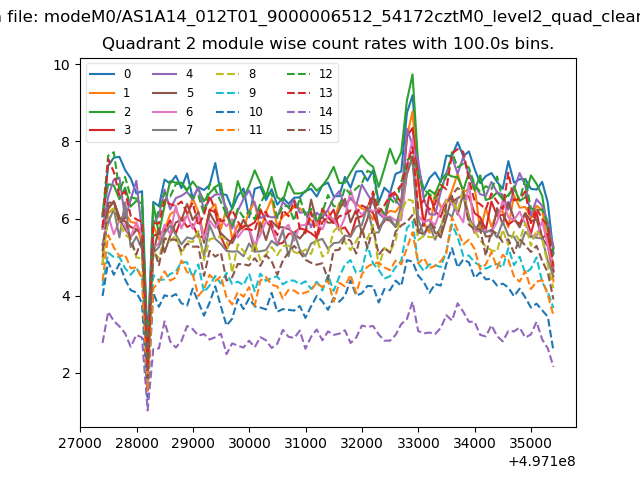
| Module-wise count rates for Quadrant B Data is divided into 100 sec bins |
 |
 |
| Module-wise count rates for Quadrant C Data is divided into 100 sec bins |
 |
 |
| Module-wise count rates for Quadrant D Data is divided into 100 sec bins |
 |
 |
| Parameter | Plot |
|---|---|
| CZT HV Monitor | 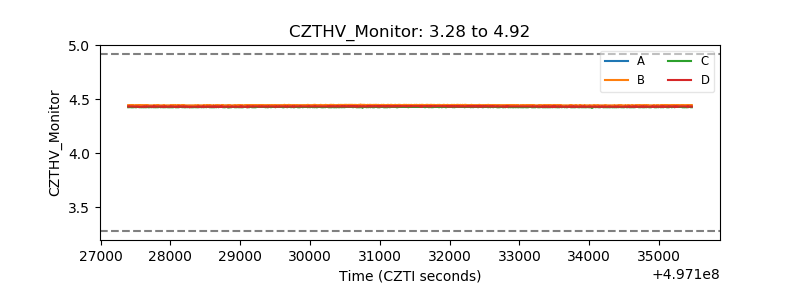 |
| D_VDD | 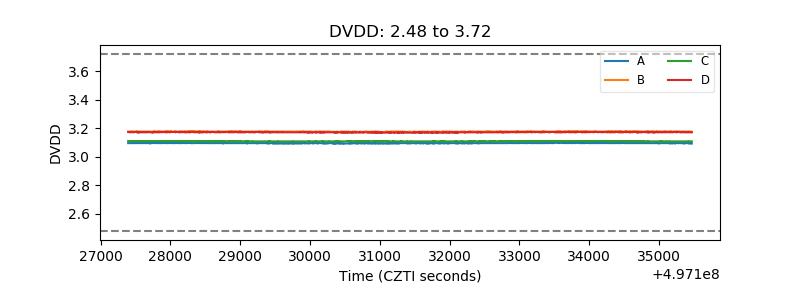 |
| Temperature 1 | 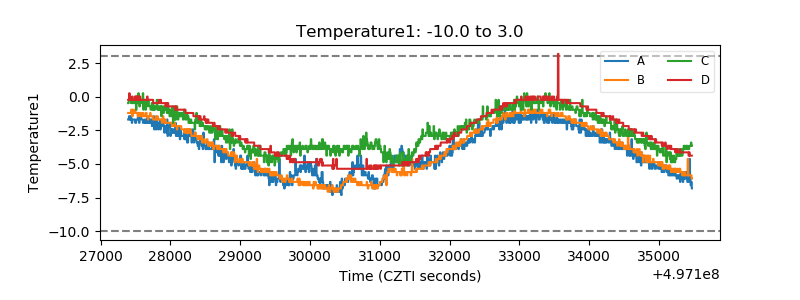 |
| Veto HV Monitor | 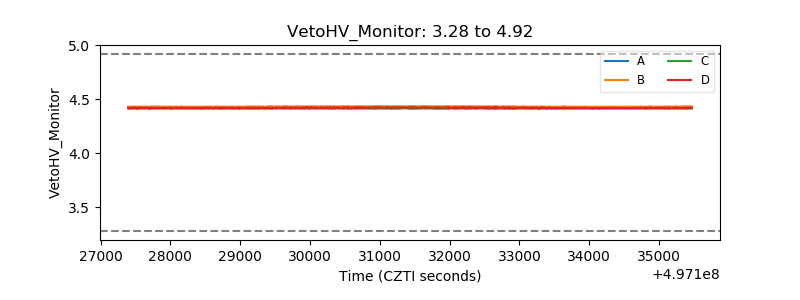 |
| Veto LLD | 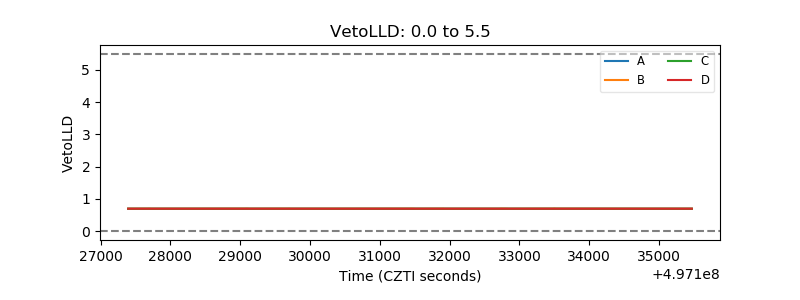 |
| Alpha Counter | 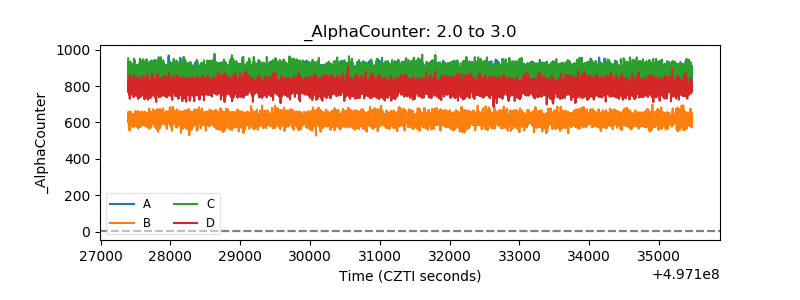 |
| _CPM_Rate | 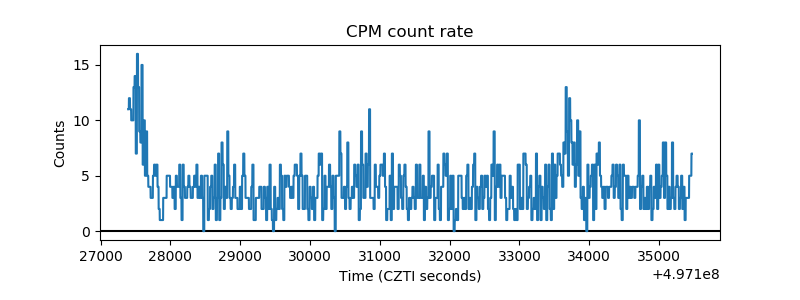 |
| CZT Counter | 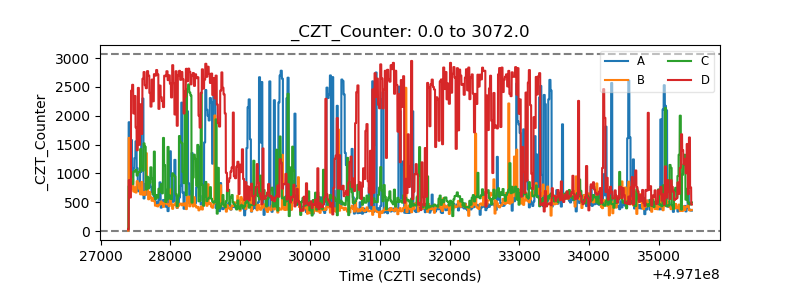 |
| +2.5 Volts monitor |  |
| +5 Volts monitor |  |
| _ROLL_ROT | 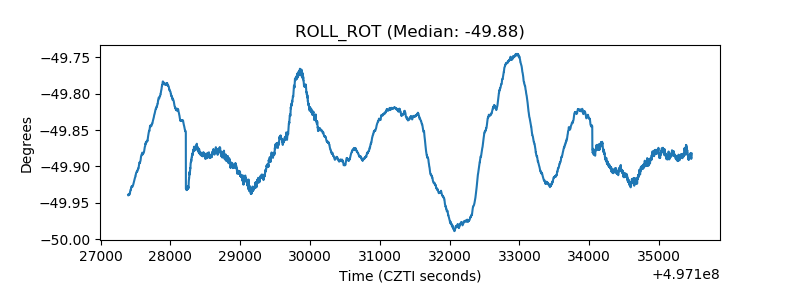 |
| _Roll_DEC | 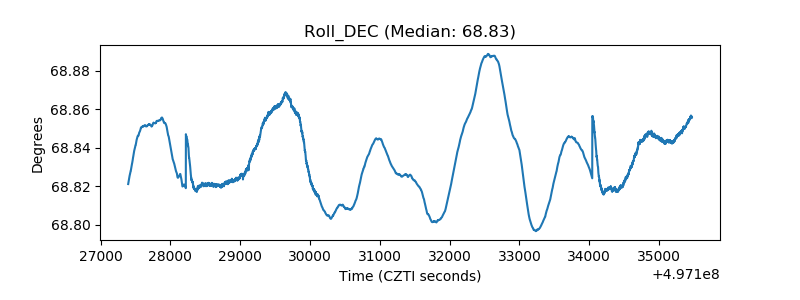 |
| _Roll_RA | 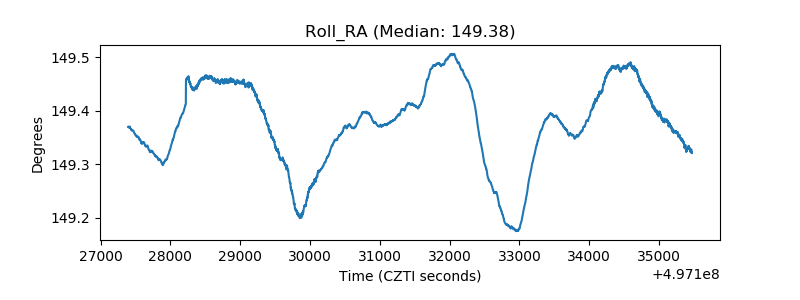 |
| Veto Counter | 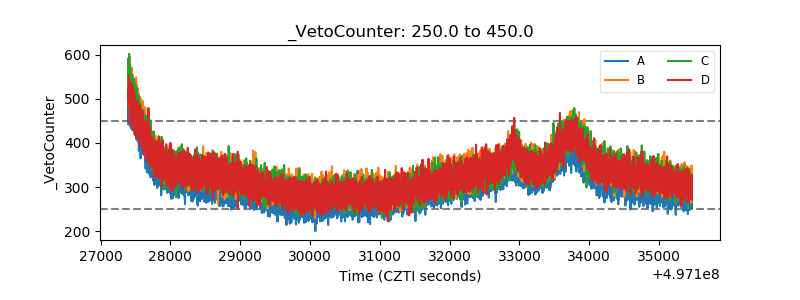 |