| Param | Original file | Final file |
|---|---|---|
| Filename | modeM0/AS1A14_012T01_9000006512_54173cztM0_level2.fits | modeM0/AS1A14_012T01_9000006512_54173cztM0_level2_quad_clean.evt |
| Size (bytes) | 761,886,720 | 110,724,480 |
| Size | 726.6 MB | 105.6 MB |
| Events in quadrant A | 6,300,498 | 707,315 |
| Events in quadrant B | 4,232,854 | 838,829 |
| Events in quadrant C | 5,559,182 | 721,408 |
| Events in quadrant D | 11,468,434 | 509,532 |
| Mode SS | |||
|---|---|---|---|
| Quadrant | BADHDUFLAG | Total packets | Discarded packets |
| A | 0 | 166 | 0 |
| B | 0 | 166 | 0 |
| C | 0 | 166 | 0 |
| D | 0 | 166 | 0 |
| Mode M0 | |||
|---|---|---|---|
| Quadrant | BADHDUFLAG | Total packets | Discarded packets |
| A | 0 | 24777 | 0 |
| B | 0 | 18650 | 0 |
| C | 0 | 22299 | 0 |
| D | 0 | 39944 | 6 |
| Quadrant | Total seconds | Saturated seconds | Saturation percentage |
|---|---|---|---|
| A | 8277 | 938 | 11.332608% |
| B | 8277 | 115 | 1.389392% |
| C | 8278 | 376 | 4.542160% |
| D | 8277 | 2568 | 31.025734% |
Noise dominated data is calculated using 1-second bins in cleaned event files. If a bin has >2000 counts, and if more than 50% of those come from <1% of pixels, then it is considered to be noise-dominated and hence unusable.
| Quadrant | # 1 sec bins | Bins with >0 counts | Bins with >2000 counts | High rate bins dominated by noise | Noise dominated (total time) | Noise dominated (detector-on time) | Marked lightcurve |
|---|---|---|---|---|---|---|---|
| A | 8277 | 8277 | 673 | 673 | 8.13% | 8.13% | 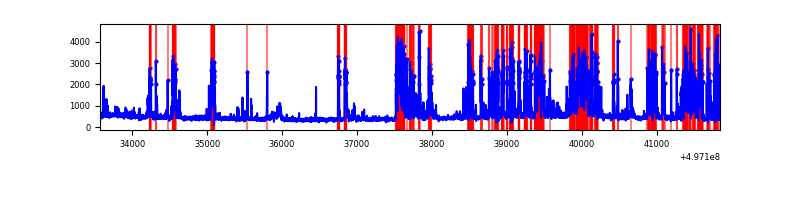 |
| B | 8277 | 8277 | 49 | 49 | 0.59% | 0.59% | 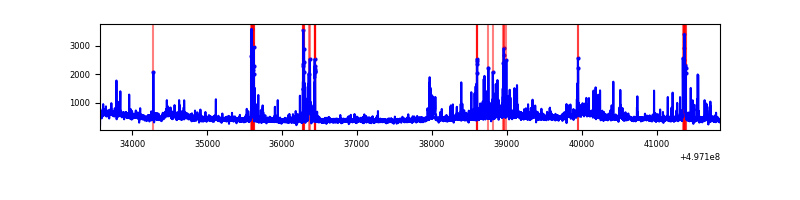 |
| C | 8278 | 8278 | 252 | 252 | 3.04% | 3.04% | 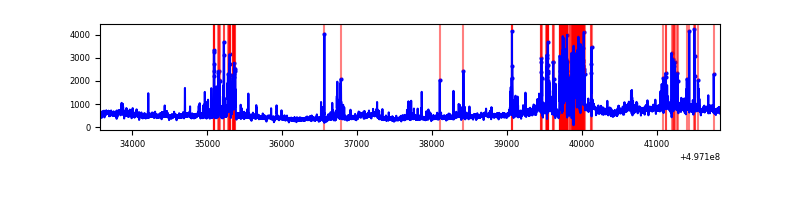 |
| D | 8276 | 8276 | 2246 | 2246 | 27.14% | 27.14% | 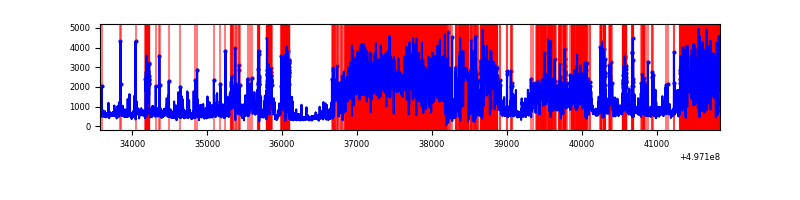 |
Top three noisy pixels from each quadrant. If the there are fewer than three noisy pixels in the level2.evt file, extra rows are filled as -1
| Pixel properties | Quadrant properties | ||||||
|---|---|---|---|---|---|---|---|
| Quadrant | DetID | PixID | Counts | Sigma | Mean | Median | Sigma |
| A | 7 | 29 | 1925950 | 9244.36 | 830 | 809 | 208.3 |
| A | 15 | 174 | 452797 | 2170.41 | 830 | 809 | 208.3 |
| A | 0 | 8 | 422889 | 2026.79 | 830 | 809 | 208.3 |
| B | 4 | 171 | 215599 | 1151.3 | 875 | 843 | 186.5 |
| B | 5 | 185 | 137400 | 732.08 | 875 | 843 | 186.5 |
| B | 4 | 216 | 93437 | 496.39 | 875 | 843 | 186.5 |
| C | 10 | 171 | 1053826 | 4556.32 | 841 | 832 | 231.1 |
| C | 15 | 177 | 796319 | 3442.08 | 841 | 832 | 231.1 |
| C | 12 | 252 | 123971 | 532.82 | 841 | 832 | 231.1 |
| D | 8 | 176 | 6439127 | 30619.0 | 732 | 700 | 210.3 |
| D | 2 | 165 | 1165633 | 5540.03 | 732 | 700 | 210.3 |
| D | 7 | 62 | 269433 | 1278.0 | 732 | 700 | 210.3 |
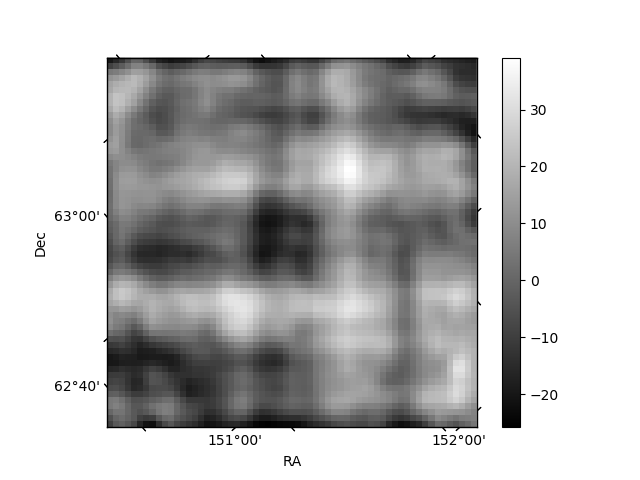
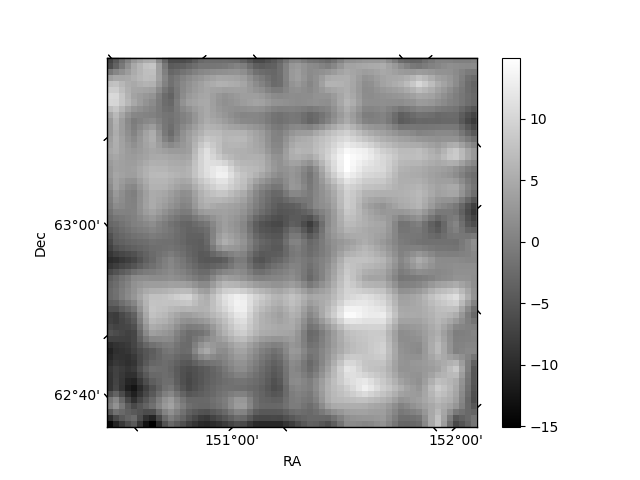
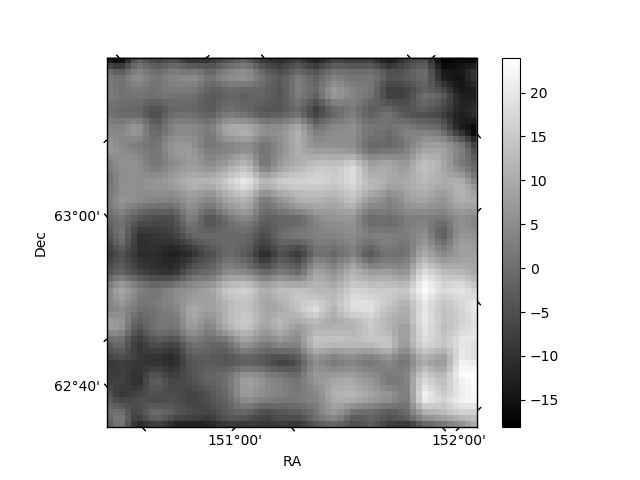
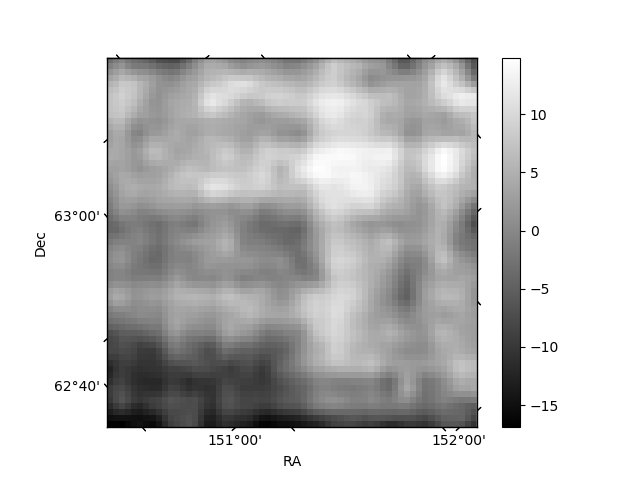
Histogram calculated using DETX and DETY for each event in the final _common_clean file
| Quadrant A | 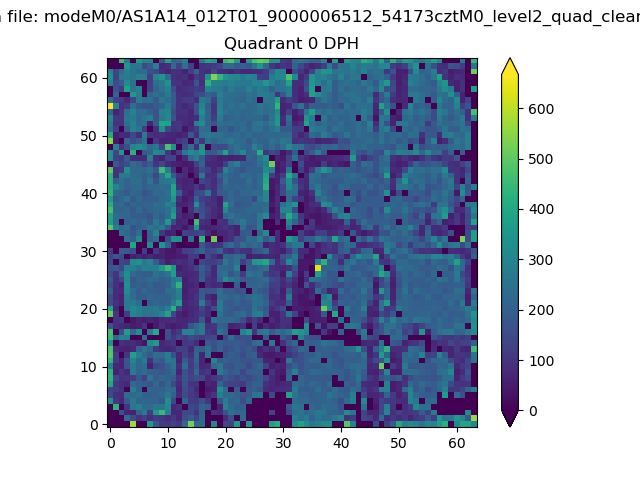 |
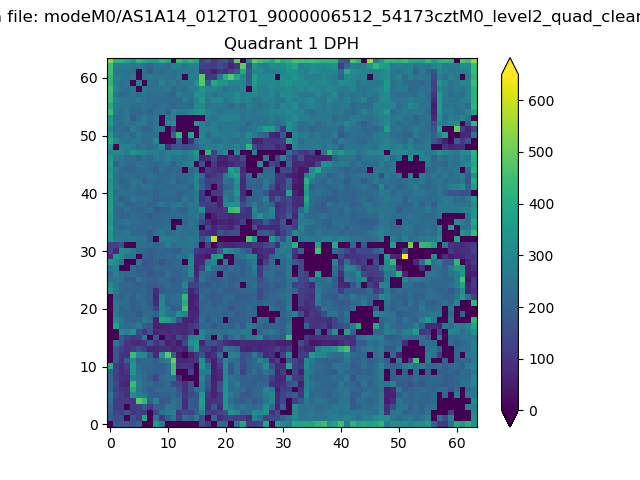 |
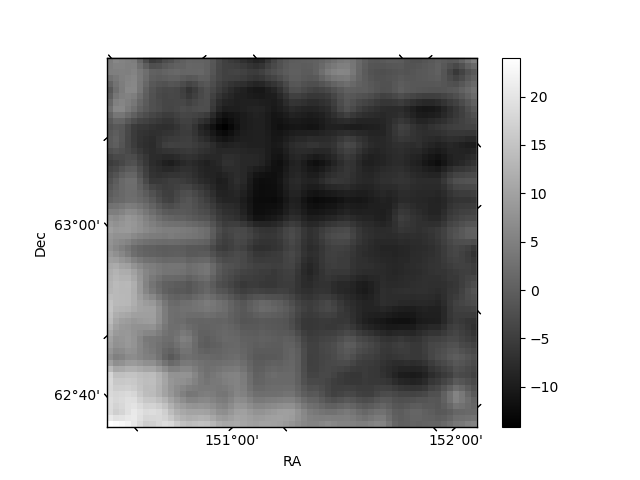
Quadrant B |
|---|---|---|---|
| Quadrant D | 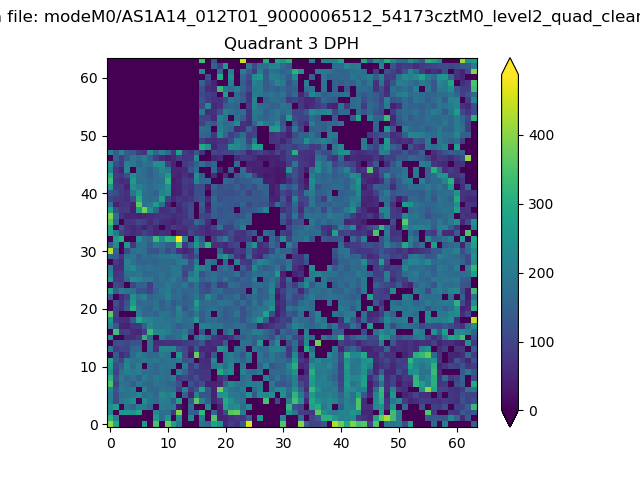 |
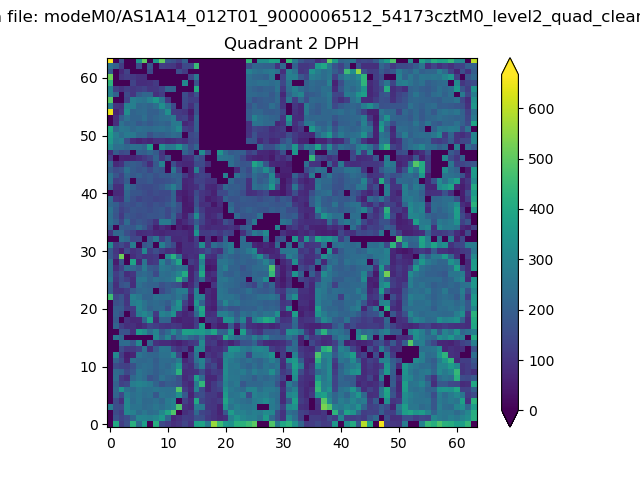 |
Quadrant C |
| Plot type | Count rate plots | Images |
|---|---|---|
| Comparison with Poisson distribution Blue bars denote a histogram of data divided into 1 sec bins. Red curve is a Poisson curve with rate = median count rate of data. |
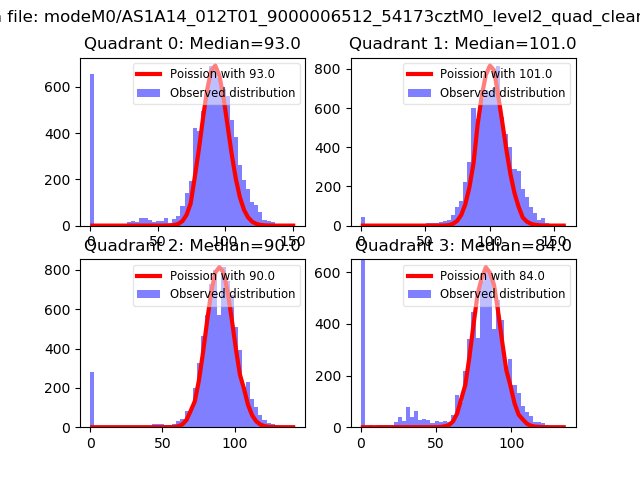 |
 |
| Quadrant-wise count rates Data is divided into 100 sec bins |
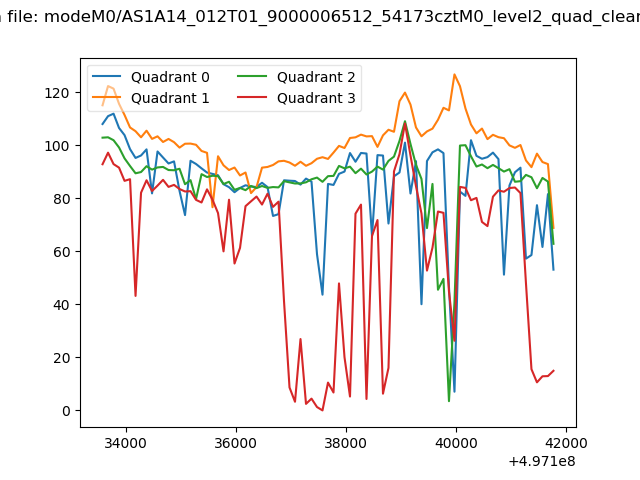 |
|
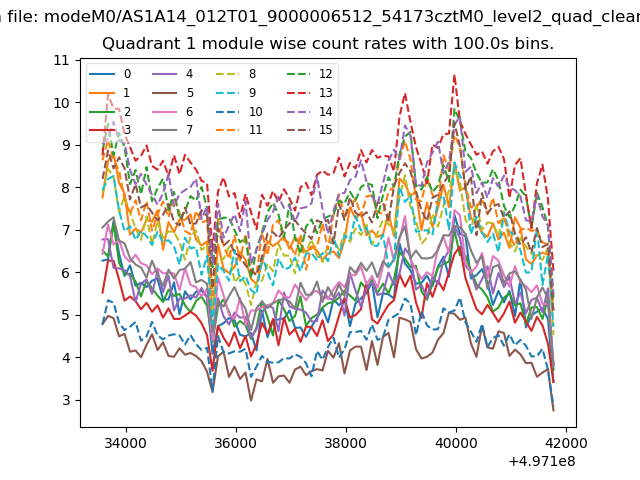
| Module-wise count rates for Quadrant A Data is divided into 100 sec bins |
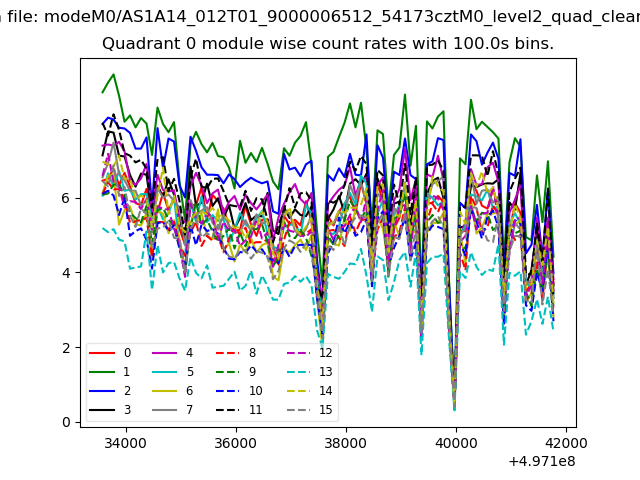 |
 |
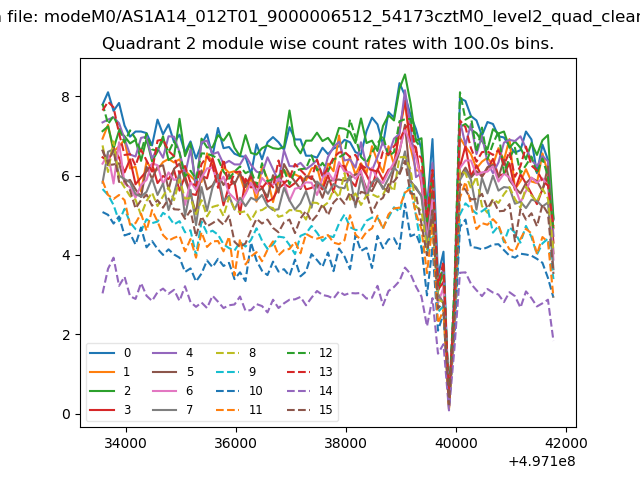
| Module-wise count rates for Quadrant B Data is divided into 100 sec bins |
 |
 |
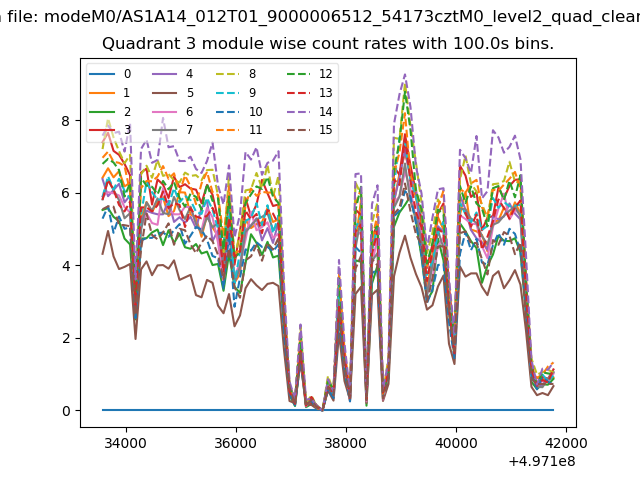
| Module-wise count rates for Quadrant C Data is divided into 100 sec bins |
 |
 |
| Module-wise count rates for Quadrant D Data is divided into 100 sec bins |
 |
 |
| Parameter | Plot |
|---|---|
| CZT HV Monitor | 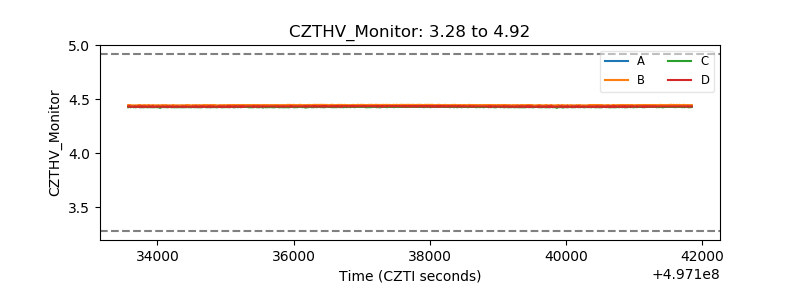 |
| D_VDD | 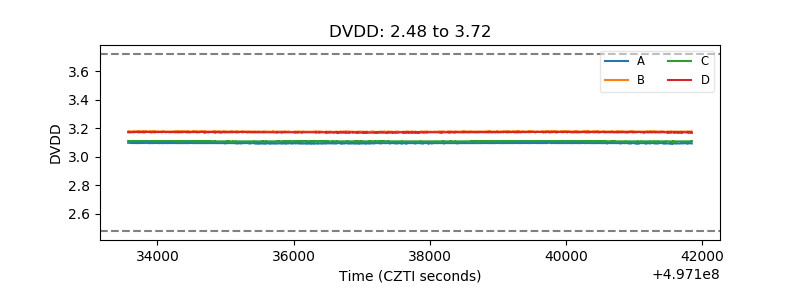 |
| Temperature 1 | 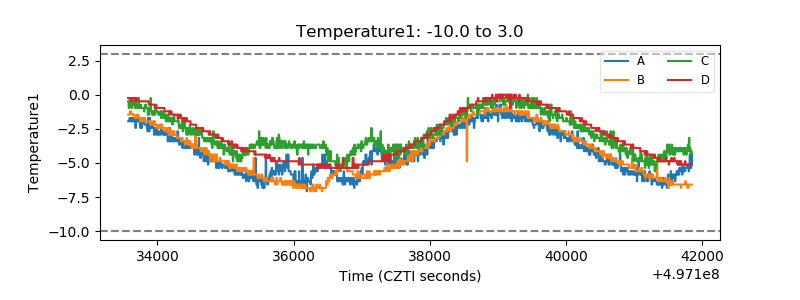 |
| Veto HV Monitor | 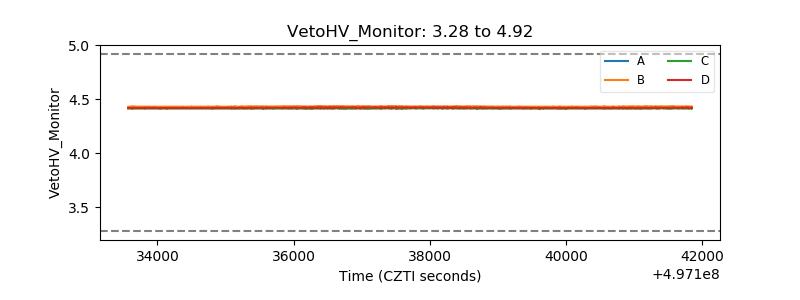 |
| Veto LLD | 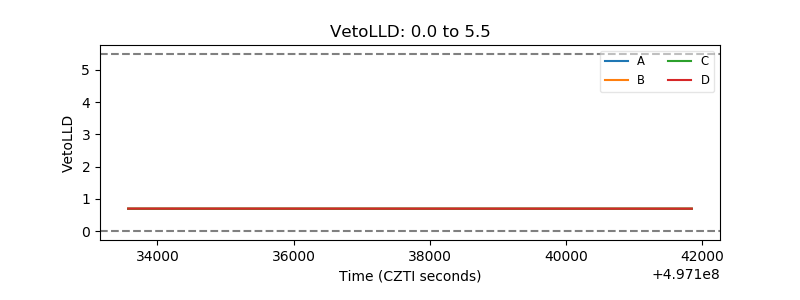 |
| Alpha Counter | 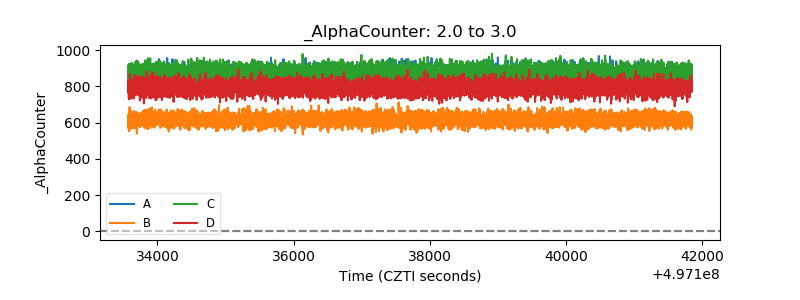 |
| _CPM_Rate | 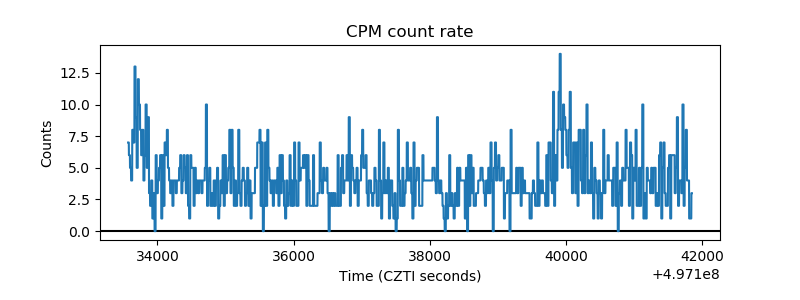 |
| CZT Counter | 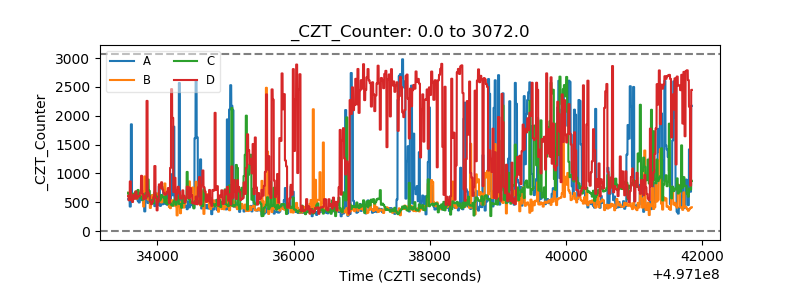 |
| +2.5 Volts monitor |  |
| +5 Volts monitor | 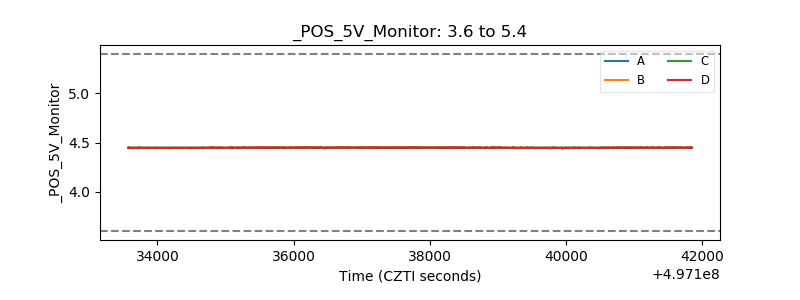 |
| _ROLL_ROT | 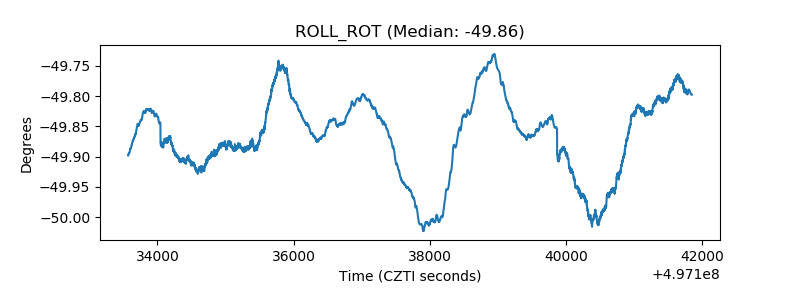 |
| _Roll_DEC | 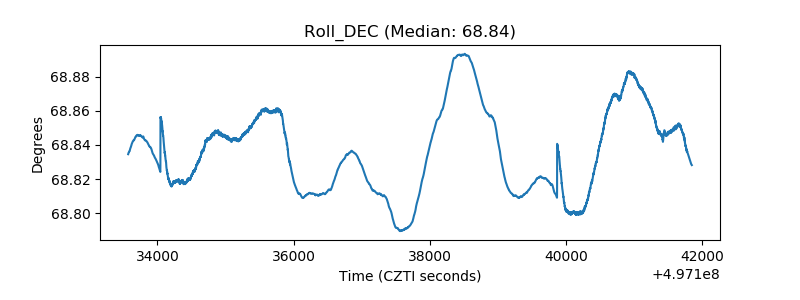 |
| _Roll_RA | 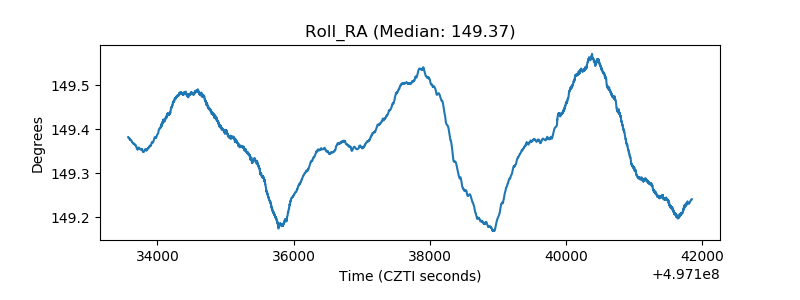 |
| Veto Counter | 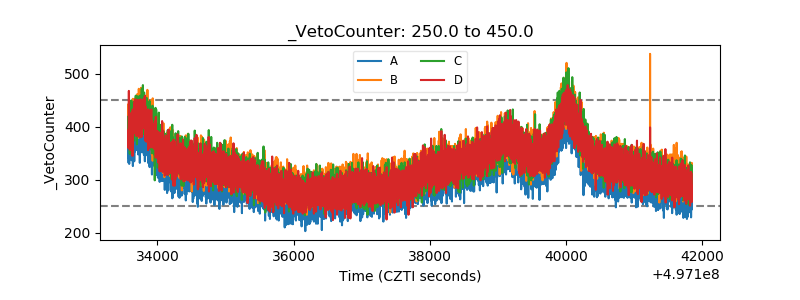 |