| Param | Original file | Final file |
|---|---|---|
| Filename | modeM0/AS1A14_012T01_9000006512_54176cztM0_level2.fits | modeM0/AS1A14_012T01_9000006512_54176cztM0_level2_quad_clean.evt |
| Size (bytes) | 1,754,136,000 | 249,624,000 |
| Size | 1.6 GB | 238.1 MB |
| Events in quadrant A | 10,888,288 | 1,711,180 |
| Events in quadrant B | 10,803,544 | 1,893,063 |
| Events in quadrant C | 15,589,254 | 1,514,953 |
| Events in quadrant D | 26,159,858 | 1,107,188 |
| Mode SS | |||
|---|---|---|---|
| Quadrant | BADHDUFLAG | Total packets | Discarded packets |
| A | 0 | 392 | 0 |
| B | 0 | 392 | 0 |
| C | 0 | 392 | 0 |
| D | 0 | 392 | 0 |
| Mode M0 | |||
|---|---|---|---|
| Quadrant | BADHDUFLAG | Total packets | Discarded packets |
| A | 0 | 46889 | 4 |
| B | 0 | 46075 | 4 |
| C | 0 | 60006 | 4 |
| D | 0 | 91286 | 11 |
| Mode M9 | |||
|---|---|---|---|
| Quadrant | BADHDUFLAG | Total packets | Discarded packets |
| A | 0 | 10 | 0 |
| B | 0 | 10 | 0 |
| C | 0 | 10 | 0 |
| D | 0 | 10 | 0 |
| Quadrant | Total seconds | Saturated seconds | Saturation percentage |
|---|---|---|---|
| A | 19306 | 773 | 4.003937% |
| B | 19306 | 352 | 1.823267% |
| C | 19306 | 2153 | 11.151973% |
| D | 19306 | 5754 | 29.804206% |
Noise dominated data is calculated using 1-second bins in cleaned event files. If a bin has >2000 counts, and if more than 50% of those come from <1% of pixels, then it is considered to be noise-dominated and hence unusable.
| Quadrant | # 1 sec bins | Bins with >0 counts | Bins with >2000 counts | High rate bins dominated by noise | Noise dominated (total time) | Noise dominated (detector-on time) | Marked lightcurve |
|---|---|---|---|---|---|---|---|
| A | 20476 | 19310 | 538 | 538 | 2.63% | 2.79% | 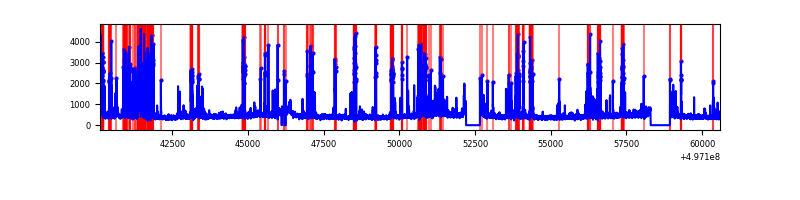 |
| B | 20476 | 19310 | 101 | 101 | 0.49% | 0.52% | 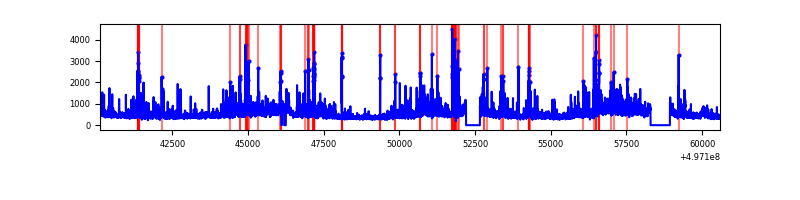 |
| C | 20476 | 19310 | 1452 | 1452 | 7.09% | 7.52% | 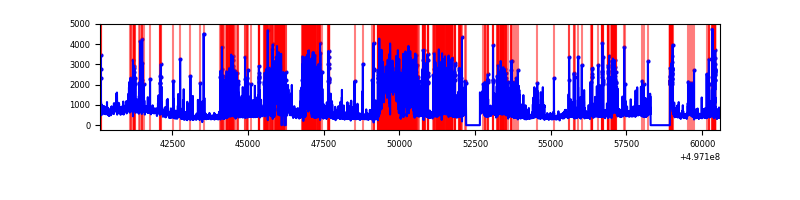 |
| D | 20476 | 19310 | 5091 | 5091 | 24.86% | 26.36% | 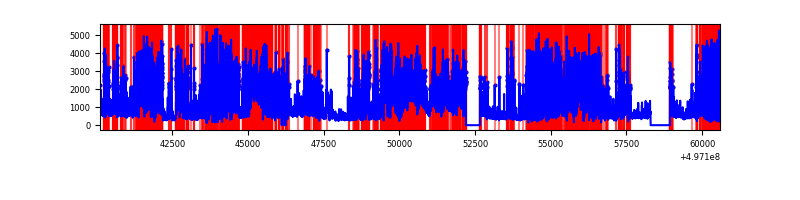 |
Top three noisy pixels from each quadrant. If the there are fewer than three noisy pixels in the level2.evt file, extra rows are filled as -1
| Pixel properties | Quadrant properties | ||||||
|---|---|---|---|---|---|---|---|
| Quadrant | DetID | PixID | Counts | Sigma | Mean | Median | Sigma |
| A | 7 | 29 | 1164945 | 2375.93 | 1983 | 1934 | 489.5 |
| A | 0 | 8 | 783609 | 1596.89 | 1983 | 1934 | 489.5 |
| A | 15 | 174 | 587979 | 1197.24 | 1983 | 1934 | 489.5 |
| B | 15 | 20 | 940064 | 2220.26 | 1998 | 1928 | 422.5 |
| B | 7 | 0 | 359101 | 845.31 | 1998 | 1928 | 422.5 |
| B | 5 | 185 | 323713 | 761.56 | 1998 | 1928 | 422.5 |
| C | 15 | 215 | 2951873 | 5832.97 | 1854 | 1835 | 505.8 |
| C | 10 | 171 | 1635330 | 3229.83 | 1854 | 1835 | 505.8 |
| C | 15 | 216 | 1219723 | 2408.07 | 1854 | 1835 | 505.8 |
| D | 8 | 176 | 15476068 | 32612.84 | 1662 | 1585 | 474.5 |
| D | 10 | 181 | 2091714 | 4405.0 | 1662 | 1585 | 474.5 |
| D | 2 | 165 | 981537 | 2065.27 | 1662 | 1585 | 474.5 |
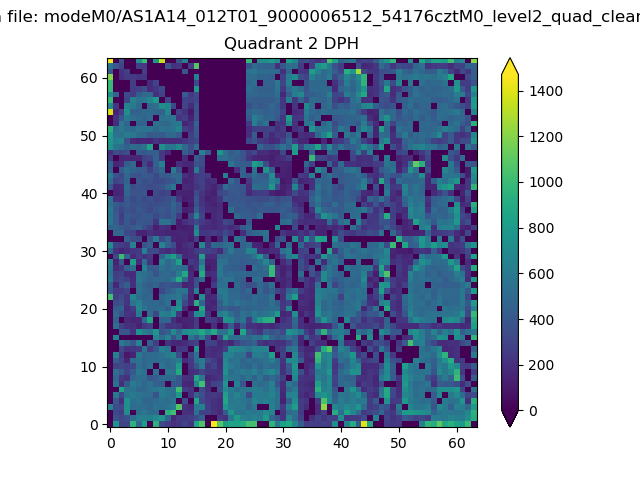
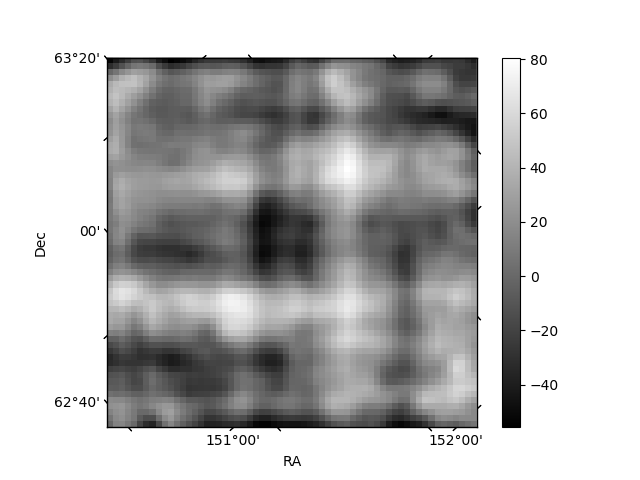
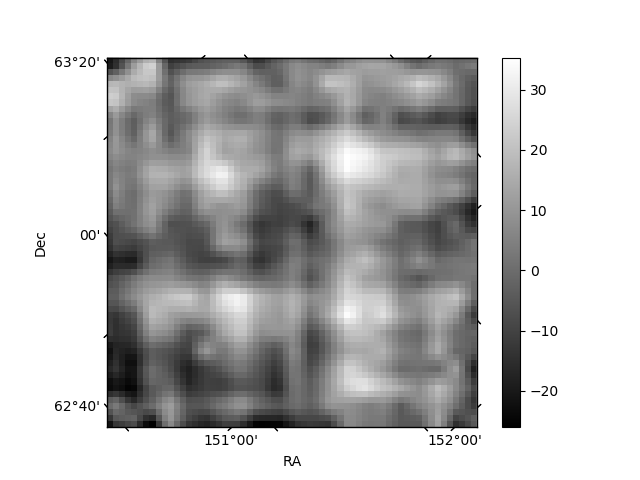
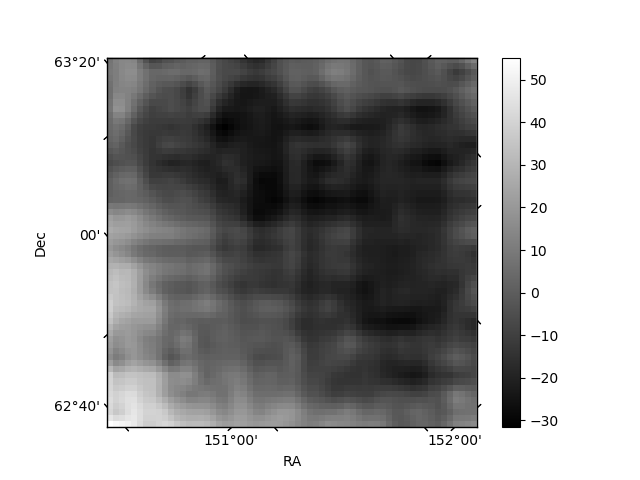
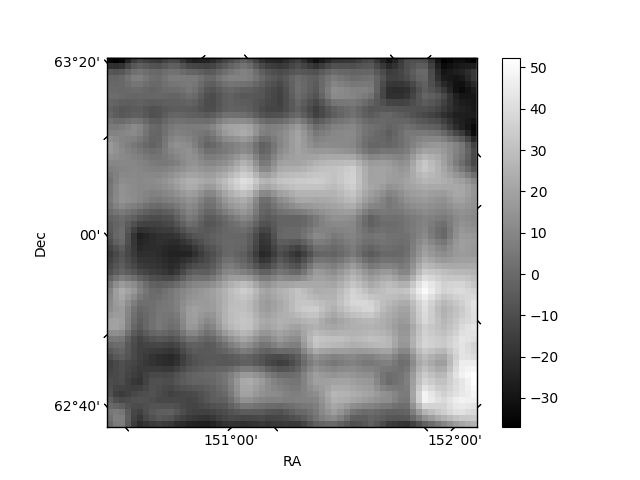
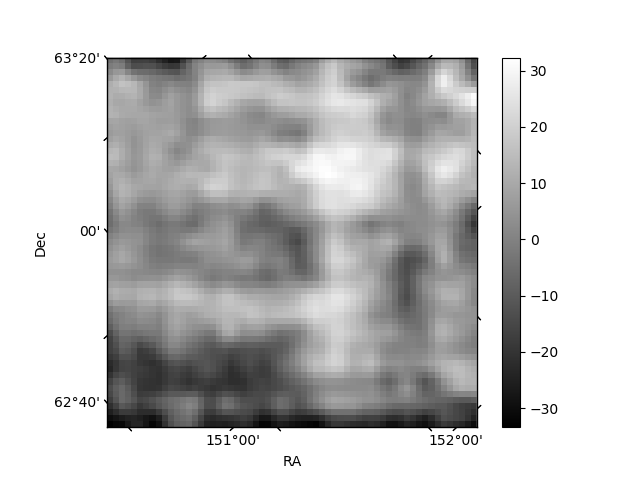
Histogram calculated using DETX and DETY for each event in the final _common_clean file
| Quadrant A | 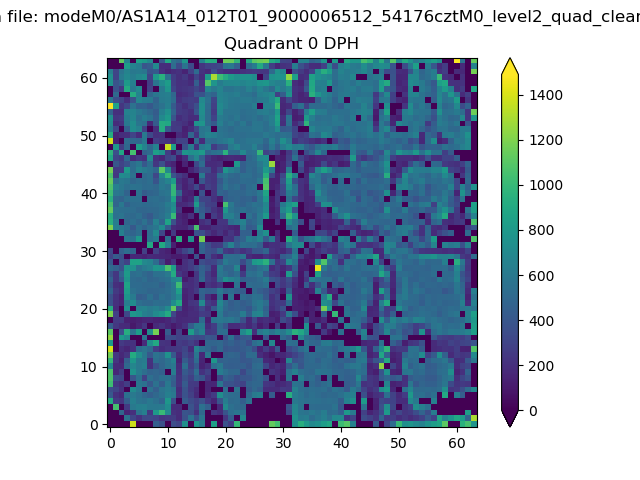 |
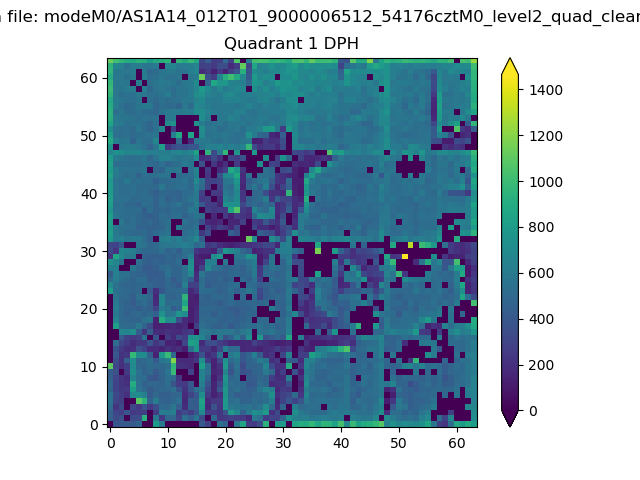 |
Quadrant B |
|---|---|---|---|
| Quadrant D | 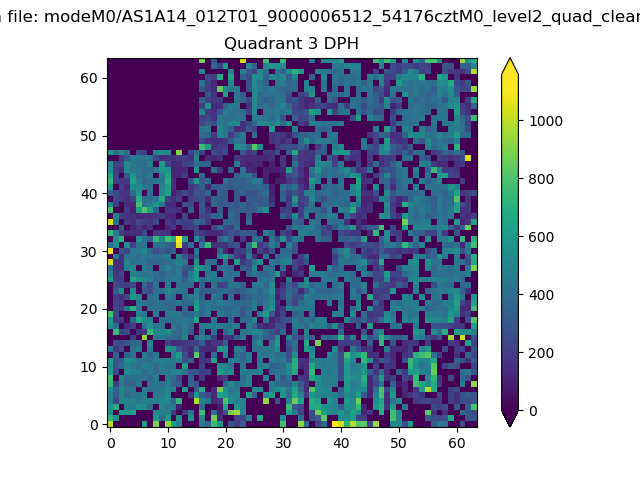 |
 |
Quadrant C |
| Plot type | Count rate plots | Images |
|---|---|---|
| Comparison with Poisson distribution Blue bars denote a histogram of data divided into 1 sec bins. Red curve is a Poisson curve with rate = median count rate of data. |
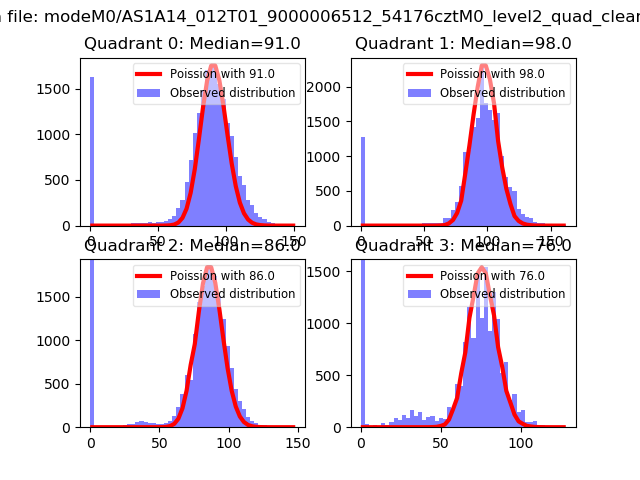 |
 |
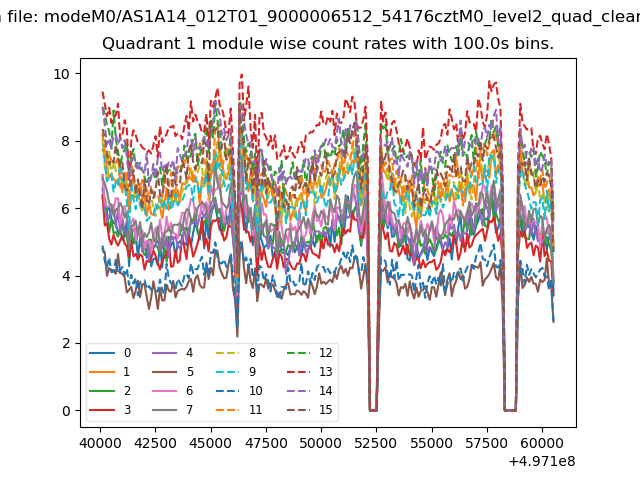
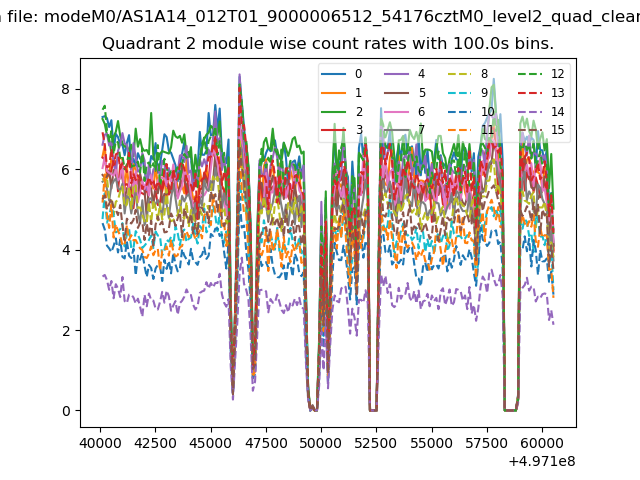
| Quadrant-wise count rates Data is divided into 100 sec bins |
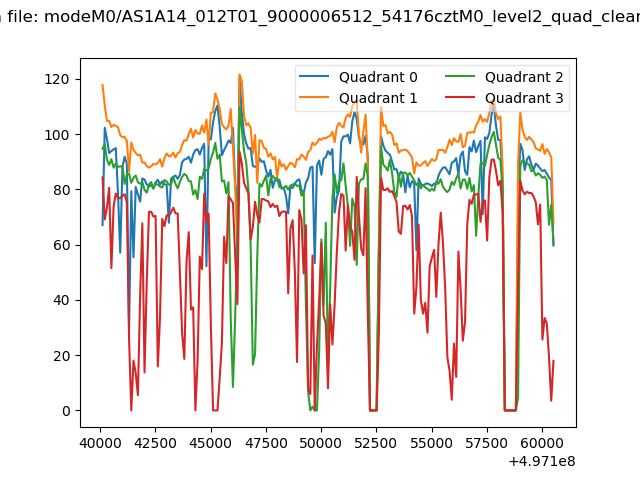 |
|
| Module-wise count rates for Quadrant A Data is divided into 100 sec bins |
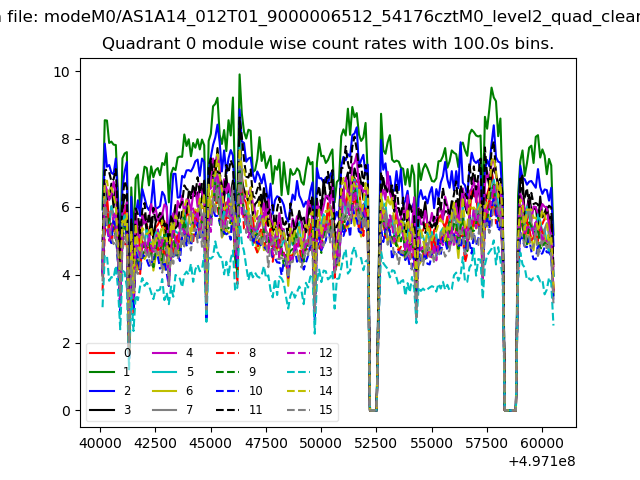 |
 |
| Module-wise count rates for Quadrant B Data is divided into 100 sec bins |
 |
 |
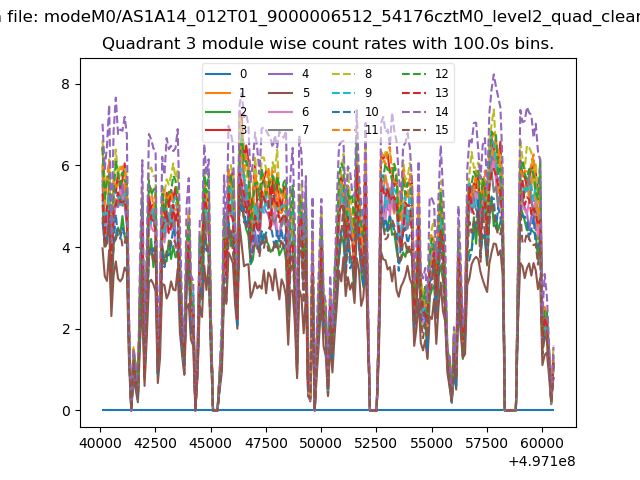
| Module-wise count rates for Quadrant C Data is divided into 100 sec bins |
 |
 |
| Module-wise count rates for Quadrant D Data is divided into 100 sec bins |
 |
 |
| Parameter | Plot |
|---|---|
| CZT HV Monitor | 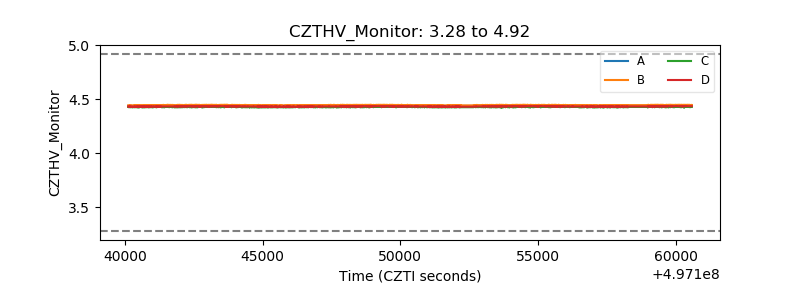 |
| D_VDD | 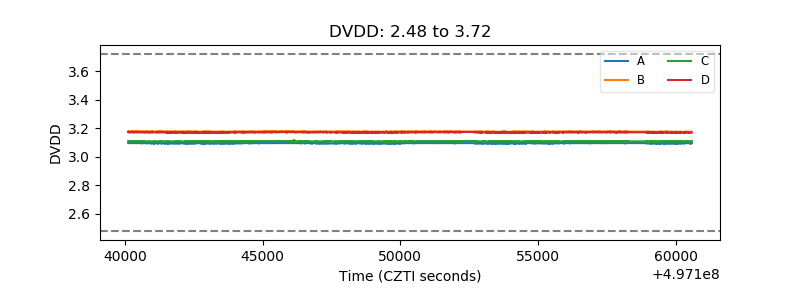 |
| Temperature 1 | 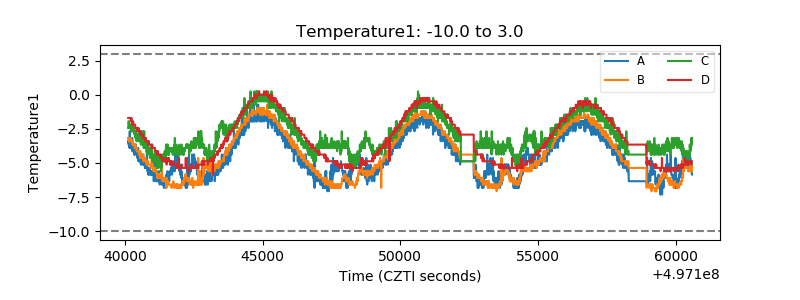 |
| Veto HV Monitor | 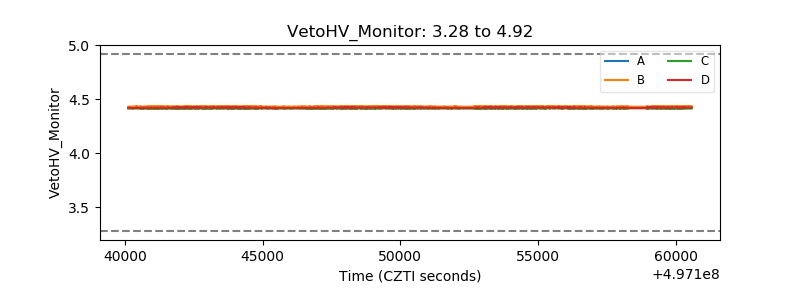 |
| Veto LLD | 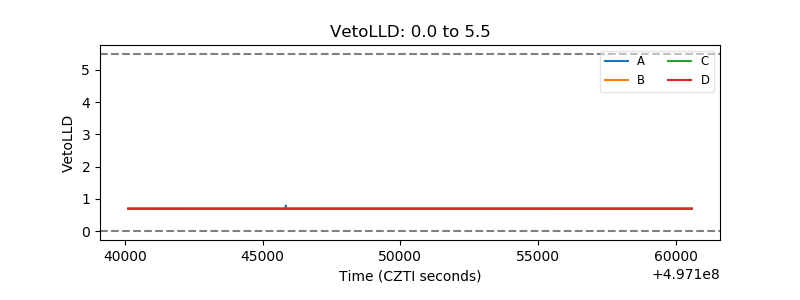 |
| Alpha Counter | 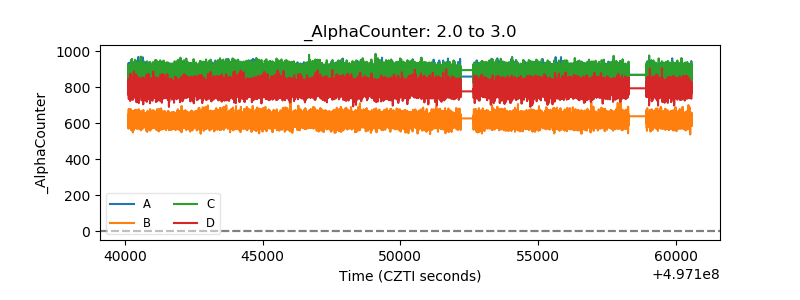 |
| _CPM_Rate | 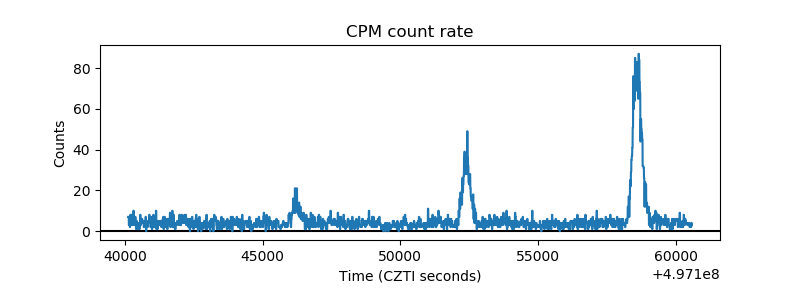 |
| CZT Counter | 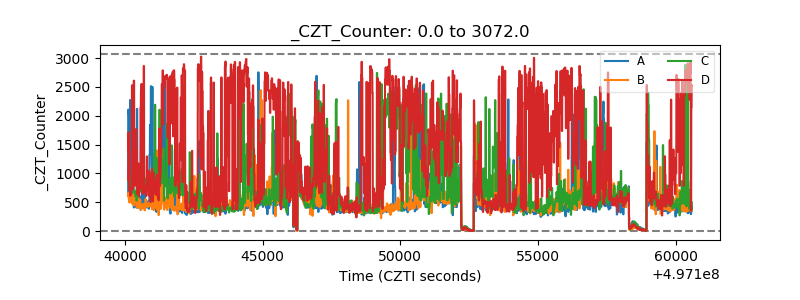 |
| +2.5 Volts monitor | 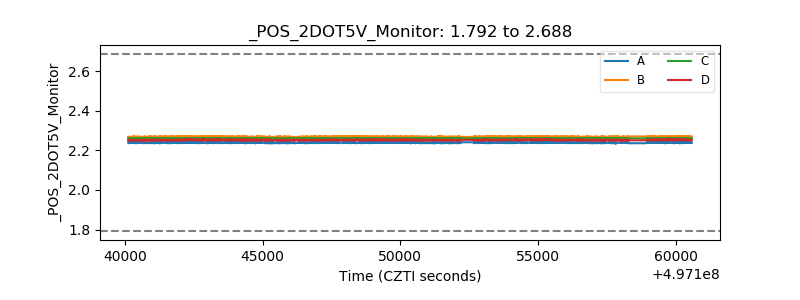 |
| +5 Volts monitor | 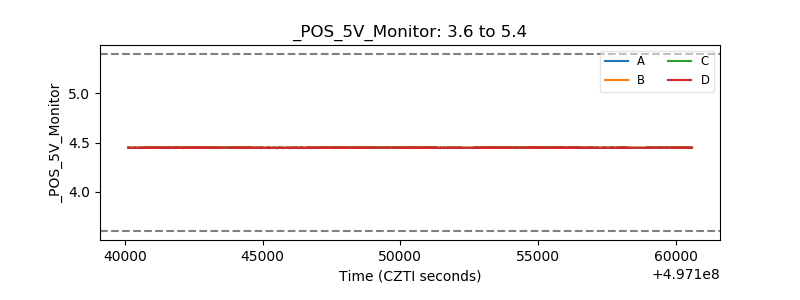 |
| _ROLL_ROT | 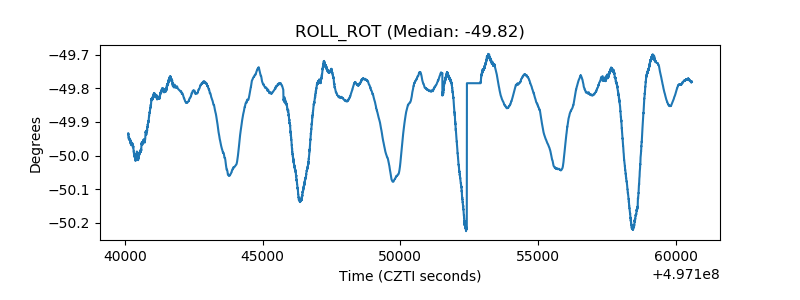 |
| _Roll_DEC | 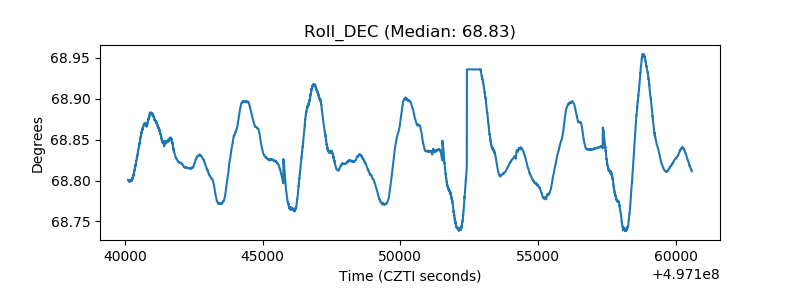 |
| _Roll_RA | 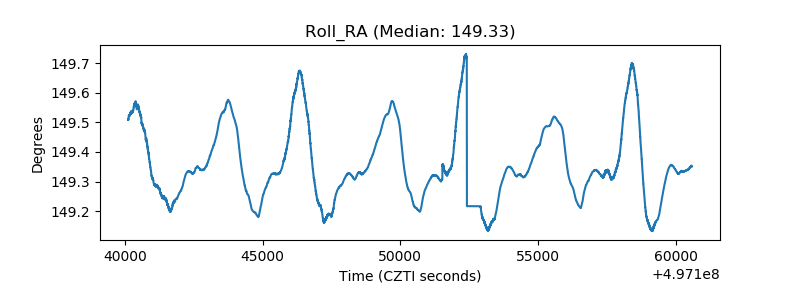 |
| Veto Counter | 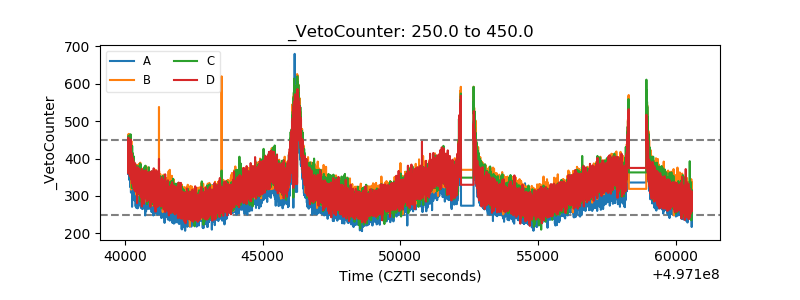 |