| Param | Original file | Final file |
|---|---|---|
| Filename | modeM0/AS1A14_012T01_9000006512_54177cztM0_level2.fits | modeM0/AS1A14_012T01_9000006512_54177cztM0_level2_quad_clean.evt |
| Size (bytes) | 610,107,840 | 82,926,720 |
| Size | 581.8 MB | 79.1 MB |
| Events in quadrant A | 3,340,068 | 579,771 |
| Events in quadrant B | 3,363,882 | 629,076 |
| Events in quadrant C | 5,981,137 | 507,181 |
| Events in quadrant D | 9,411,066 | 355,567 |
| Mode SS | |||
|---|---|---|---|
| Quadrant | BADHDUFLAG | Total packets | Discarded packets |
| A | 0 | 128 | 0 |
| B | 0 | 128 | 0 |
| C | 0 | 128 | 0 |
| D | 0 | 128 | 0 |
| Mode M0 | |||
|---|---|---|---|
| Quadrant | BADHDUFLAG | Total packets | Discarded packets |
| A | 0 | 14726 | 1 |
| B | 0 | 14469 | 1 |
| C | 0 | 22120 | 2 |
| D | 0 | 32296 | 1 |
| Mode M9 | |||
|---|---|---|---|
| Quadrant | BADHDUFLAG | Total packets | Discarded packets |
| A | 0 | 8 | 0 |
| B | 0 | 8 | 0 |
| C | 0 | 8 | 0 |
| D | 0 | 8 | 0 |
| Quadrant | Total seconds | Saturated seconds | Saturation percentage |
|---|---|---|---|
| A | 6286 | 184 | 2.927140% |
| B | 6287 | 73 | 1.161126% |
| C | 6286 | 892 | 14.190264% |
| D | 6286 | 2397 | 38.132358% |
Noise dominated data is calculated using 1-second bins in cleaned event files. If a bin has >2000 counts, and if more than 50% of those come from <1% of pixels, then it is considered to be noise-dominated and hence unusable.
| Quadrant | # 1 sec bins | Bins with >0 counts | Bins with >2000 counts | High rate bins dominated by noise | Noise dominated (total time) | Noise dominated (detector-on time) | Marked lightcurve |
|---|---|---|---|---|---|---|---|
| A | 7096 | 6287 | 121 | 121 | 1.71% | 1.92% | 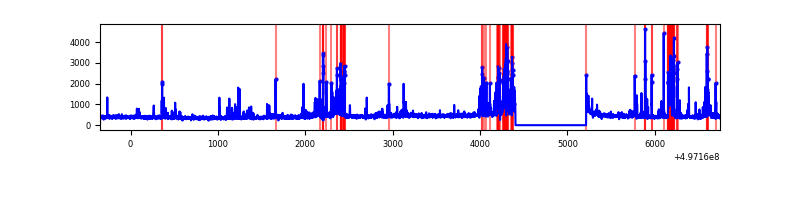 |
| B | 7097 | 6288 | 21 | 21 | 0.30% | 0.33% |  |
| C | 7096 | 6287 | 725 | 725 | 10.22% | 11.53% | 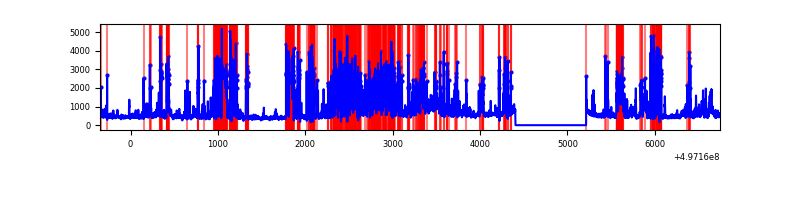 |
| D | 7096 | 6287 | 2060 | 2060 | 29.03% | 32.77% | 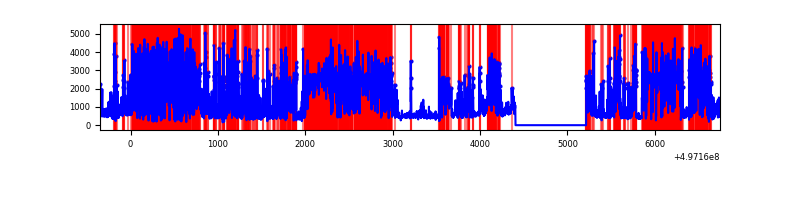 |
Top three noisy pixels from each quadrant. If the there are fewer than three noisy pixels in the level2.evt file, extra rows are filled as -1
| Pixel properties | Quadrant properties | ||||||
|---|---|---|---|---|---|---|---|
| Quadrant | DetID | PixID | Counts | Sigma | Mean | Median | Sigma |
| A | 7 | 29 | 297839 | 1856.66 | 643 | 627 | 160.1 |
| A | 15 | 174 | 291715 | 1818.41 | 643 | 627 | 160.1 |
| A | 0 | 8 | 138791 | 863.1 | 643 | 627 | 160.1 |
| B | 15 | 20 | 294366 | 2129.99 | 641 | 616 | 137.9 |
| B | 5 | 236 | 157679 | 1138.87 | 641 | 616 | 137.9 |
| B | 14 | 167 | 112959 | 814.6 | 641 | 616 | 137.9 |
| C | 15 | 177 | 2550028 | 15592.48 | 590 | 585 | 163.5 |
| C | 10 | 171 | 338073 | 2064.09 | 590 | 585 | 163.5 |
| C | 15 | 161 | 192836 | 1175.81 | 590 | 585 | 163.5 |
| D | 8 | 176 | 6742192 | 48413.15 | 484 | 461 | 139.3 |
| D | 10 | 181 | 228703 | 1639.03 | 484 | 461 | 139.3 |
| D | 2 | 165 | 194485 | 1393.31 | 484 | 461 | 139.3 |
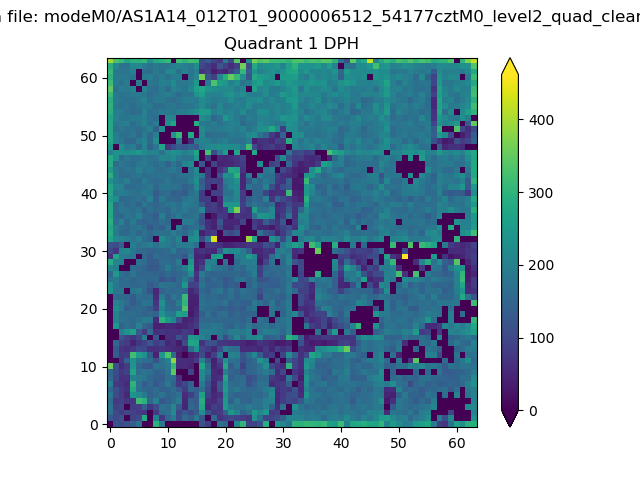
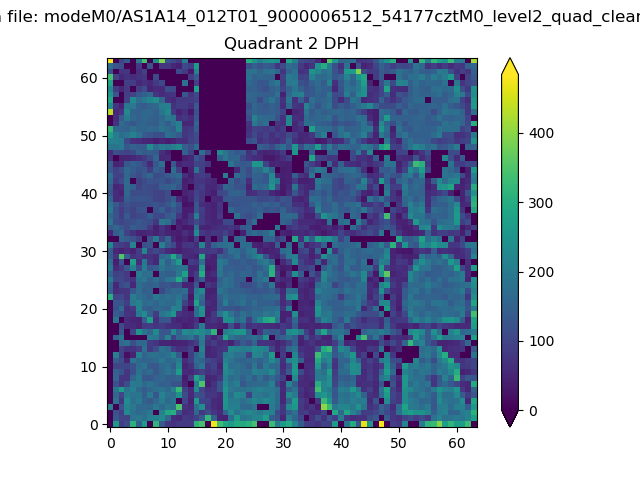
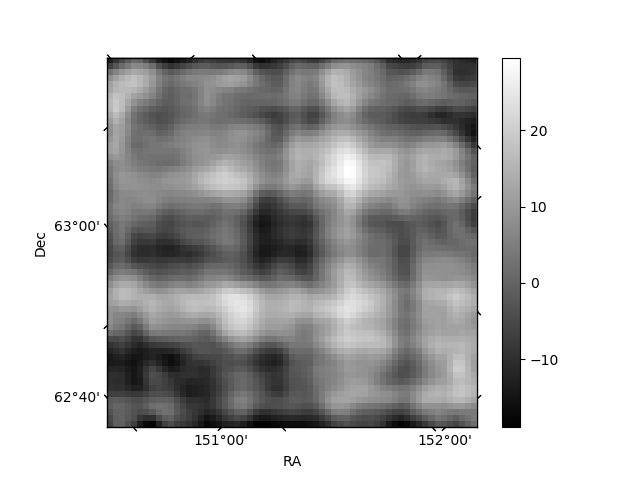
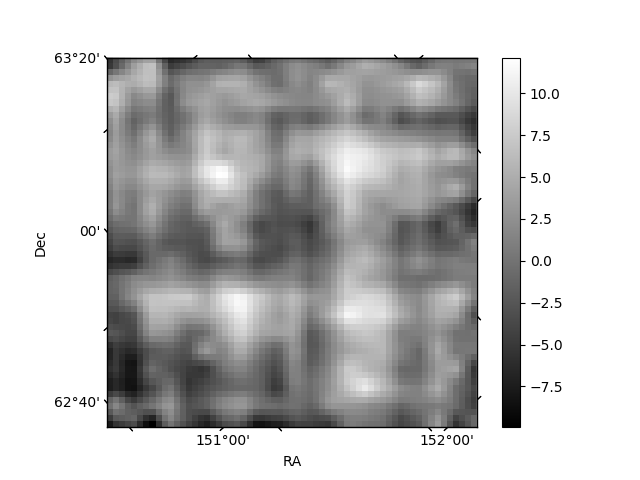
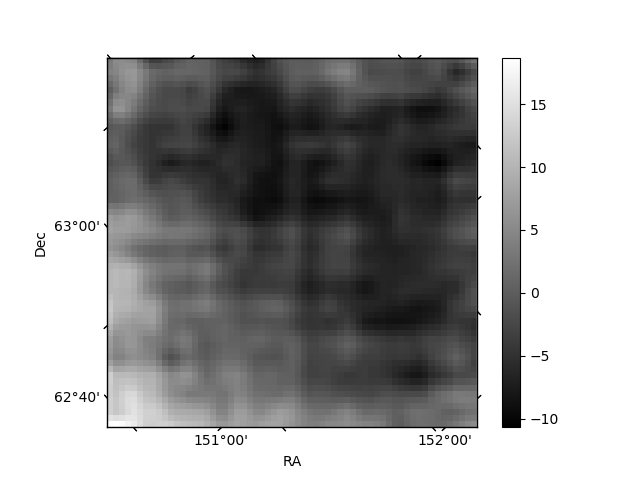
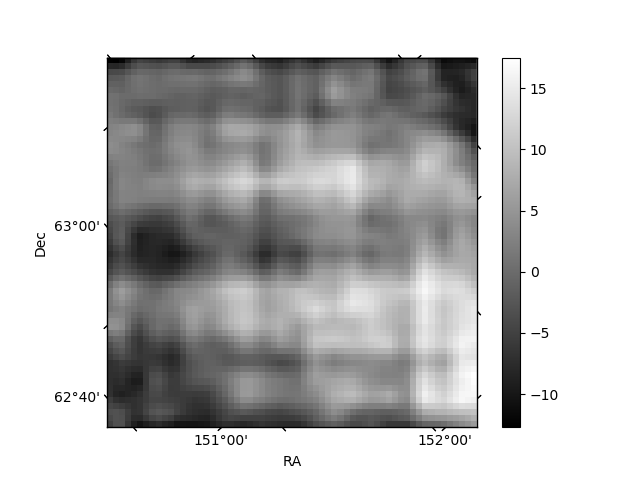
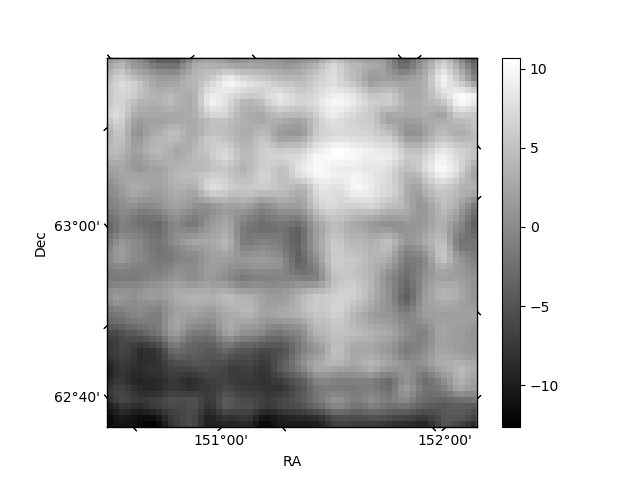
Histogram calculated using DETX and DETY for each event in the final _common_clean file
| Quadrant A | 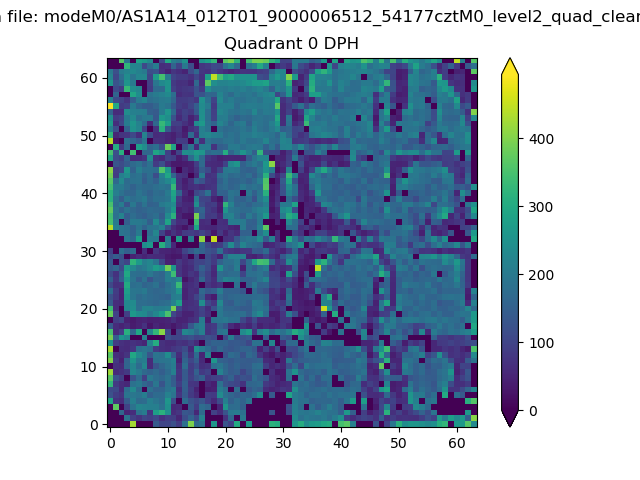 |
 |
Quadrant B |
|---|---|---|---|
| Quadrant D | 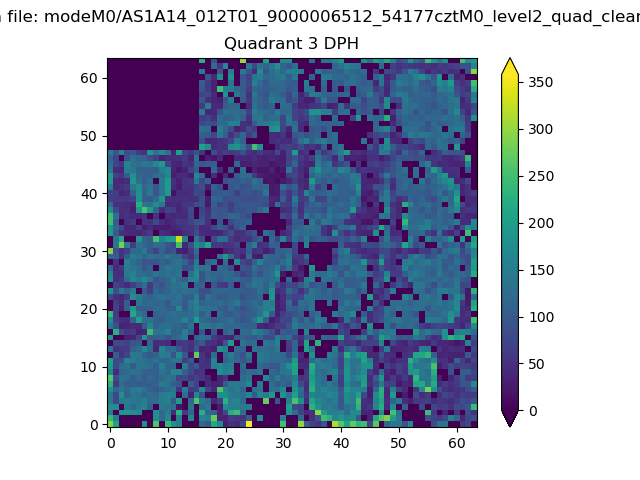 |
 |
Quadrant C |
| Plot type | Count rate plots | Images |
|---|---|---|
| Comparison with Poisson distribution Blue bars denote a histogram of data divided into 1 sec bins. Red curve is a Poisson curve with rate = median count rate of data. |
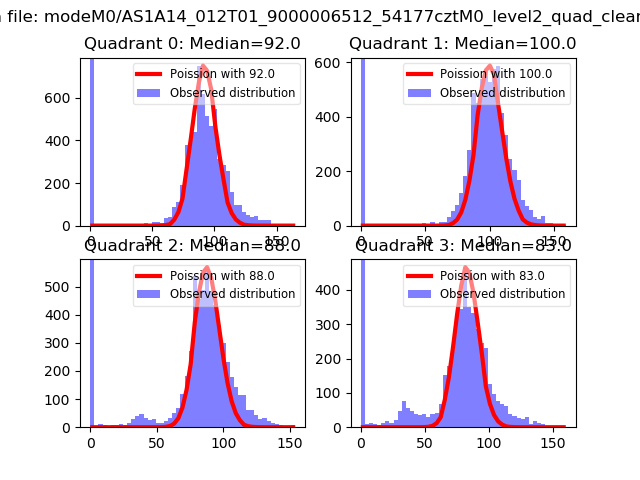 |
 |
| Quadrant-wise count rates Data is divided into 100 sec bins |
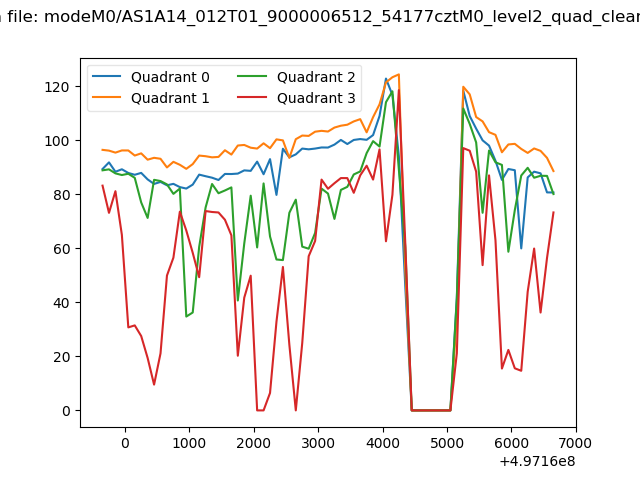 |
|
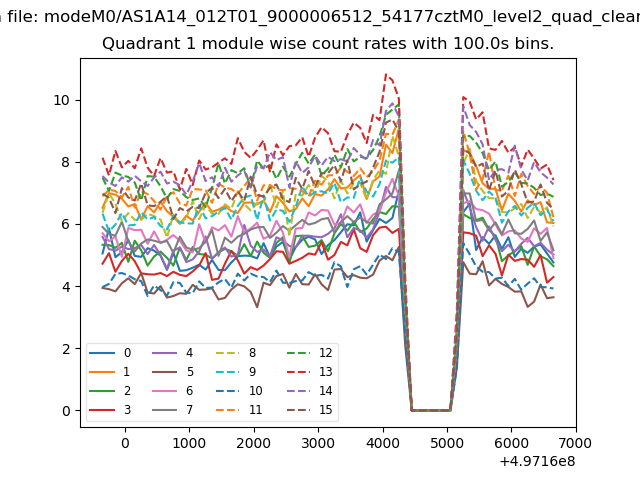
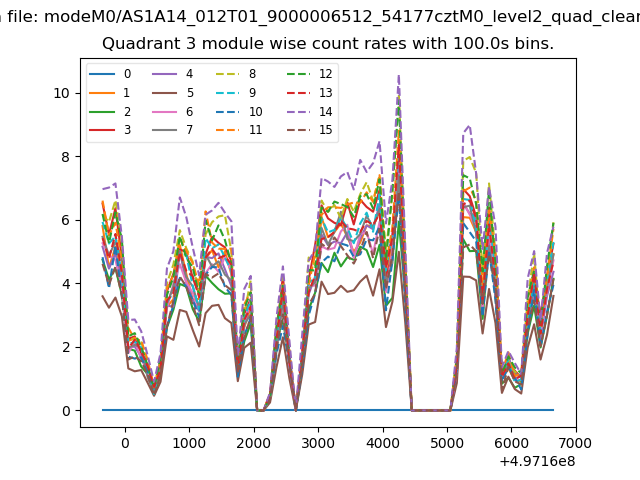
| Module-wise count rates for Quadrant A Data is divided into 100 sec bins |
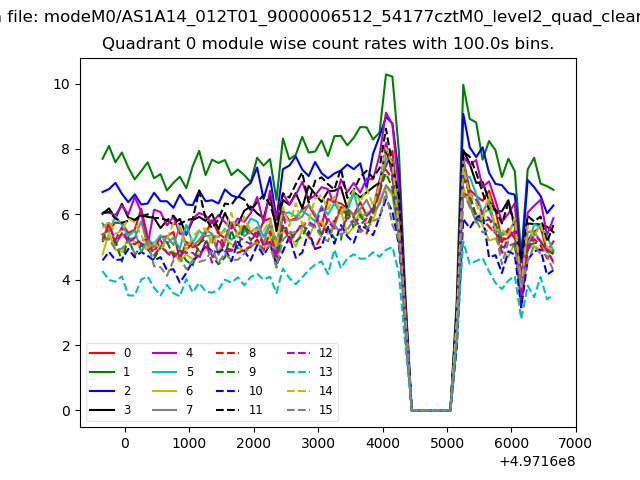 |
 |
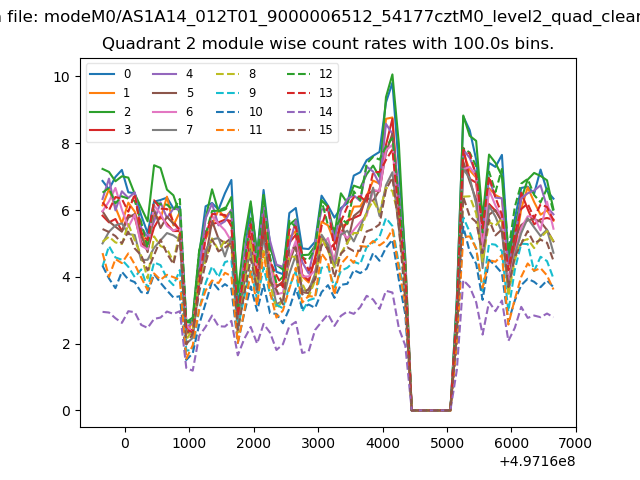
| Module-wise count rates for Quadrant B Data is divided into 100 sec bins |
 |
 |
| Module-wise count rates for Quadrant C Data is divided into 100 sec bins |
 |
 |
| Module-wise count rates for Quadrant D Data is divided into 100 sec bins |
 |
 |
| Parameter | Plot |
|---|---|
| CZT HV Monitor | 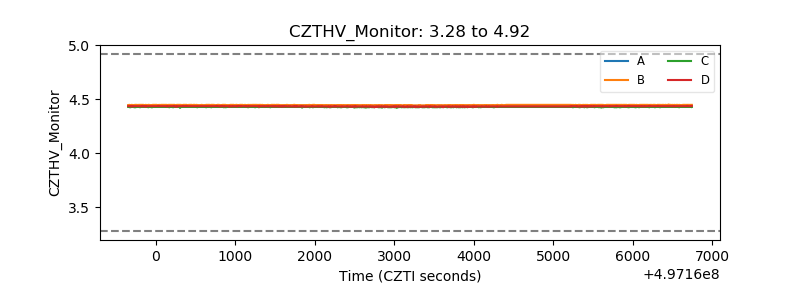 |
| D_VDD | 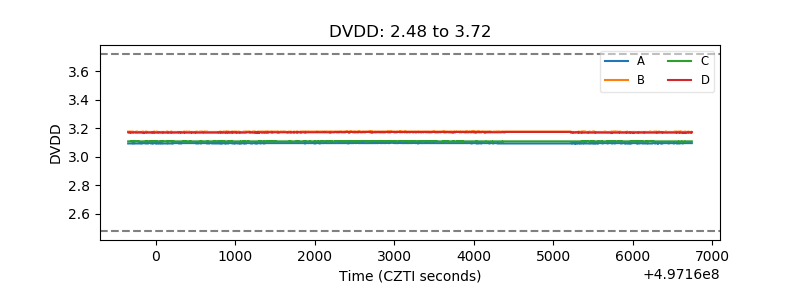 |
| Temperature 1 | 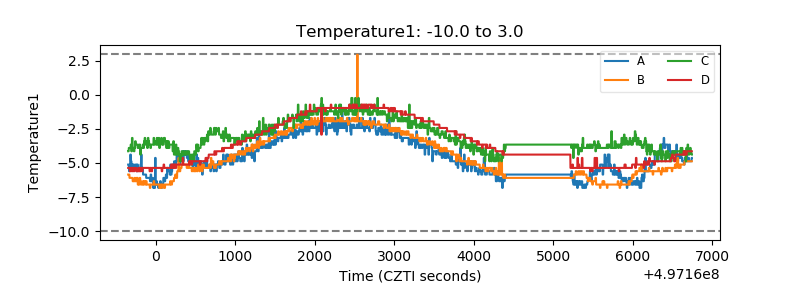 |
| Veto HV Monitor | 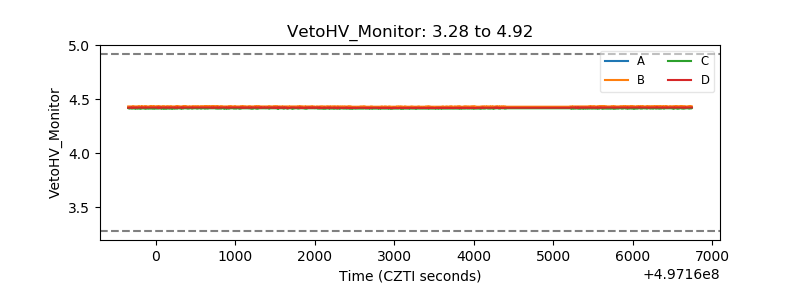 |
| Veto LLD | 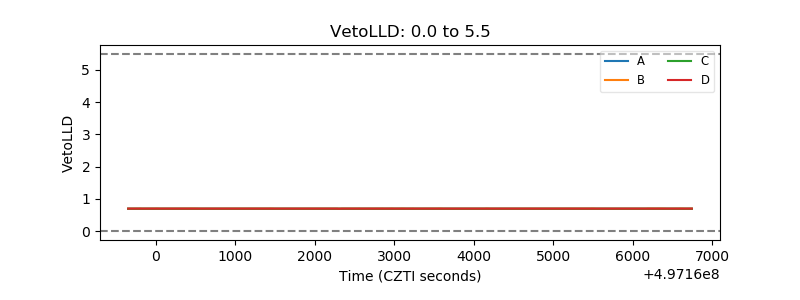 |
| Alpha Counter | 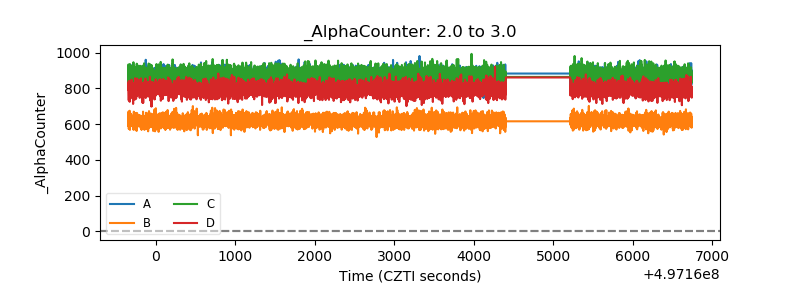 |
| _CPM_Rate | 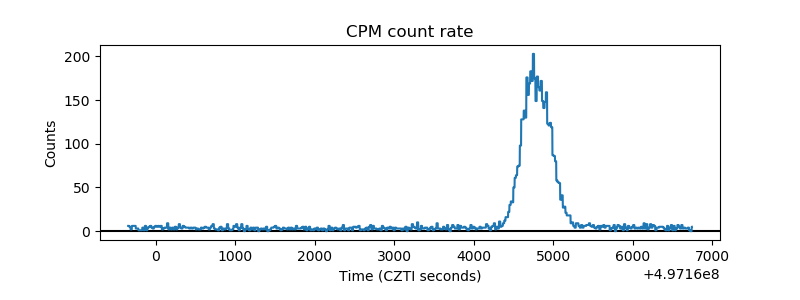 |
| CZT Counter | 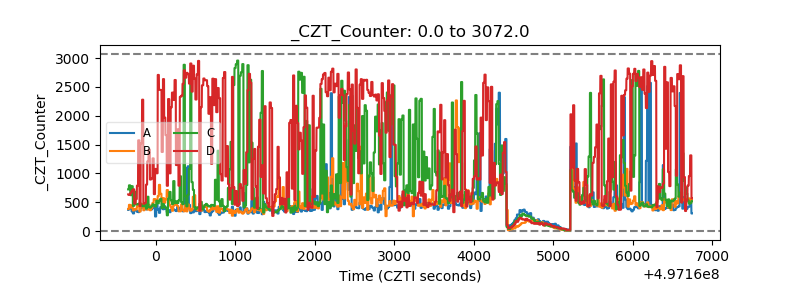 |
| +2.5 Volts monitor |  |
| +5 Volts monitor | 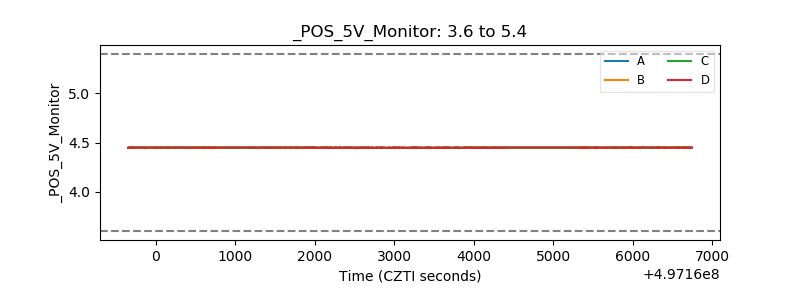 |
| _ROLL_ROT | 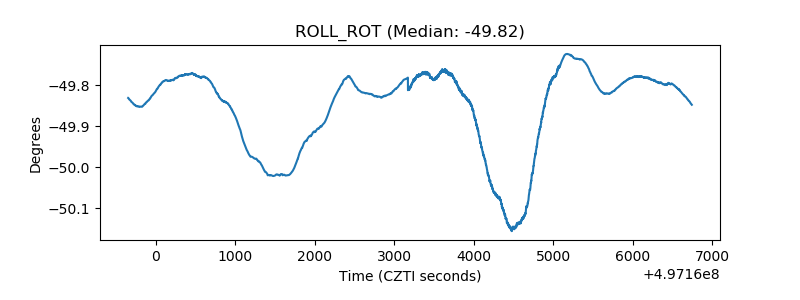 |
| _Roll_DEC | 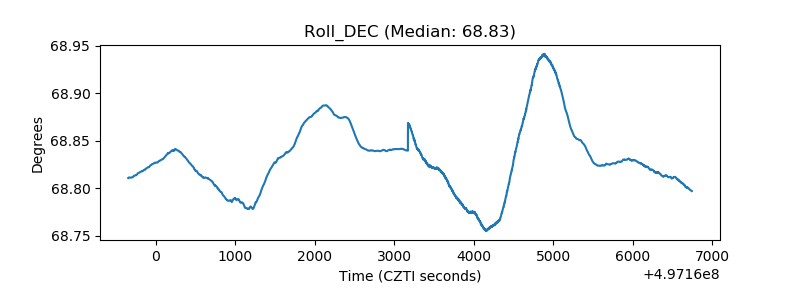 |
| _Roll_RA | 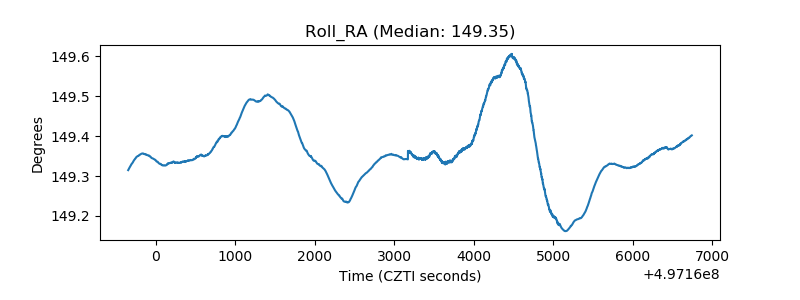 |
| Veto Counter | 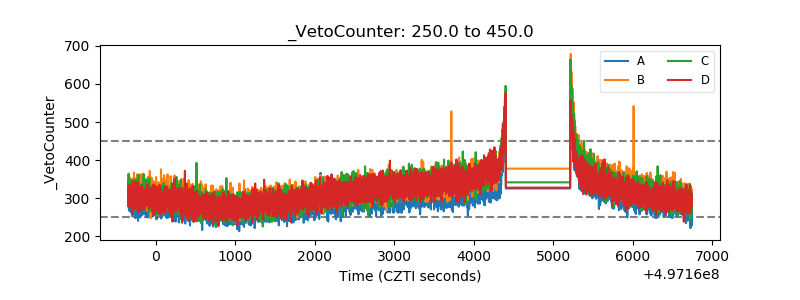 |