| Param | Original file | Final file |
|---|---|---|
| Filename | modeM0/AS1A14_012T01_9000006512_54179cztM0_level2.fits | modeM0/AS1A14_012T01_9000006512_54179cztM0_level2_quad_clean.evt |
| Size (bytes) | 621,552,960 | 88,358,400 |
| Size | 592.8 MB | 84.3 MB |
| Events in quadrant A | 4,032,606 | 598,331 |
| Events in quadrant B | 4,467,844 | 657,950 |
| Events in quadrant C | 4,533,781 | 580,307 |
| Events in quadrant D | 9,462,036 | 378,703 |
| Mode SS | |||
|---|---|---|---|
| Quadrant | BADHDUFLAG | Total packets | Discarded packets |
| A | 0 | 134 | 0 |
| B | 0 | 134 | 0 |
| C | 0 | 134 | 0 |
| D | 0 | 134 | 0 |
| Mode M0 | |||
|---|---|---|---|
| Quadrant | BADHDUFLAG | Total packets | Discarded packets |
| A | 0 | 16920 | 1 |
| B | 0 | 17820 | 1 |
| C | 0 | 17944 | 1 |
| D | 0 | 32618 | 1 |
| Mode M9 | |||
|---|---|---|---|
| Quadrant | BADHDUFLAG | Total packets | Discarded packets |
| A | 0 | 9 | 0 |
| B | 0 | 9 | 0 |
| C | 0 | 9 | 0 |
| D | 0 | 9 | 0 |
| Quadrant | Total seconds | Saturated seconds | Saturation percentage |
|---|---|---|---|
| A | 6593 | 362 | 5.490672% |
| B | 6594 | 228 | 3.457689% |
| C | 6594 | 295 | 4.473764% |
| D | 6594 | 2385 | 36.169245% |
Noise dominated data is calculated using 1-second bins in cleaned event files. If a bin has >2000 counts, and if more than 50% of those come from <1% of pixels, then it is considered to be noise-dominated and hence unusable.
| Quadrant | # 1 sec bins | Bins with >0 counts | Bins with >2000 counts | High rate bins dominated by noise | Noise dominated (total time) | Noise dominated (detector-on time) | Marked lightcurve |
|---|---|---|---|---|---|---|---|
| A | 7518 | 6594 | 238 | 238 | 3.17% | 3.61% | 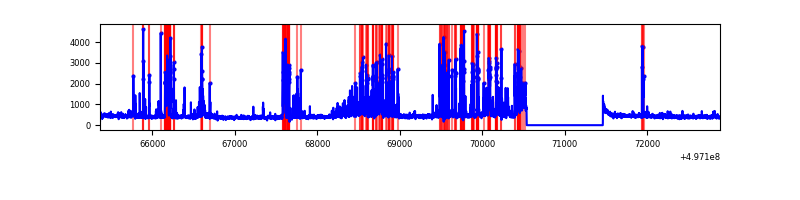 |
| B | 7519 | 6595 | 121 | 121 | 1.61% | 1.83% | 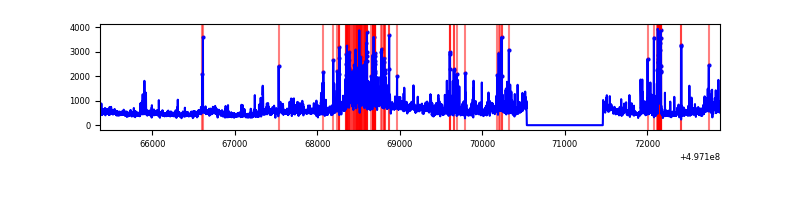 |
| C | 7519 | 6595 | 247 | 247 | 3.29% | 3.75% | 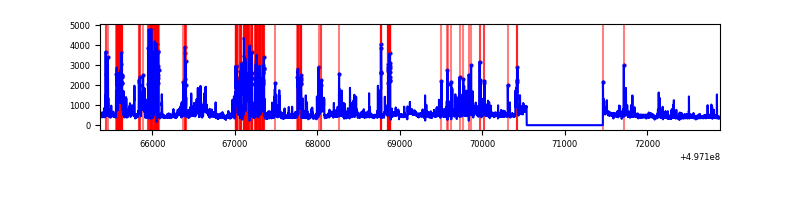 |
| D | 7519 | 6595 | 2217 | 2217 | 29.49% | 33.62% | 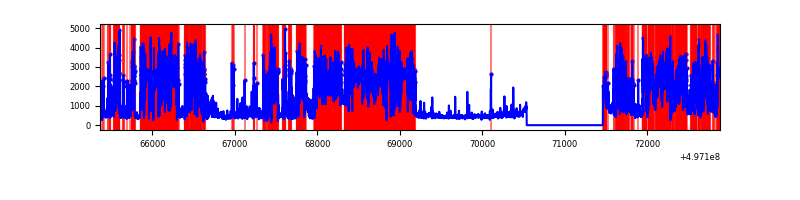 |
Top three noisy pixels from each quadrant. If the there are fewer than three noisy pixels in the level2.evt file, extra rows are filled as -1
| Pixel properties | Quadrant properties | ||||||
|---|---|---|---|---|---|---|---|
| Quadrant | DetID | PixID | Counts | Sigma | Mean | Median | Sigma |
| A | 7 | 29 | 862211 | 5132.48 | 676 | 660 | 167.9 |
| A | 15 | 174 | 313581 | 1864.15 | 676 | 660 | 167.9 |
| A | 0 | 8 | 152311 | 903.42 | 676 | 660 | 167.9 |
| B | 14 | 167 | 573907 | 3972.02 | 674 | 651 | 144.3 |
| B | 5 | 185 | 450657 | 3118.04 | 674 | 651 | 144.3 |
| B | 15 | 20 | 336043 | 2323.89 | 674 | 651 | 144.3 |
| C | 15 | 177 | 850054 | 4673.88 | 654 | 647 | 181.7 |
| C | 15 | 215 | 365047 | 2005.12 | 654 | 647 | 181.7 |
| C | 10 | 171 | 305154 | 1675.56 | 654 | 647 | 181.7 |
| D | 8 | 176 | 6799961 | 44602.24 | 528 | 503 | 152.4 |
| D | 10 | 181 | 271794 | 1779.58 | 528 | 503 | 152.4 |
| D | 3 | 12 | 116194 | 758.9 | 528 | 503 | 152.4 |
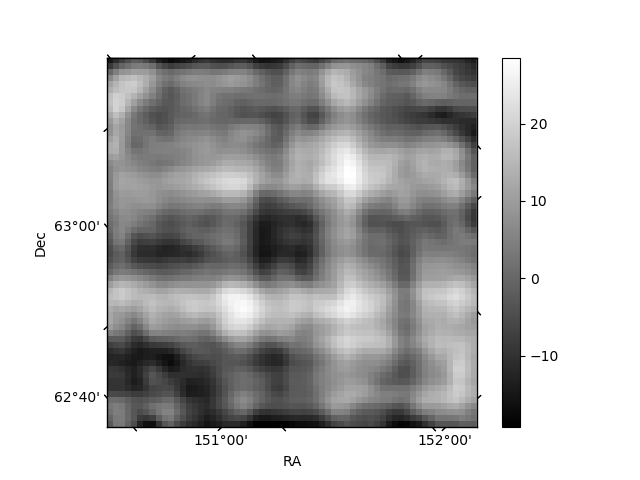
Histogram calculated using DETX and DETY for each event in the final _common_clean file
| Quadrant A | 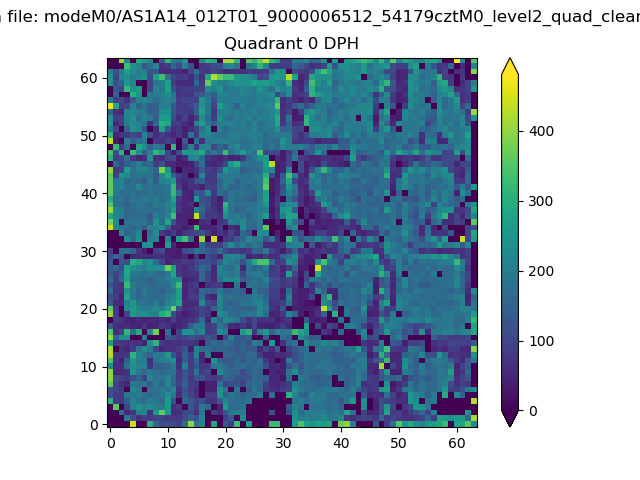 |
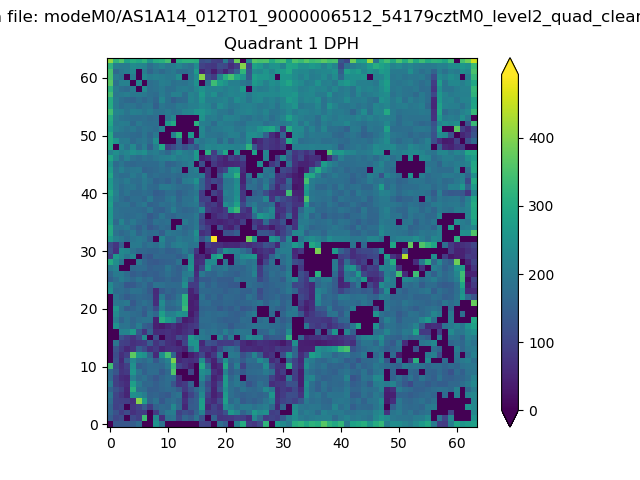 |
Quadrant B |
|---|---|---|---|
| Quadrant D | 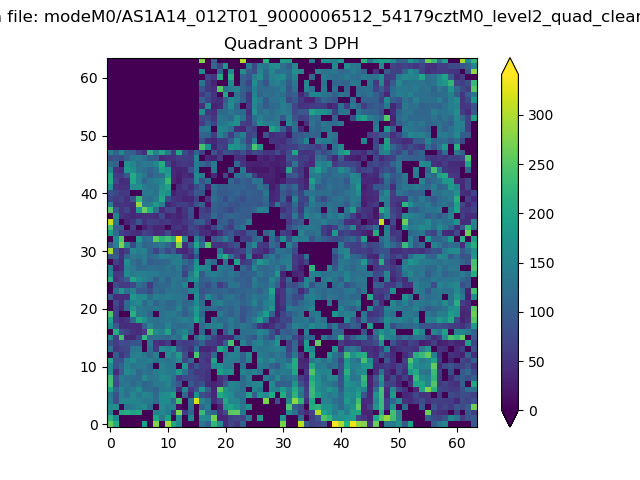 |
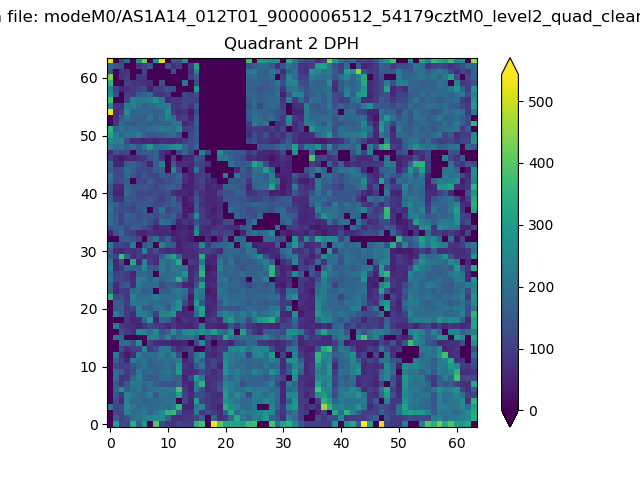 |
Quadrant C |
| Plot type | Count rate plots | Images |
|---|---|---|
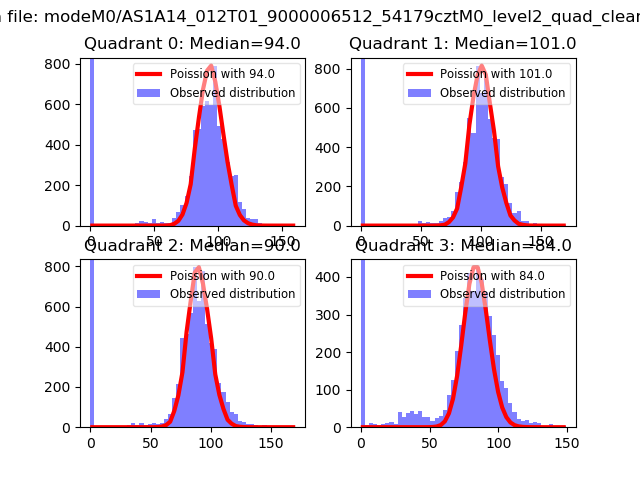
| Comparison with Poisson distribution Blue bars denote a histogram of data divided into 1 sec bins. Red curve is a Poisson curve with rate = median count rate of data. |
 |
 |
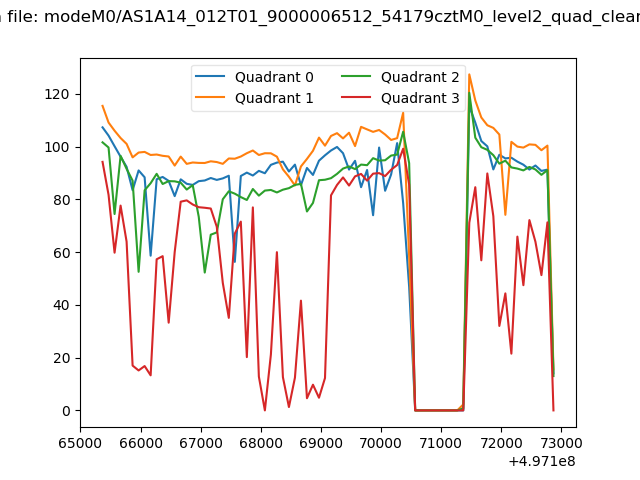
| Quadrant-wise count rates Data is divided into 100 sec bins |
 |
|
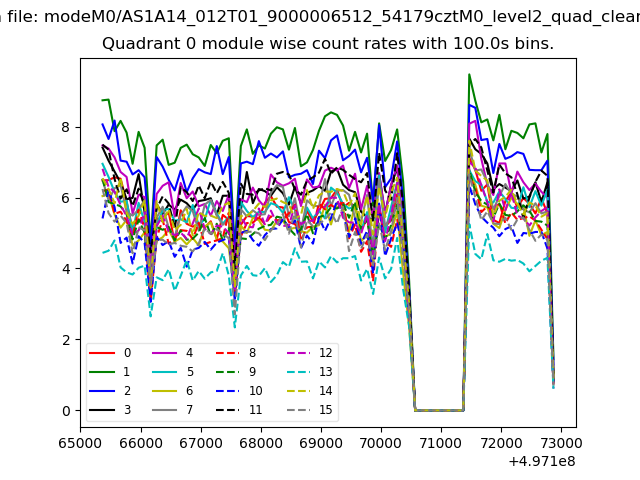
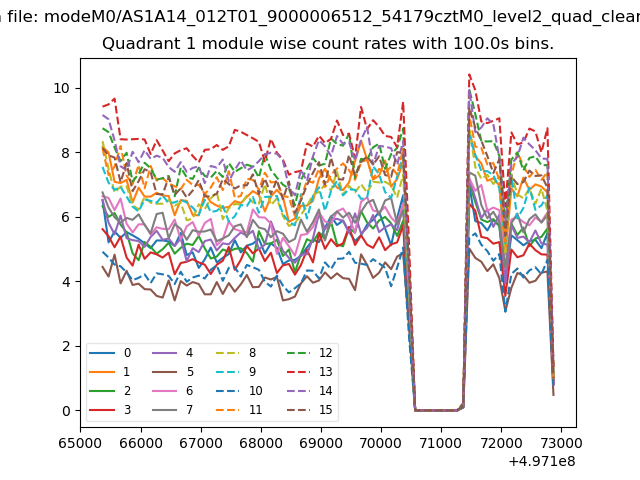
| Module-wise count rates for Quadrant A Data is divided into 100 sec bins |
 |
 |
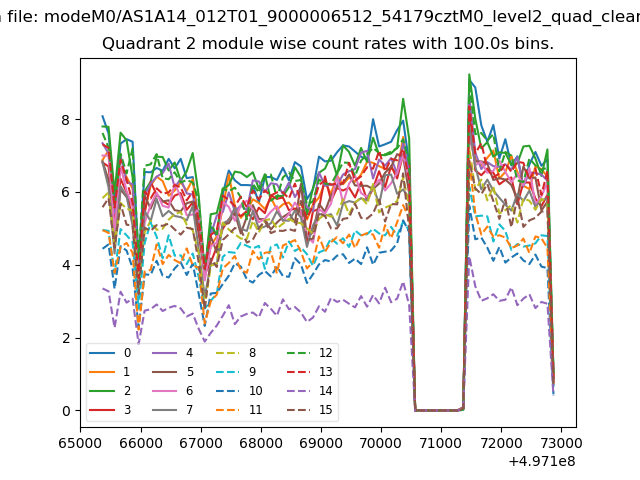
| Module-wise count rates for Quadrant B Data is divided into 100 sec bins |
 |
 |
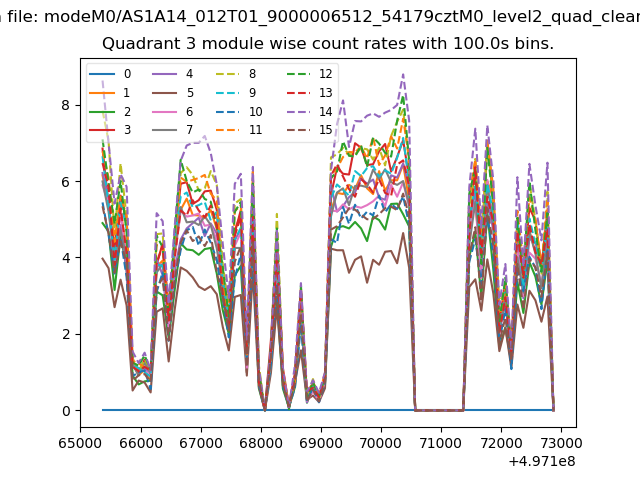
| Module-wise count rates for Quadrant C Data is divided into 100 sec bins |
 |
 |
| Module-wise count rates for Quadrant D Data is divided into 100 sec bins |
 |
 |
| Parameter | Plot |
|---|---|
| CZT HV Monitor | 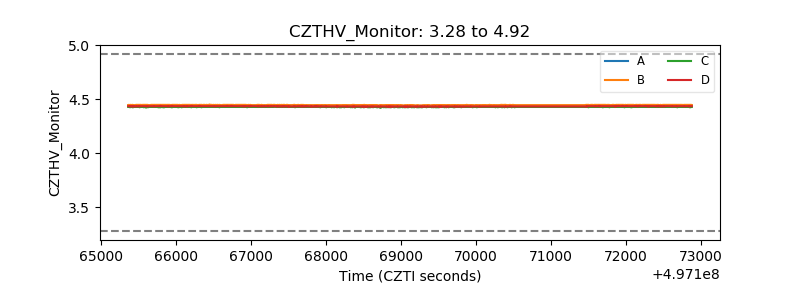 |
| D_VDD | 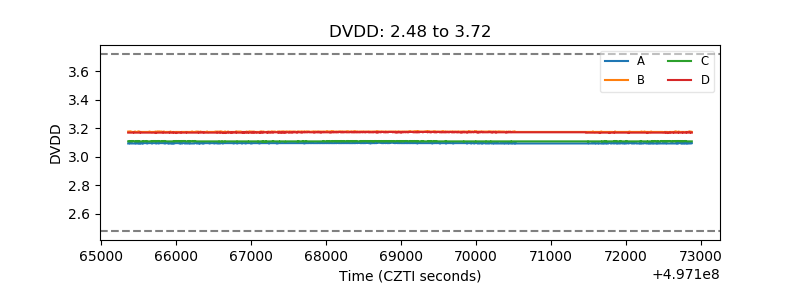 |
| Temperature 1 | 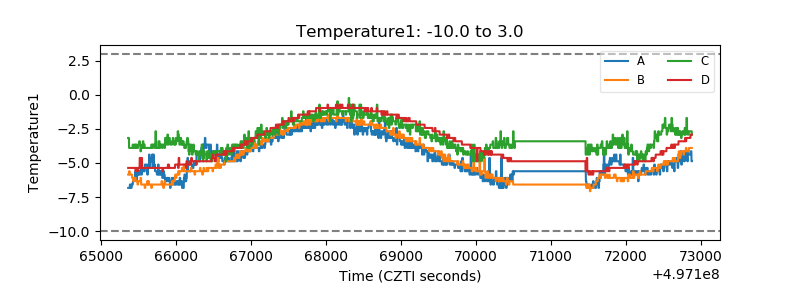 |
| Veto HV Monitor | 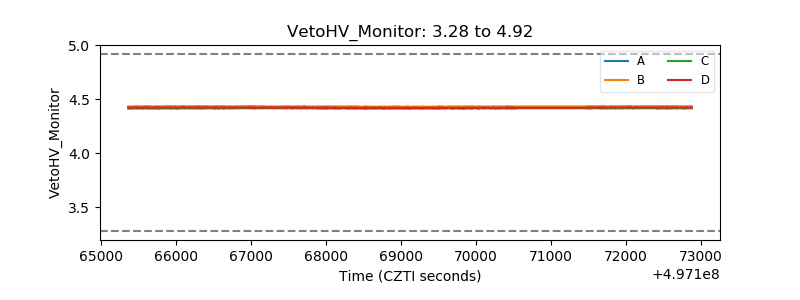 |
| Veto LLD | 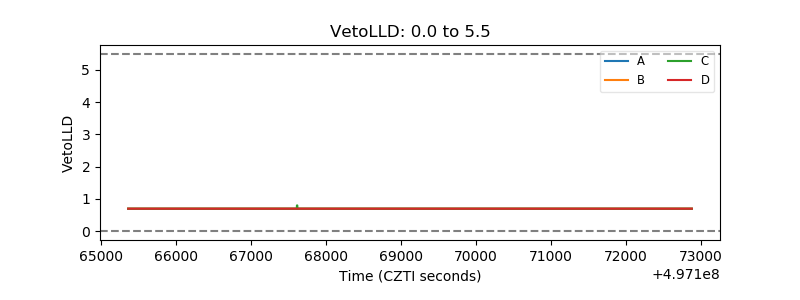 |
| Alpha Counter | 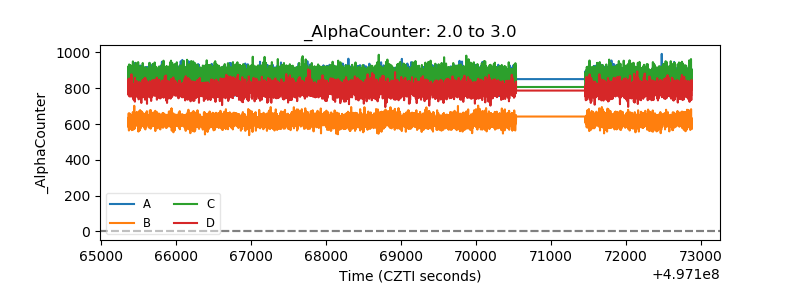 |
| _CPM_Rate | 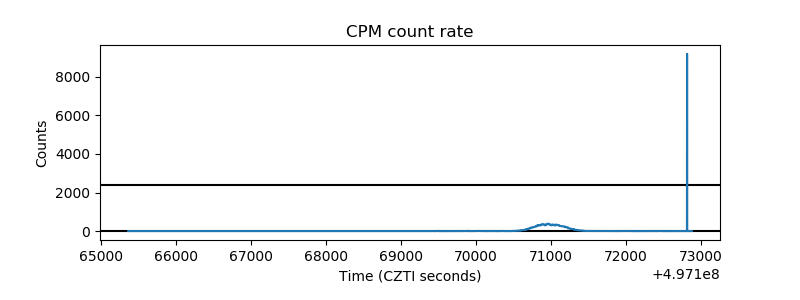 |
| CZT Counter | 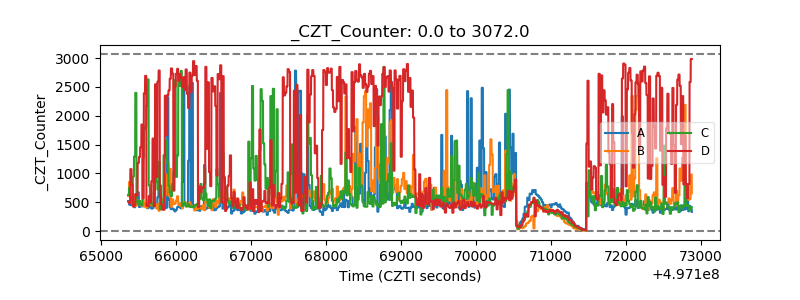 |
| +2.5 Volts monitor |  |
| +5 Volts monitor | 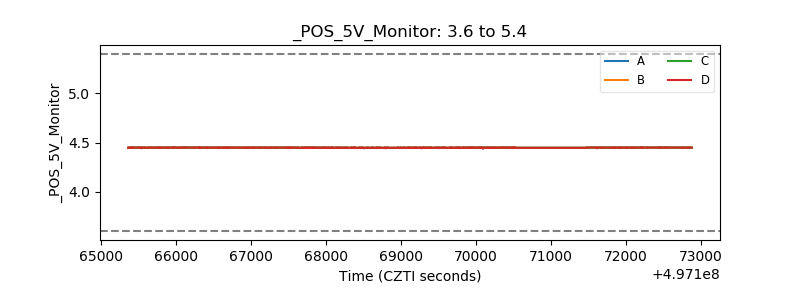 |
| _ROLL_ROT | 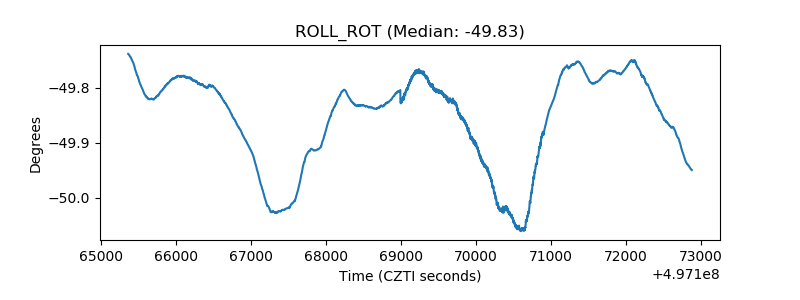 |
| _Roll_DEC | 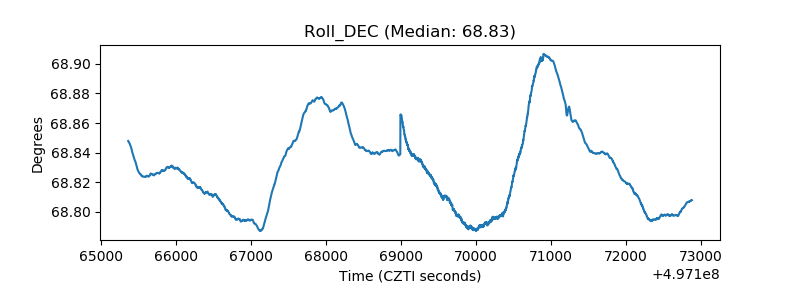 |
| _Roll_RA | 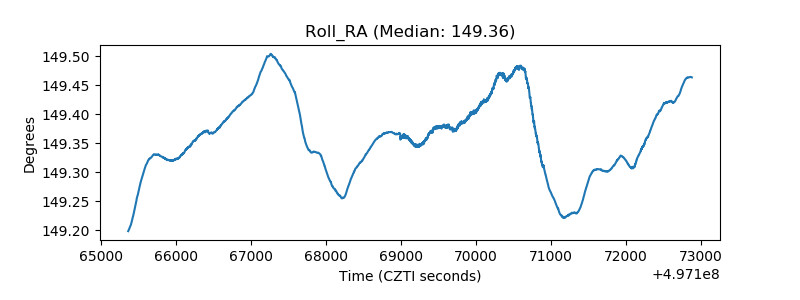 |
| Veto Counter | 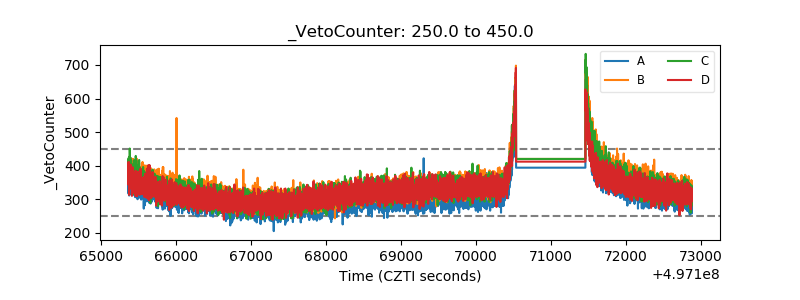 |