| Param | Original file | Final file |
|---|---|---|
| Filename | modeM0/AS1A14_012T01_9000006512_54181cztM0_level2.fits | modeM0/AS1A14_012T01_9000006512_54181cztM0_level2_quad_clean.evt |
| Size (bytes) | 508,512,960 | 95,544,000 |
| Size | 485.0 MB | 91.1 MB |
| Events in quadrant A | 3,748,286 | 636,464 |
| Events in quadrant B | 4,873,776 | 679,334 |
| Events in quadrant C | 3,718,696 | 609,491 |
| Events in quadrant D | 5,979,118 | 515,270 |
| Mode SS | |||
|---|---|---|---|
| Quadrant | BADHDUFLAG | Total packets | Discarded packets |
| A | 0 | 132 | 0 |
| B | 0 | 132 | 0 |
| C | 0 | 132 | 0 |
| D | 0 | 132 | 0 |
| Mode M0 | |||
|---|---|---|---|
| Quadrant | BADHDUFLAG | Total packets | Discarded packets |
| A | 0 | 15690 | 1 |
| B | 0 | 19036 | 1 |
| C | 0 | 15507 | 1 |
| D | 0 | 22267 | 1 |
| Mode M9 | |||
|---|---|---|---|
| Quadrant | BADHDUFLAG | Total packets | Discarded packets |
| A | 0 | 11 | 0 |
| B | 0 | 11 | 0 |
| C | 0 | 11 | 0 |
| D | 0 | 11 | 0 |
| Quadrant | Total seconds | Saturated seconds | Saturation percentage |
|---|---|---|---|
| A | 6486 | 266 | 4.101141% |
| B | 6485 | 292 | 4.502699% |
| C | 6485 | 131 | 2.020046% |
| D | 6485 | 883 | 13.616037% |
Noise dominated data is calculated using 1-second bins in cleaned event files. If a bin has >2000 counts, and if more than 50% of those come from <1% of pixels, then it is considered to be noise-dominated and hence unusable.
| Quadrant | # 1 sec bins | Bins with >0 counts | Bins with >2000 counts | High rate bins dominated by noise | Noise dominated (total time) | Noise dominated (detector-on time) | Marked lightcurve |
|---|---|---|---|---|---|---|---|
| A | 7601 | 6487 | 173 | 173 | 2.28% | 2.67% | 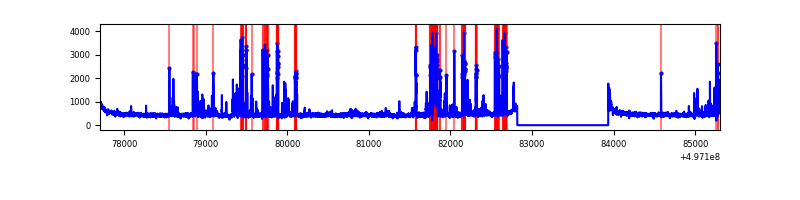 |
| B | 7600 | 6486 | 158 | 158 | 2.08% | 2.44% | 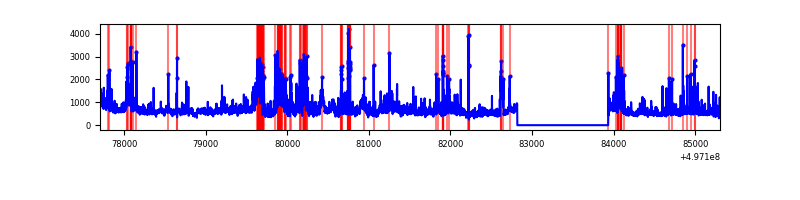 |
| C | 7600 | 6486 | 98 | 98 | 1.29% | 1.51% | 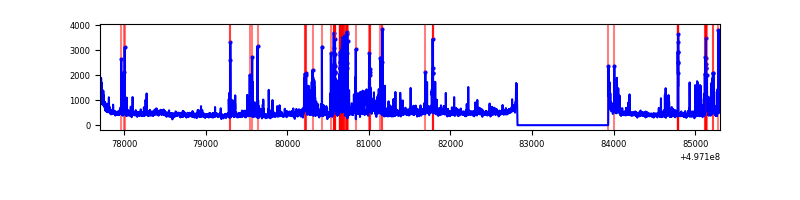 |
| D | 7600 | 6486 | 824 | 824 | 10.84% | 12.70% | 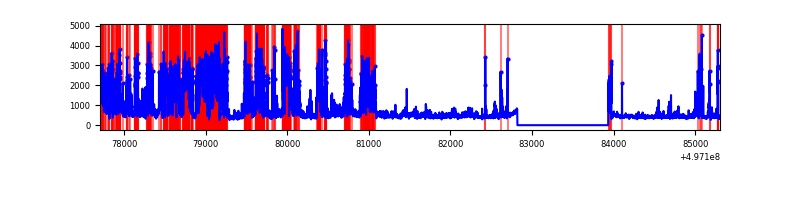 |
Top three noisy pixels from each quadrant. If the there are fewer than three noisy pixels in the level2.evt file, extra rows are filled as -1
| Pixel properties | Quadrant properties | ||||||
|---|---|---|---|---|---|---|---|
| Quadrant | DetID | PixID | Counts | Sigma | Mean | Median | Sigma |
| A | 15 | 174 | 474575 | 2750.7 | 692 | 676 | 172.3 |
| A | 7 | 29 | 387206 | 2243.57 | 692 | 676 | 172.3 |
| A | 13 | 248 | 84842 | 488.53 | 692 | 676 | 172.3 |
| B | 5 | 236 | 597669 | 4124.67 | 680 | 657 | 144.7 |
| B | 14 | 167 | 581782 | 4014.91 | 680 | 657 | 144.7 |
| B | 15 | 20 | 427546 | 2949.32 | 680 | 657 | 144.7 |
| C | 15 | 177 | 261064 | 1410.19 | 669 | 664 | 184.7 |
| C | 12 | 252 | 213175 | 1150.85 | 669 | 664 | 184.7 |
| C | 10 | 171 | 207715 | 1121.28 | 669 | 664 | 184.7 |
| D | 8 | 176 | 3088347 | 16955.09 | 640 | 611 | 182.1 |
| D | 3 | 12 | 72239 | 393.32 | 640 | 611 | 182.1 |
| D | 7 | 62 | 66374 | 361.11 | 640 | 611 | 182.1 |
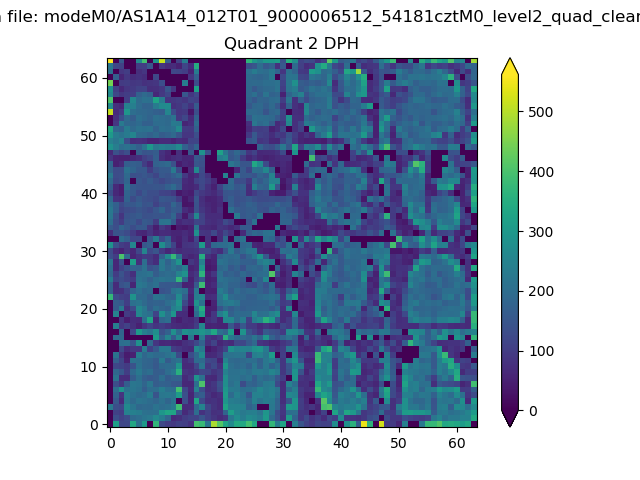
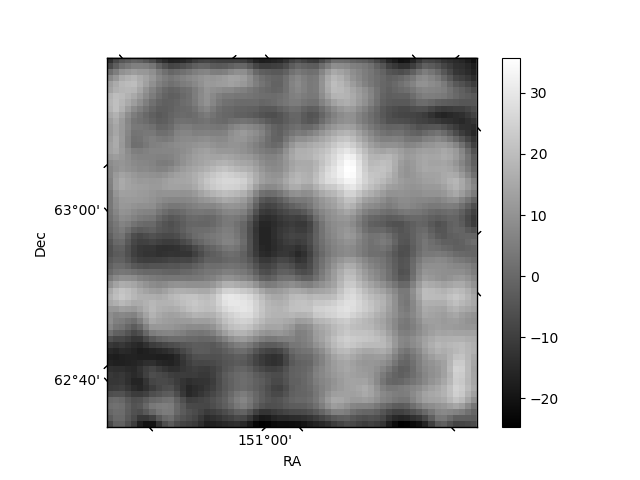
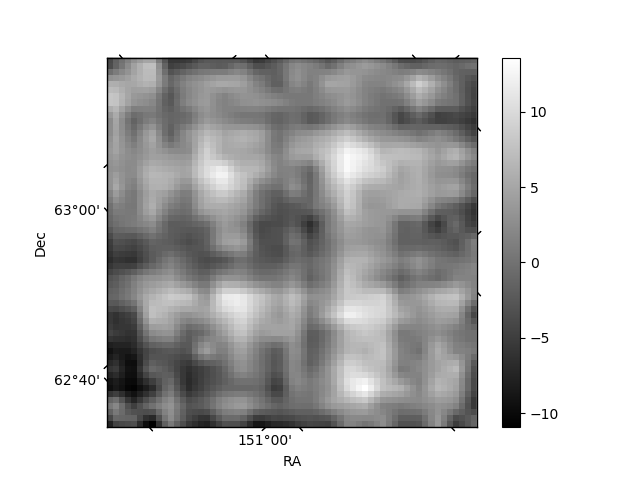
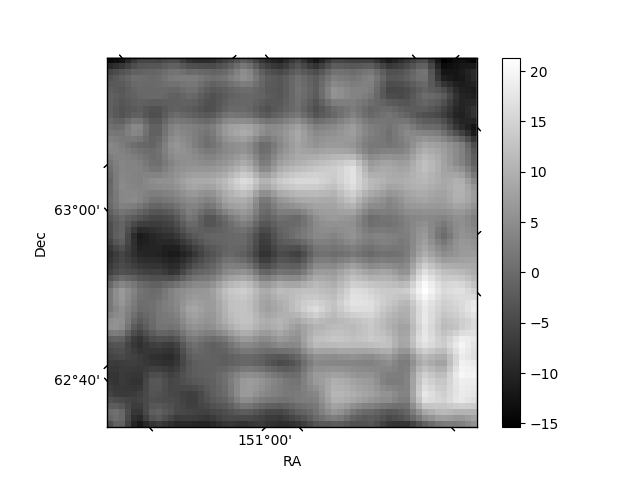
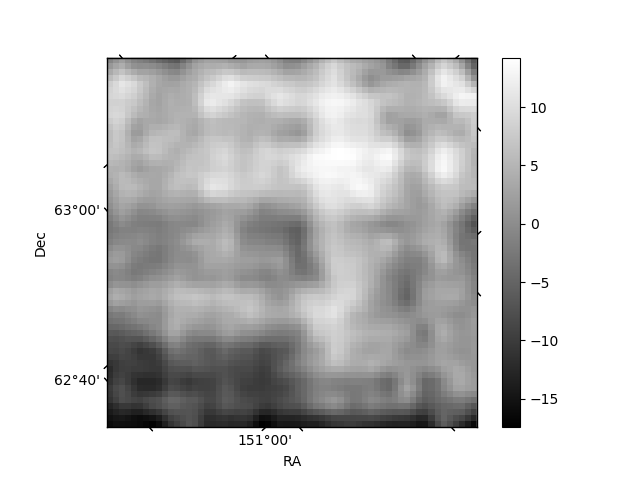
Histogram calculated using DETX and DETY for each event in the final _common_clean file
| Quadrant A | 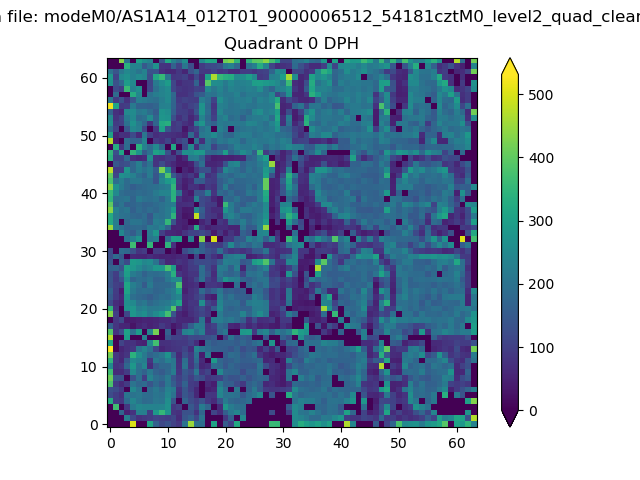 |
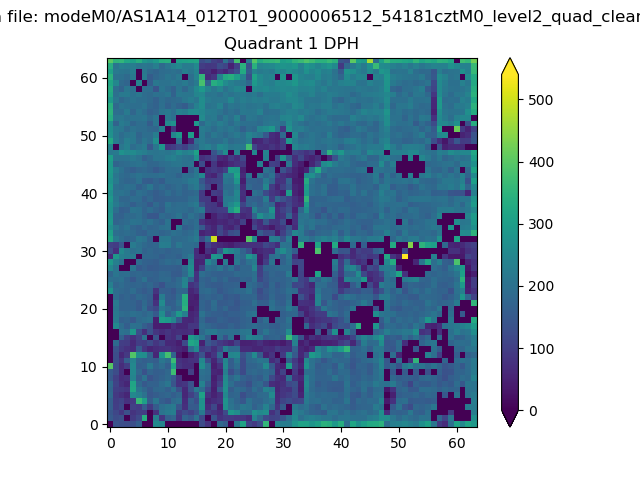 |
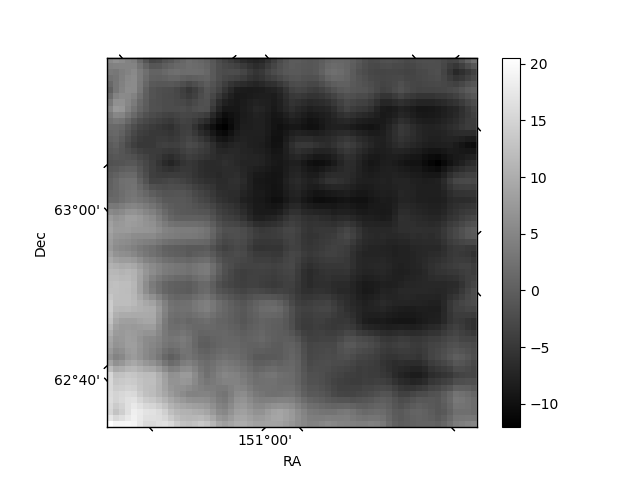
Quadrant B |
|---|---|---|---|
| Quadrant D | 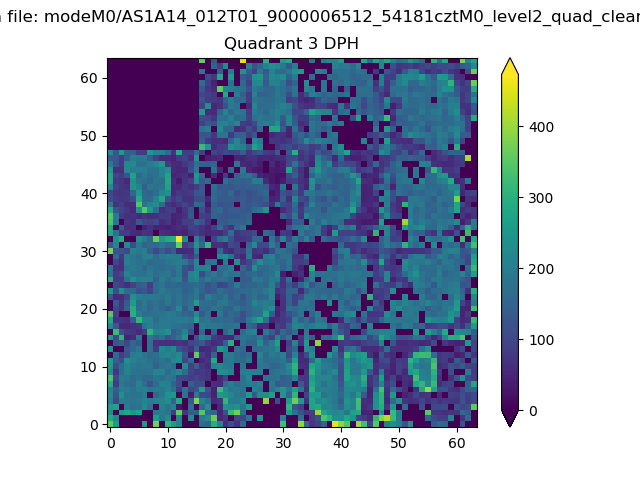 |
 |
Quadrant C |
| Plot type | Count rate plots | Images |
|---|---|---|
| Comparison with Poisson distribution Blue bars denote a histogram of data divided into 1 sec bins. Red curve is a Poisson curve with rate = median count rate of data. |
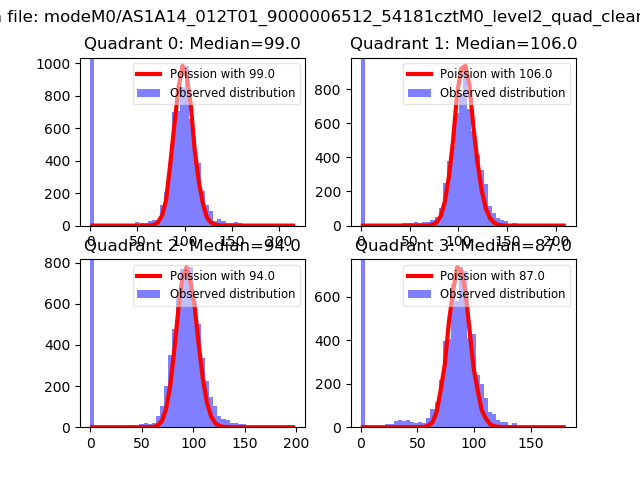 |
 |
| Quadrant-wise count rates Data is divided into 100 sec bins |
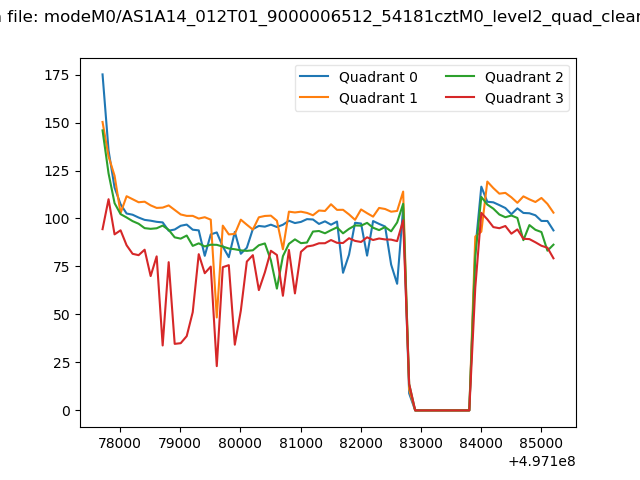 |
|
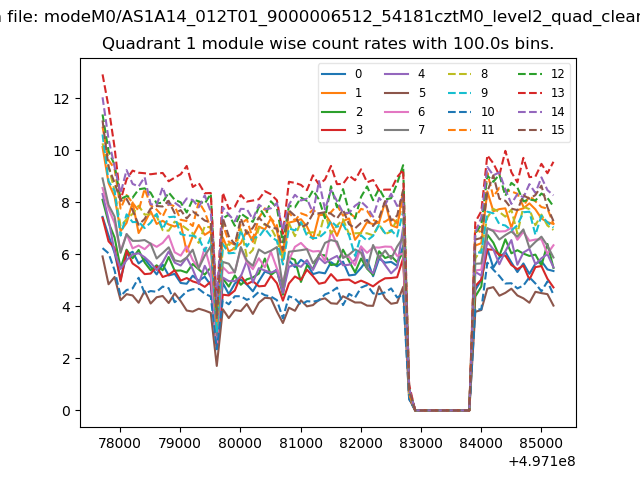
| Module-wise count rates for Quadrant A Data is divided into 100 sec bins |
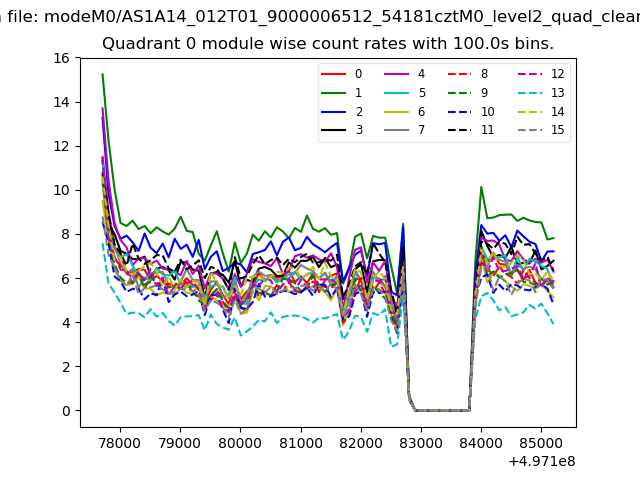 |
 |
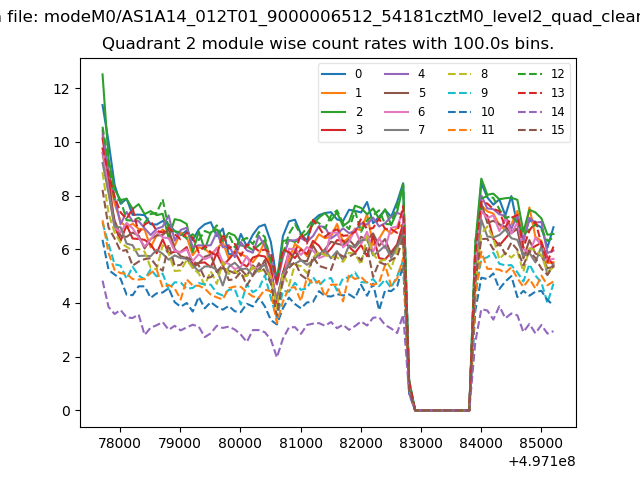
| Module-wise count rates for Quadrant B Data is divided into 100 sec bins |
 |
 |
| Module-wise count rates for Quadrant C Data is divided into 100 sec bins |
 |
 |
| Module-wise count rates for Quadrant D Data is divided into 100 sec bins |
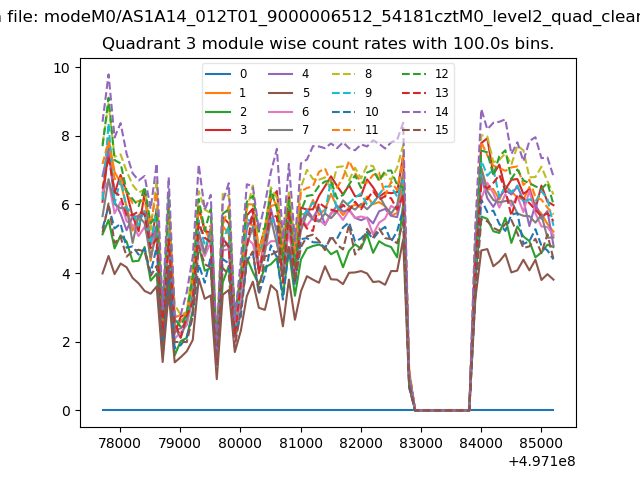 |
 |
| Parameter | Plot |
|---|---|
| CZT HV Monitor | 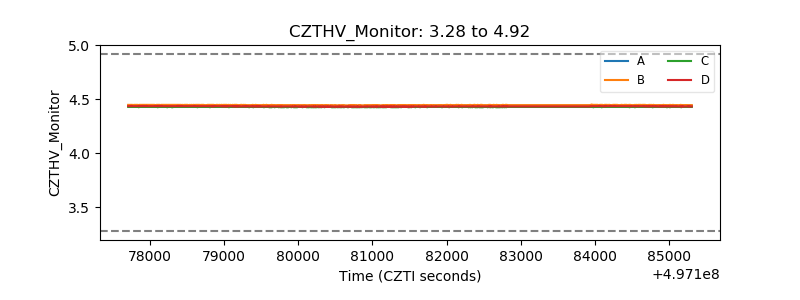 |
| D_VDD | 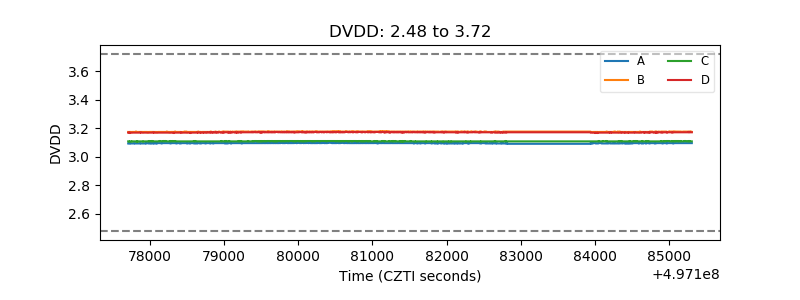 |
| Temperature 1 | 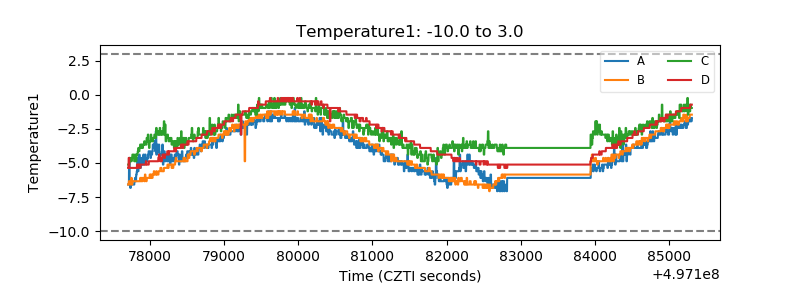 |
| Veto HV Monitor | 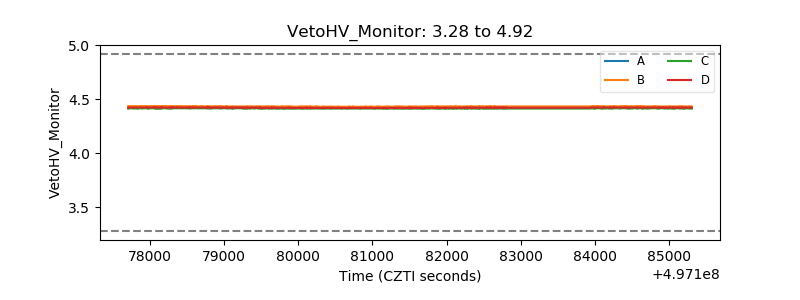 |
| Veto LLD | 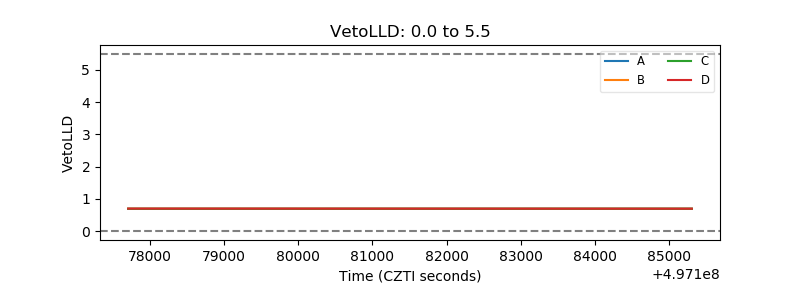 |
| Alpha Counter | 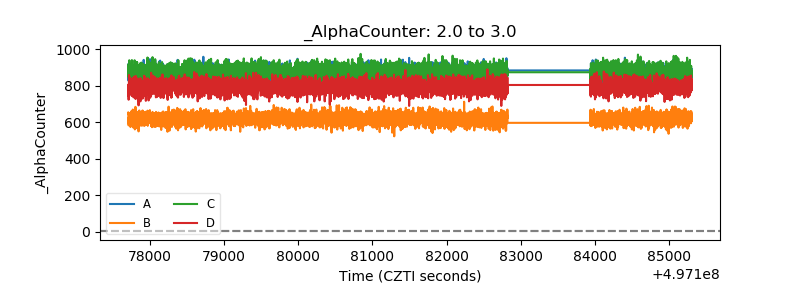 |
| _CPM_Rate | 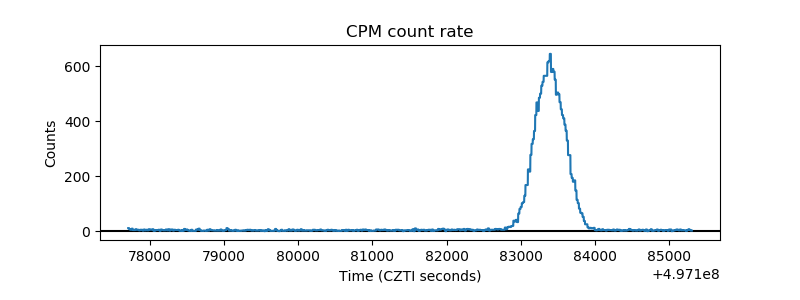 |
| CZT Counter | 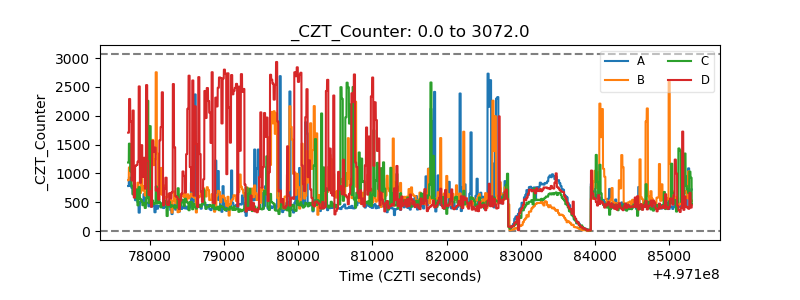 |
| +2.5 Volts monitor |  |
| +5 Volts monitor |  |
| _ROLL_ROT | 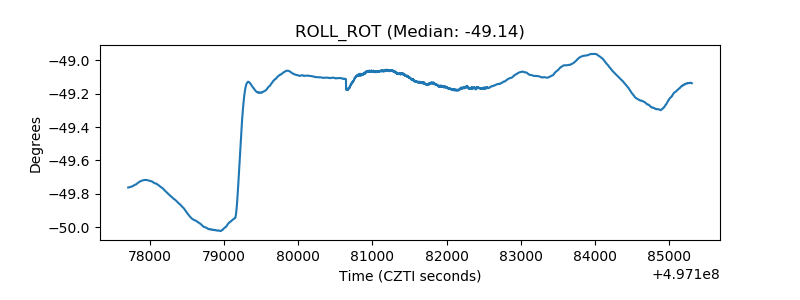 |
| _Roll_DEC | 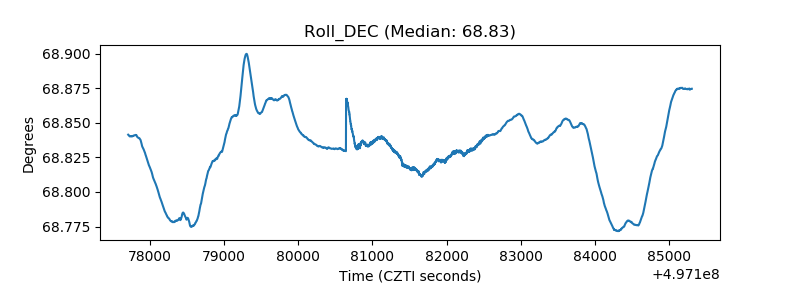 |
| _Roll_RA | 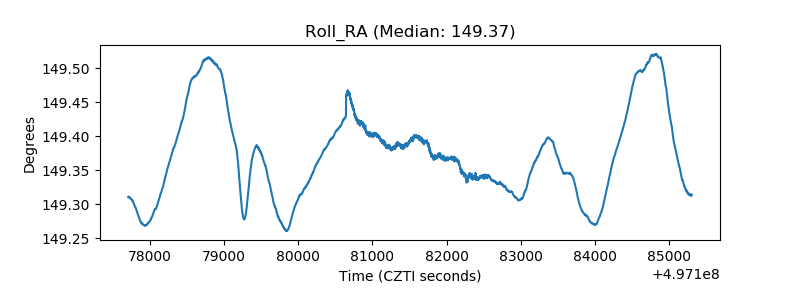 |
| Veto Counter | 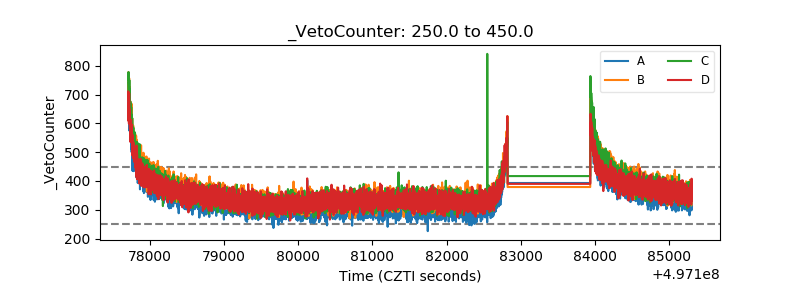 |