| Param | Original file | Final file |
|---|---|---|
| Filename | modeM0/AS1A14_012T01_9000006512_54183cztM0_level2.fits | modeM0/AS1A14_012T01_9000006512_54183cztM0_level2_quad_clean.evt |
| Size (bytes) | 562,924,800 | 77,702,400 |
| Size | 536.8 MB | 74.1 MB |
| Events in quadrant A | 4,622,021 | 482,499 |
| Events in quadrant B | 3,695,693 | 575,029 |
| Events in quadrant C | 8,037,997 | 382,017 |
| Events in quadrant D | 3,994,163 | 473,848 |
| Mode SS | |||
|---|---|---|---|
| Quadrant | BADHDUFLAG | Total packets | Discarded packets |
| A | 0 | 130 | 0 |
| B | 0 | 130 | 0 |
| C | 0 | 130 | 0 |
| D | 0 | 130 | 0 |
| Mode M0 | |||
|---|---|---|---|
| Quadrant | BADHDUFLAG | Total packets | Discarded packets |
| A | 0 | 18052 | 2 |
| B | 0 | 15267 | 1 |
| C | 0 | 28175 | 1 |
| D | 0 | 16321 | 1 |
| Mode M9 | |||
|---|---|---|---|
| Quadrant | BADHDUFLAG | Total packets | Discarded packets |
| A | 0 | 10 | 0 |
| B | 0 | 10 | 0 |
| C | 0 | 10 | 0 |
| D | 0 | 10 | 0 |
| Quadrant | Total seconds | Saturated seconds | Saturation percentage |
|---|---|---|---|
| A | 6282 | 381 | 6.064947% |
| B | 6282 | 199 | 3.167781% |
| C | 6282 | 1838 | 29.258198% |
| D | 6283 | 263 | 4.185898% |
Noise dominated data is calculated using 1-second bins in cleaned event files. If a bin has >2000 counts, and if more than 50% of those come from <1% of pixels, then it is considered to be noise-dominated and hence unusable.
| Quadrant | # 1 sec bins | Bins with >0 counts | Bins with >2000 counts | High rate bins dominated by noise | Noise dominated (total time) | Noise dominated (detector-on time) | Marked lightcurve |
|---|---|---|---|---|---|---|---|
| A | 7606 | 6438 | 257 | 257 | 3.38% | 3.99% | 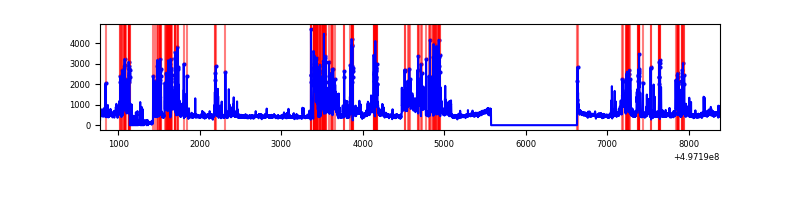 |
| B | 7606 | 6552 | 95 | 95 | 1.25% | 1.45% | 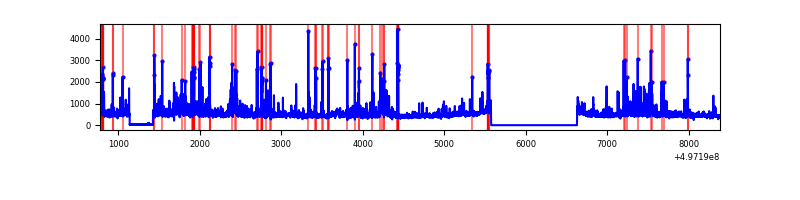 |
| C | 7606 | 6551 | 1538 | 1538 | 20.22% | 23.48% | 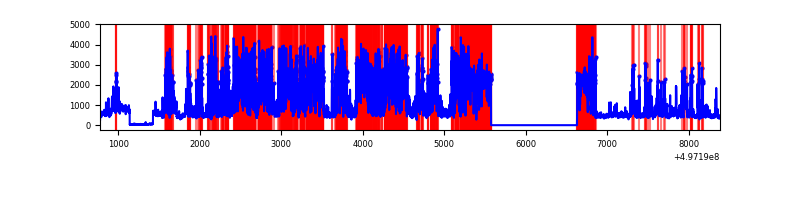 |
| D | 7607 | 6553 | 216 | 216 | 2.84% | 3.30% | 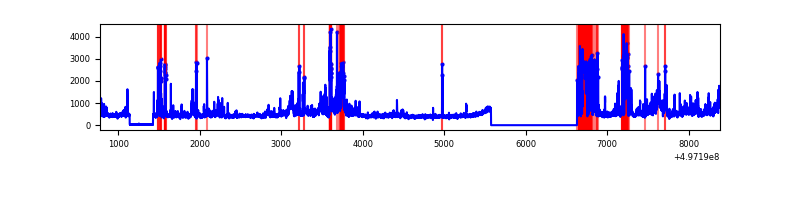 |
Top three noisy pixels from each quadrant. If the there are fewer than three noisy pixels in the level2.evt file, extra rows are filled as -1
| Pixel properties | Quadrant properties | ||||||
|---|---|---|---|---|---|---|---|
| Quadrant | DetID | PixID | Counts | Sigma | Mean | Median | Sigma |
| A | 13 | 248 | 1127674 | 6864.69 | 655 | 638 | 164.2 |
| A | 15 | 174 | 549605 | 3343.71 | 655 | 638 | 164.2 |
| A | 3 | 14 | 132821 | 805.12 | 655 | 638 | 164.2 |
| B | 5 | 236 | 485297 | 3488.18 | 651 | 627 | 138.9 |
| B | 5 | 185 | 181500 | 1301.75 | 651 | 627 | 138.9 |
| B | 15 | 20 | 150862 | 1081.24 | 651 | 627 | 138.9 |
| C | 15 | 177 | 4594778 | 30567.97 | 544 | 540 | 150.3 |
| C | 15 | 215 | 299189 | 1987.07 | 544 | 540 | 150.3 |
| C | 15 | 161 | 236357 | 1569.02 | 544 | 540 | 150.3 |
| D | 2 | 165 | 415405 | 2327.46 | 632 | 603 | 178.2 |
| D | 3 | 12 | 393439 | 2204.21 | 632 | 603 | 178.2 |
| D | 8 | 176 | 374366 | 2097.19 | 632 | 603 | 178.2 |
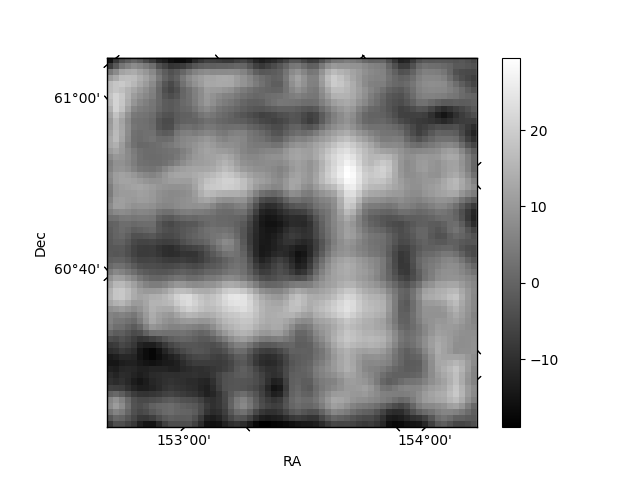
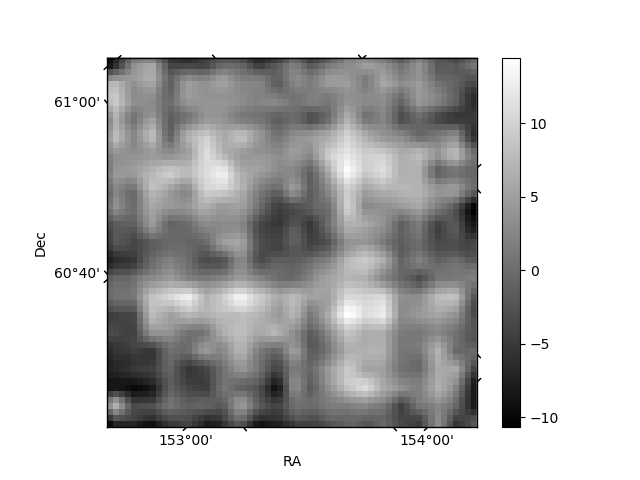
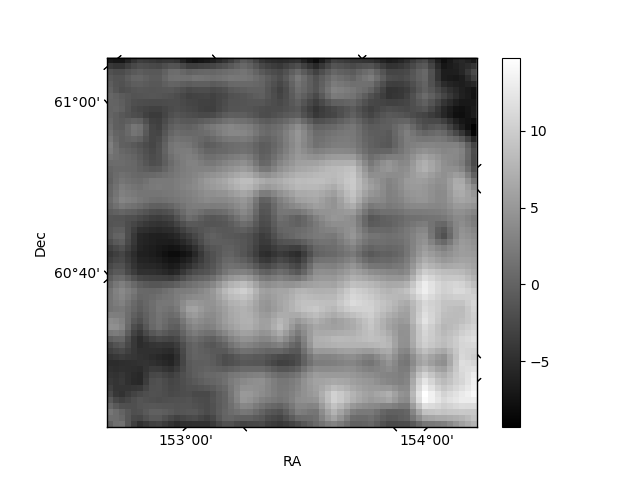
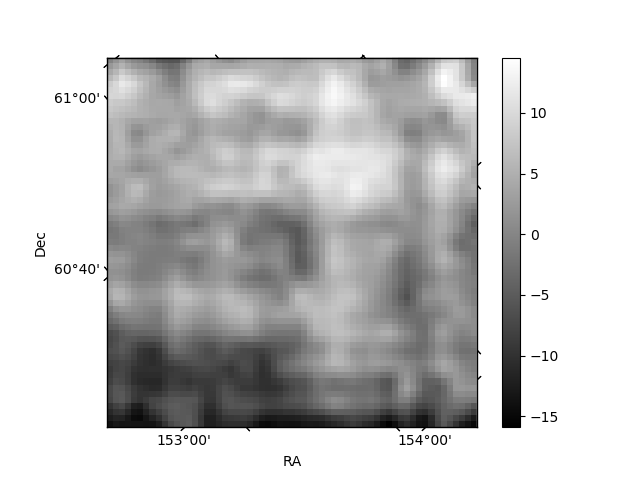
Histogram calculated using DETX and DETY for each event in the final _common_clean file
| Quadrant A | 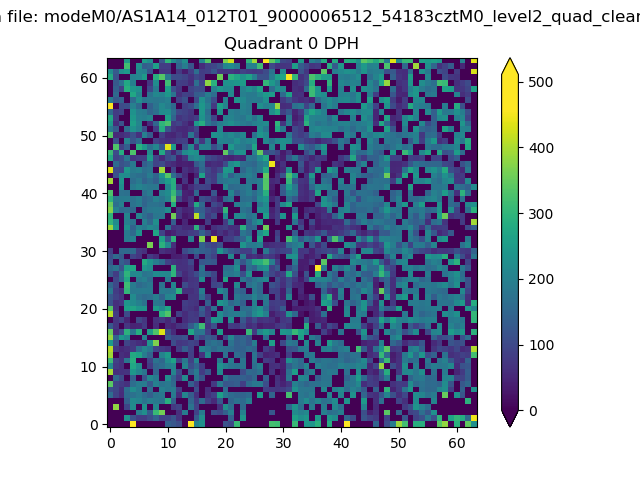 |
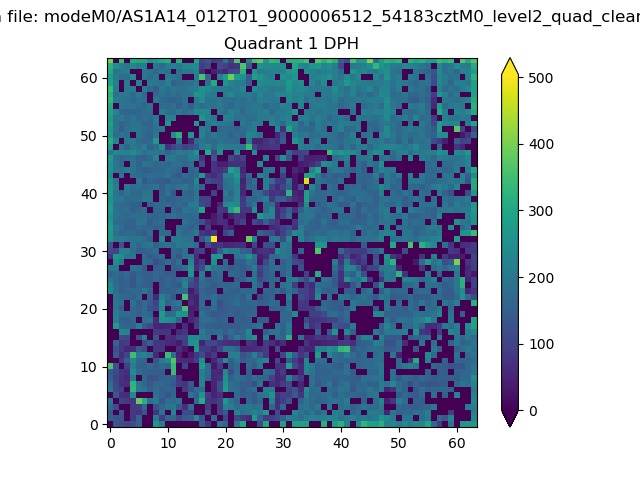 |
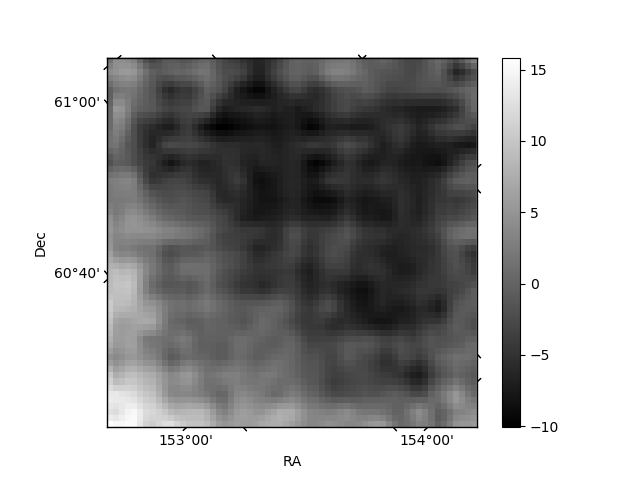
Quadrant B |
|---|---|---|---|
| Quadrant D | 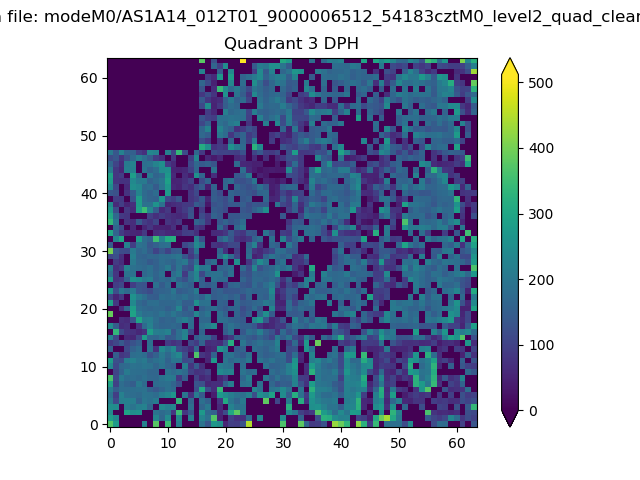 |
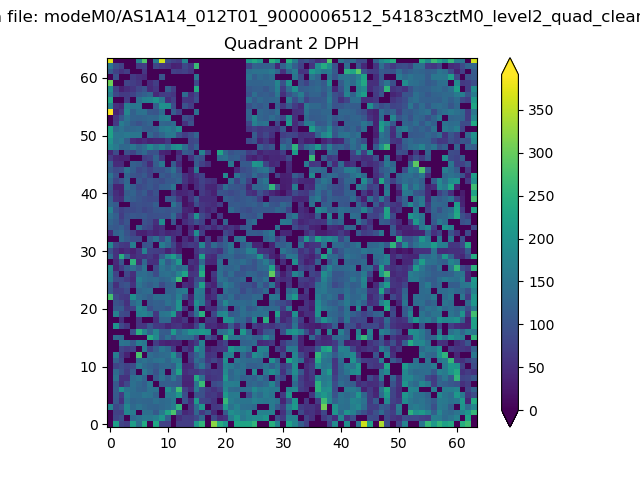 |
Quadrant C |
| Plot type | Count rate plots | Images |
|---|---|---|
| Comparison with Poisson distribution Blue bars denote a histogram of data divided into 1 sec bins. Red curve is a Poisson curve with rate = median count rate of data. |
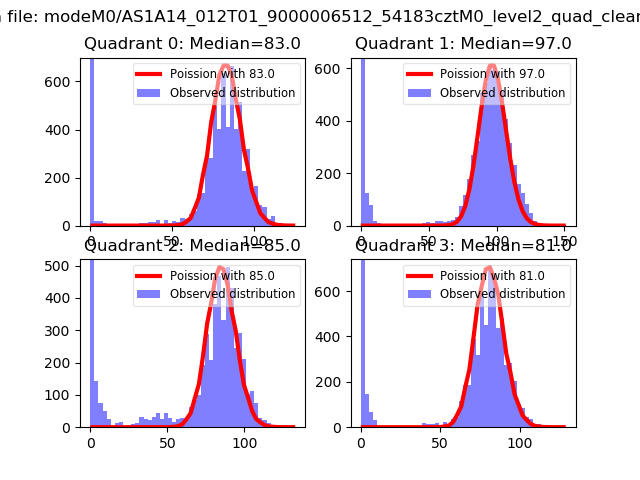 |
 |
| Quadrant-wise count rates Data is divided into 100 sec bins |
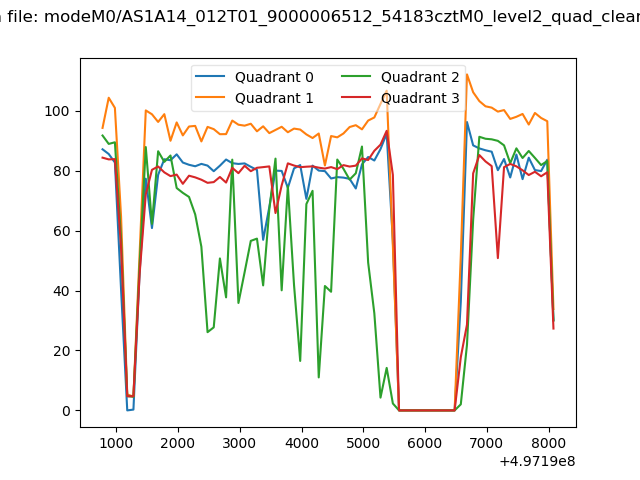 |
|
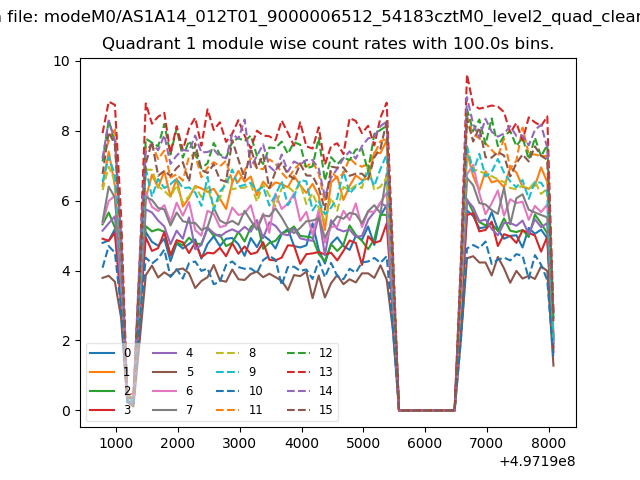
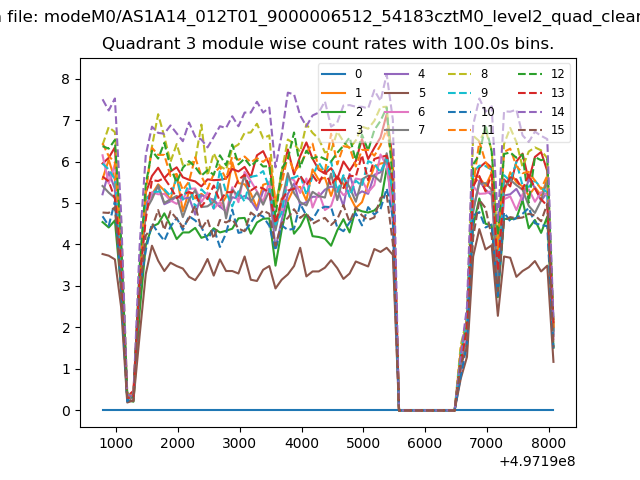
| Module-wise count rates for Quadrant A Data is divided into 100 sec bins |
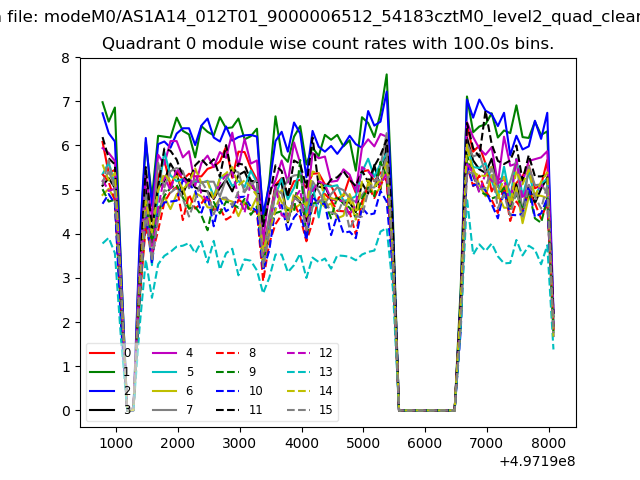 |
 |
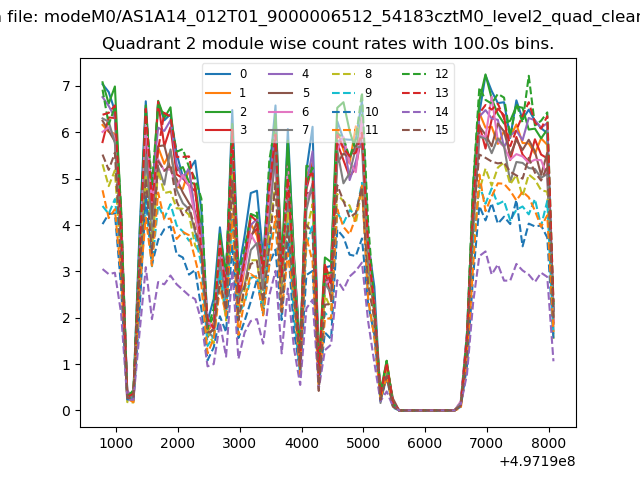
| Module-wise count rates for Quadrant B Data is divided into 100 sec bins |
 |
 |
| Module-wise count rates for Quadrant C Data is divided into 100 sec bins |
 |
 |
| Module-wise count rates for Quadrant D Data is divided into 100 sec bins |
 |
 |
| Parameter | Plot |
|---|---|
| CZT HV Monitor | 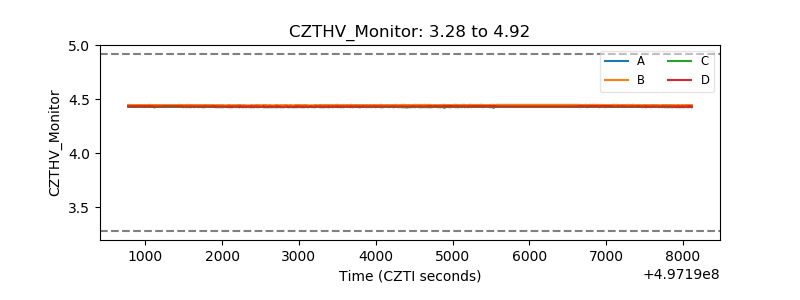 |
| D_VDD | 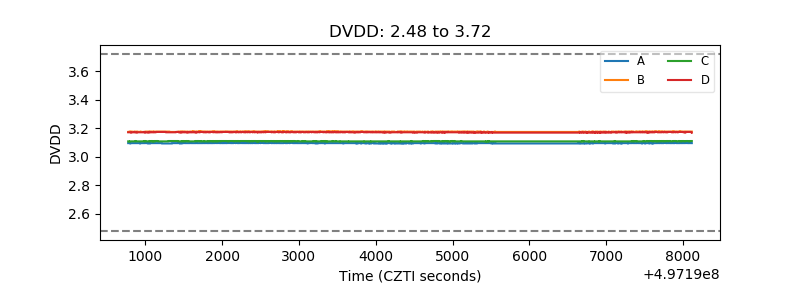 |
| Temperature 1 | 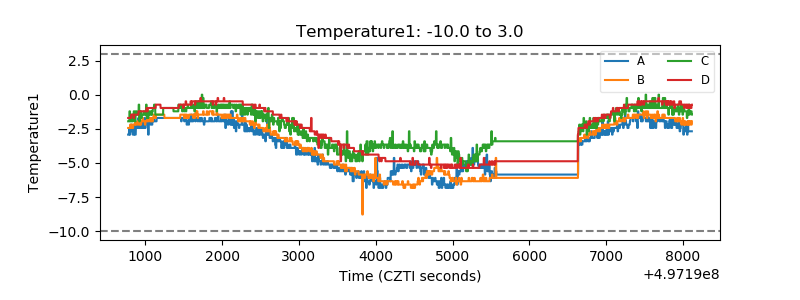 |
| Veto HV Monitor | 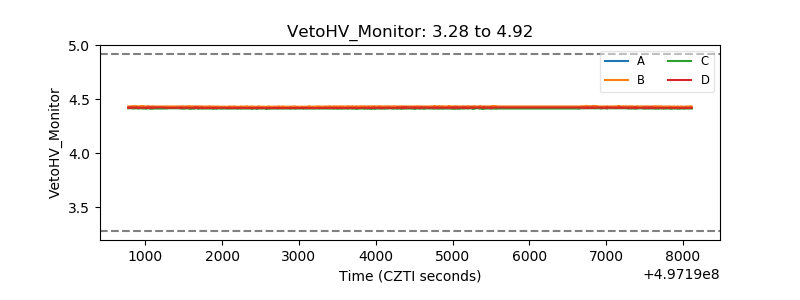 |
| Veto LLD | 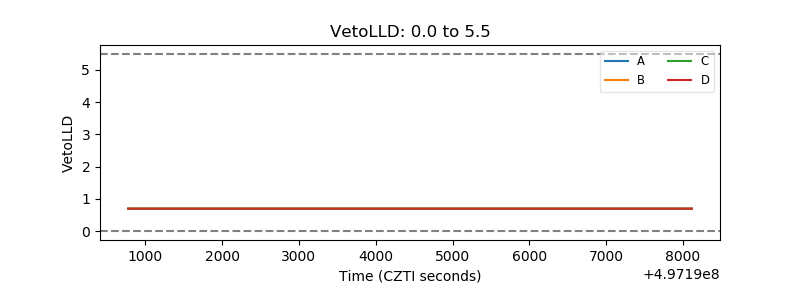 |
| Alpha Counter | 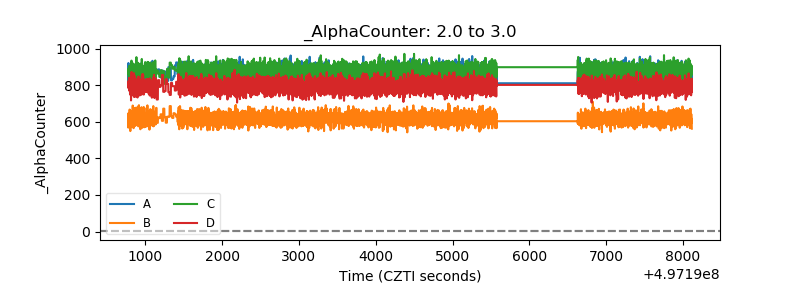 |
| _CPM_Rate | 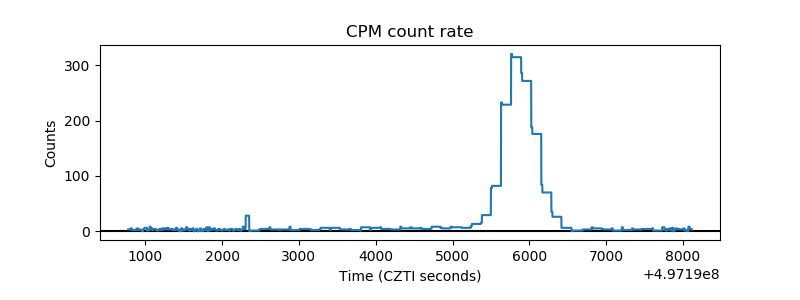 |
| CZT Counter | 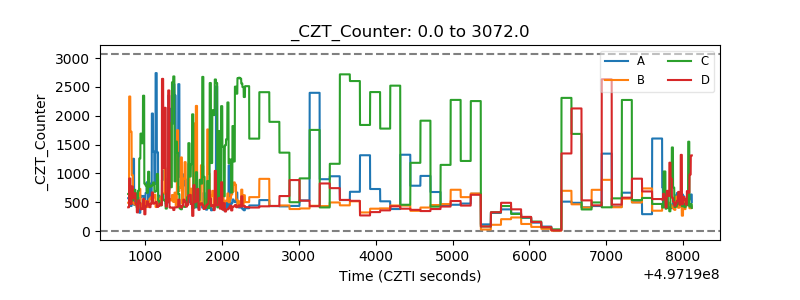 |
| +2.5 Volts monitor | 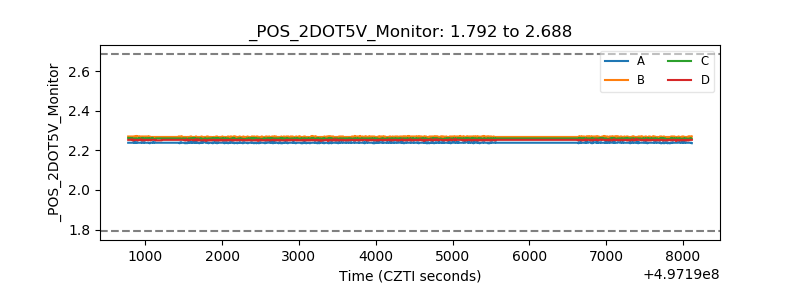 |
| +5 Volts monitor | 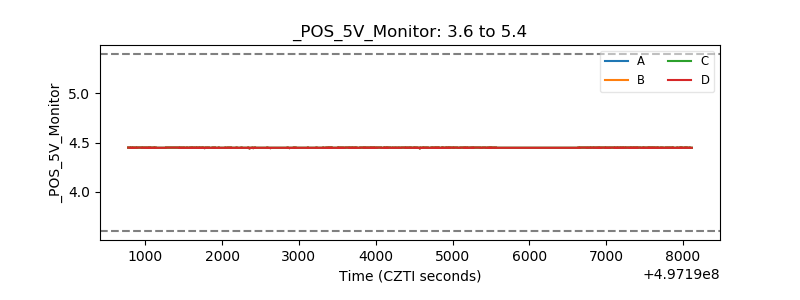 |
| _ROLL_ROT | 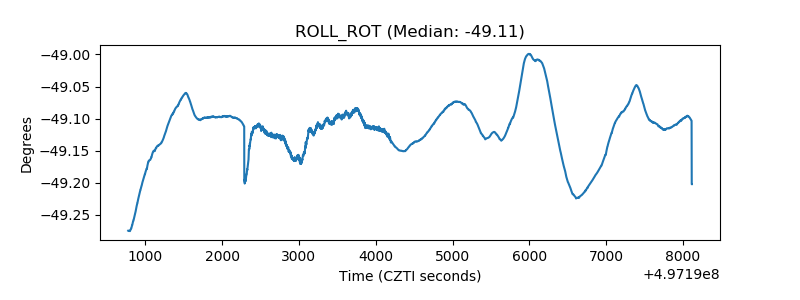 |
| _Roll_DEC | 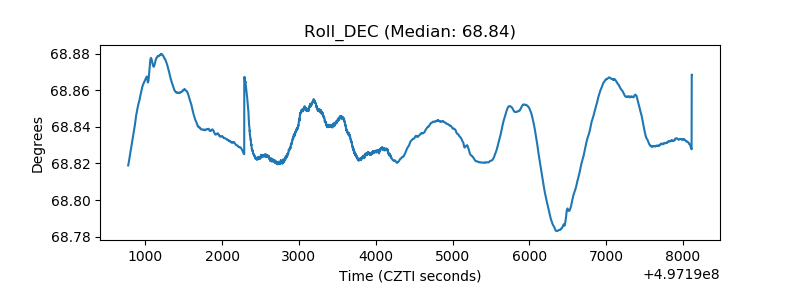 |
| _Roll_RA | 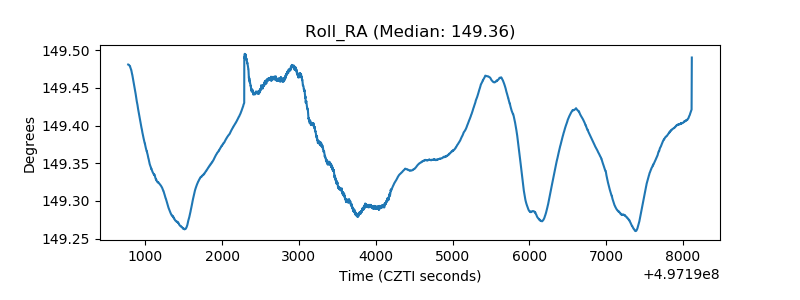 |
| Veto Counter | 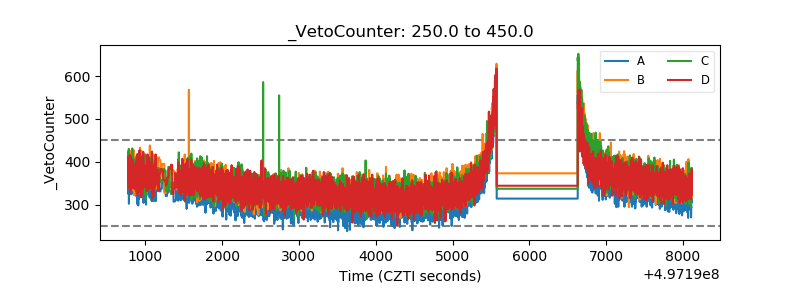 |