| Param | Original file | Final file |
|---|---|---|
| Filename | modeM0/AS1A14_012T01_9000006512_54185cztM0_level2.fits | modeM0/AS1A14_012T01_9000006512_54185cztM0_level2_quad_clean.evt |
| Size (bytes) | 602,628,480 | 96,923,520 |
| Size | 574.7 MB | 92.4 MB |
| Events in quadrant A | 4,782,323 | 642,356 |
| Events in quadrant B | 4,143,020 | 706,229 |
| Events in quadrant C | 4,887,524 | 610,799 |
| Events in quadrant D | 7,949,989 | 486,301 |
| Mode SS | |||
|---|---|---|---|
| Quadrant | BADHDUFLAG | Total packets | Discarded packets |
| A | 0 | 142 | 0 |
| B | 0 | 142 | 0 |
| C | 0 | 142 | 0 |
| D | 0 | 142 | 0 |
| Mode M0 | |||
|---|---|---|---|
| Quadrant | BADHDUFLAG | Total packets | Discarded packets |
| A | 0 | 19239 | 1 |
| B | 0 | 17137 | 1 |
| C | 0 | 19569 | 2 |
| D | 0 | 28602 | 1 |
| Mode M9 | |||
|---|---|---|---|
| Quadrant | BADHDUFLAG | Total packets | Discarded packets |
| A | 0 | 6 | 0 |
| B | 0 | 6 | 0 |
| C | 0 | 6 | 0 |
| D | 0 | 6 | 0 |
| Quadrant | Total seconds | Saturated seconds | Saturation percentage |
|---|---|---|---|
| A | 7020 | 434 | 6.182336% |
| B | 7021 | 168 | 2.392822% |
| C | 7020 | 412 | 5.868946% |
| D | 7020 | 1495 | 21.296296% |
Noise dominated data is calculated using 1-second bins in cleaned event files. If a bin has >2000 counts, and if more than 50% of those come from <1% of pixels, then it is considered to be noise-dominated and hence unusable.
| Quadrant | # 1 sec bins | Bins with >0 counts | Bins with >2000 counts | High rate bins dominated by noise | Noise dominated (total time) | Noise dominated (detector-on time) | Marked lightcurve |
|---|---|---|---|---|---|---|---|
| A | 7565 | 7022 | 299 | 299 | 3.95% | 4.26% | 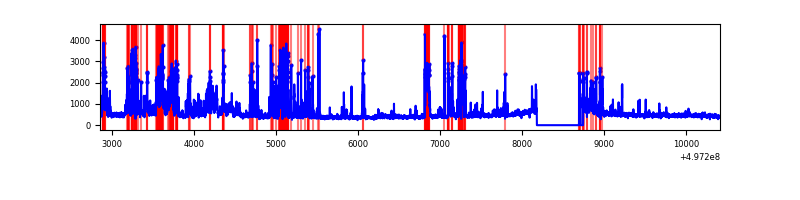 |
| B | 7566 | 7023 | 45 | 45 | 0.59% | 0.64% | 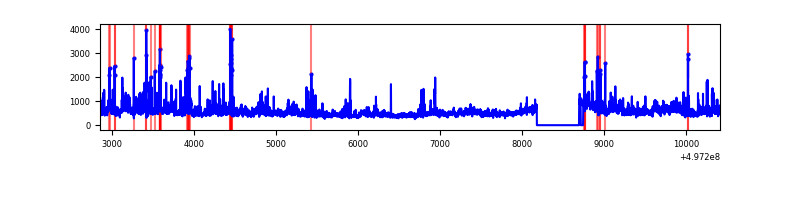 |
| C | 7565 | 7022 | 294 | 294 | 3.89% | 4.19% | 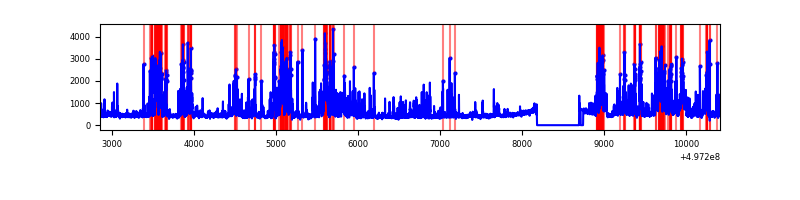 |
| D | 7565 | 7021 | 1255 | 1255 | 16.59% | 17.87% | 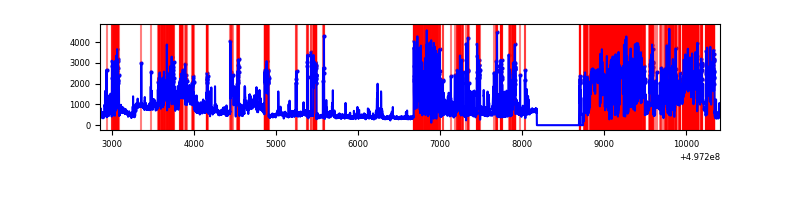 |
Top three noisy pixels from each quadrant. If the there are fewer than three noisy pixels in the level2.evt file, extra rows are filled as -1
| Pixel properties | Quadrant properties | ||||||
|---|---|---|---|---|---|---|---|
| Quadrant | DetID | PixID | Counts | Sigma | Mean | Median | Sigma |
| A | 12 | 115 | 567610 | 3134.19 | 721 | 704 | 180.9 |
| A | 7 | 29 | 556543 | 3073.0 | 721 | 704 | 180.9 |
| A | 15 | 174 | 501381 | 2768.03 | 721 | 704 | 180.9 |
| B | 15 | 20 | 390478 | 2515.47 | 728 | 701 | 155.0 |
| B | 14 | 167 | 303719 | 1955.56 | 728 | 701 | 155.0 |
| B | 0 | 213 | 180652 | 1161.33 | 728 | 701 | 155.0 |
| C | 15 | 177 | 761662 | 3928.41 | 708 | 701 | 193.7 |
| C | 15 | 215 | 707121 | 3646.85 | 708 | 701 | 193.7 |
| C | 13 | 3 | 268206 | 1380.98 | 708 | 701 | 193.7 |
| D | 8 | 176 | 3707246 | 20746.45 | 635 | 607 | 178.7 |
| D | 2 | 172 | 1122323 | 6278.36 | 635 | 607 | 178.7 |
| D | 2 | 165 | 192083 | 1071.71 | 635 | 607 | 178.7 |
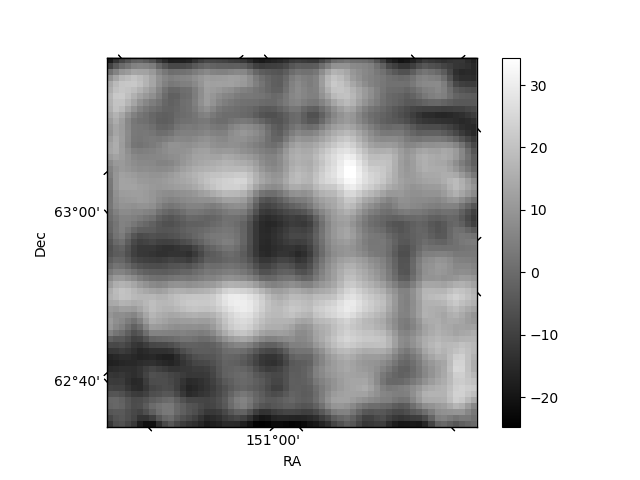
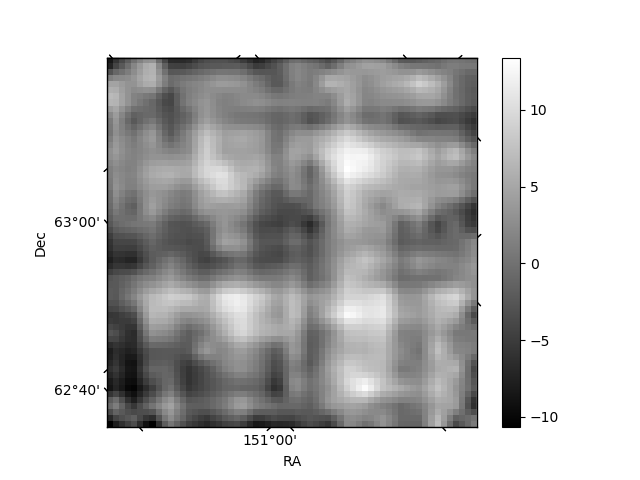
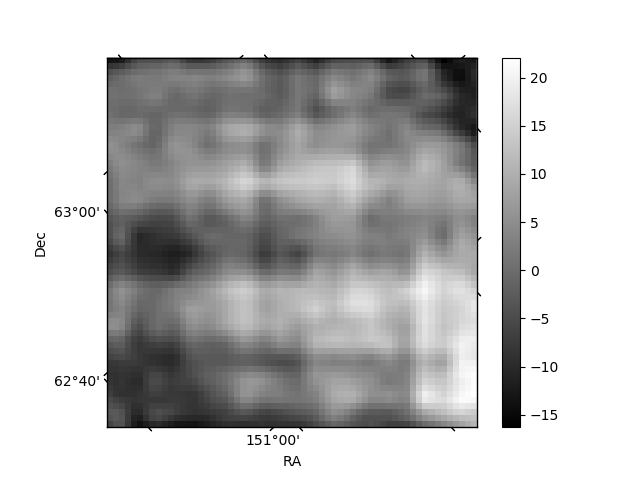
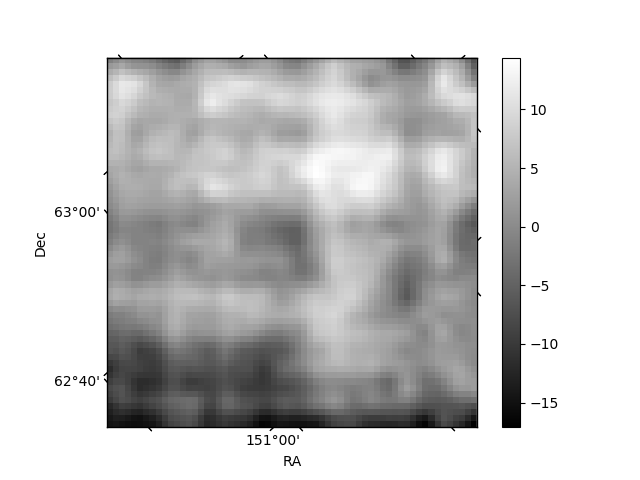
Histogram calculated using DETX and DETY for each event in the final _common_clean file
| Quadrant A | 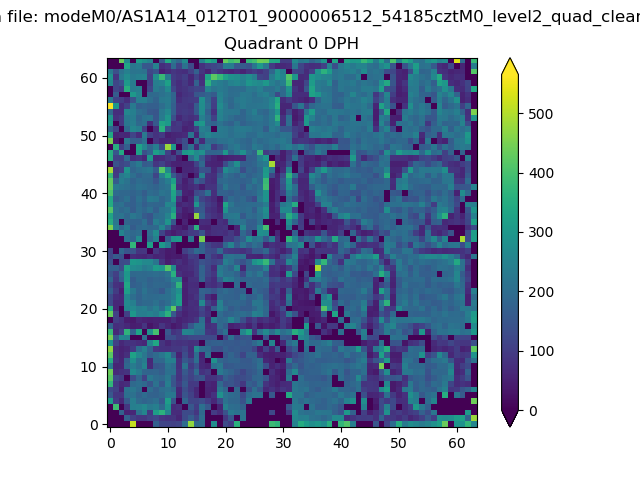 |
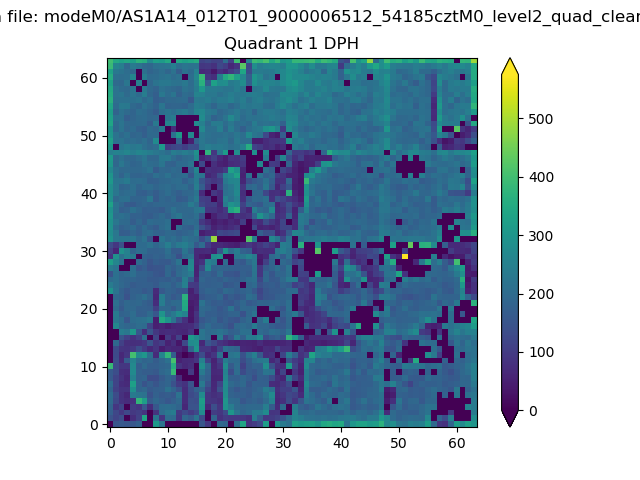 |
Quadrant B |
|---|---|---|---|
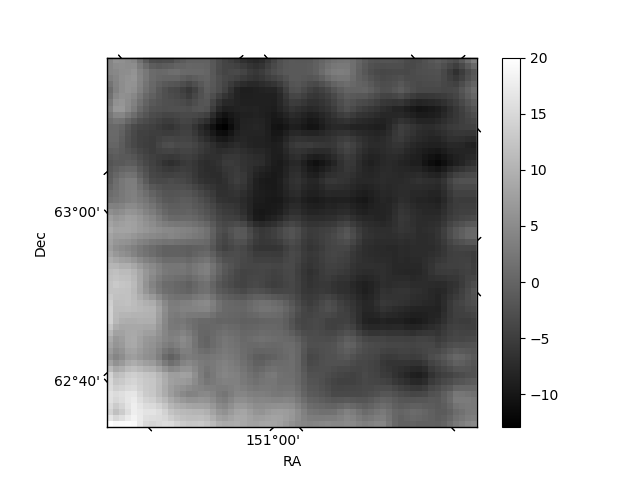
| Quadrant D | 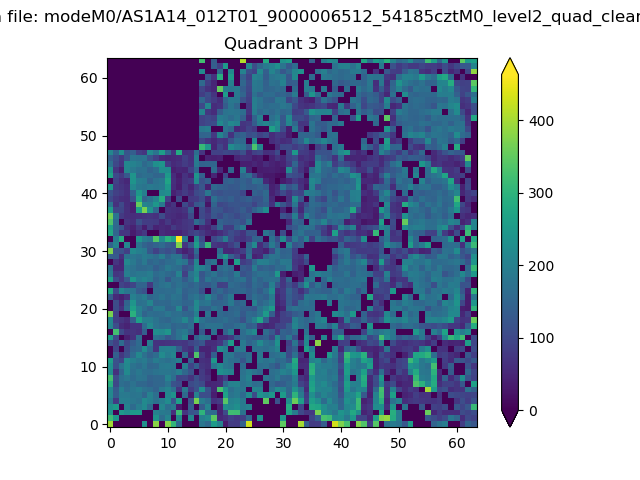 |
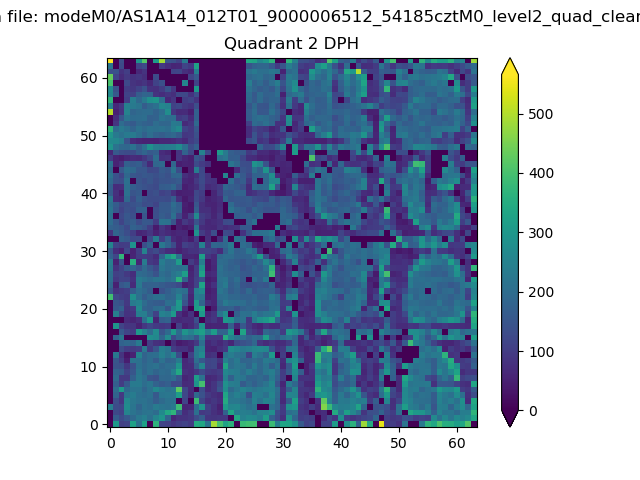 |
Quadrant C |
| Plot type | Count rate plots | Images |
|---|---|---|
| Comparison with Poisson distribution Blue bars denote a histogram of data divided into 1 sec bins. Red curve is a Poisson curve with rate = median count rate of data. |
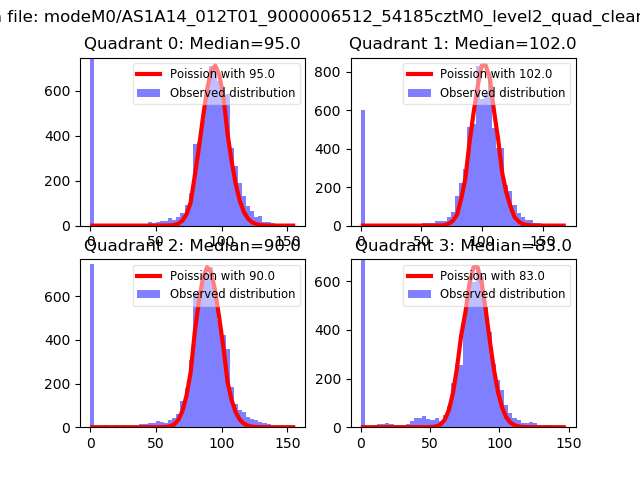 |
 |
| Quadrant-wise count rates Data is divided into 100 sec bins |
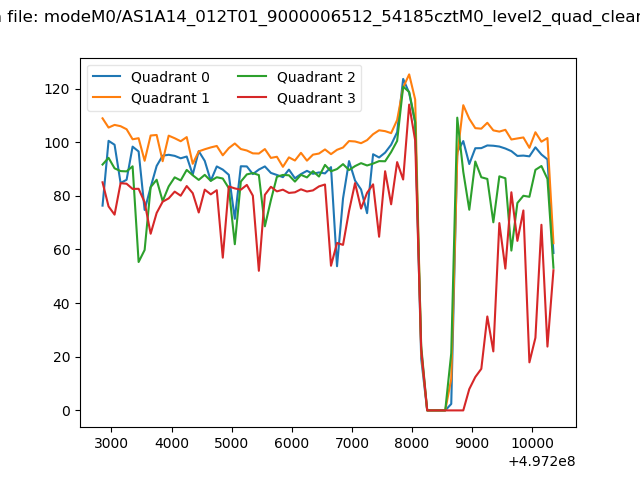 |
|
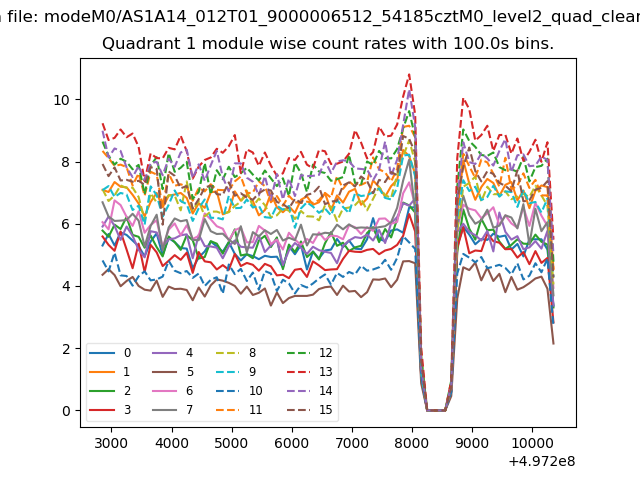
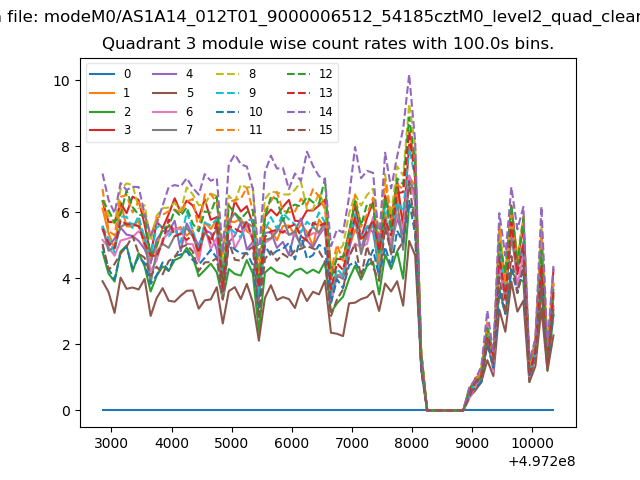
| Module-wise count rates for Quadrant A Data is divided into 100 sec bins |
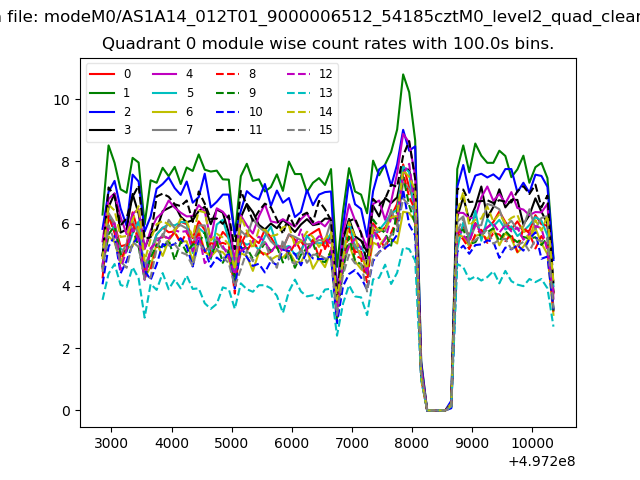 |
 |
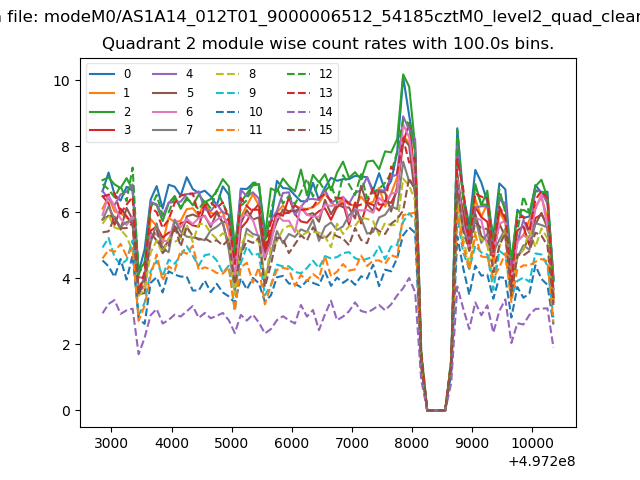
| Module-wise count rates for Quadrant B Data is divided into 100 sec bins |
 |
 |
| Module-wise count rates for Quadrant C Data is divided into 100 sec bins |
 |
 |
| Module-wise count rates for Quadrant D Data is divided into 100 sec bins |
 |
 |
| Parameter | Plot |
|---|---|
| CZT HV Monitor | 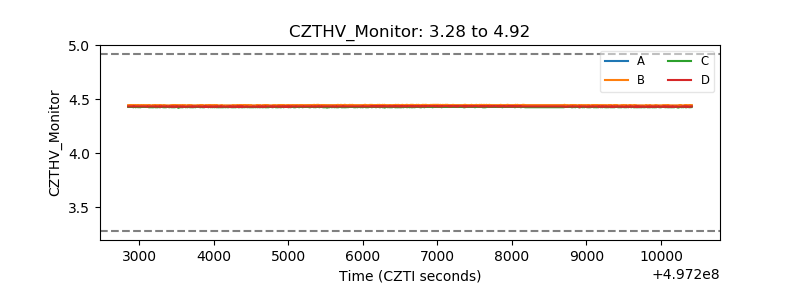 |
| D_VDD | 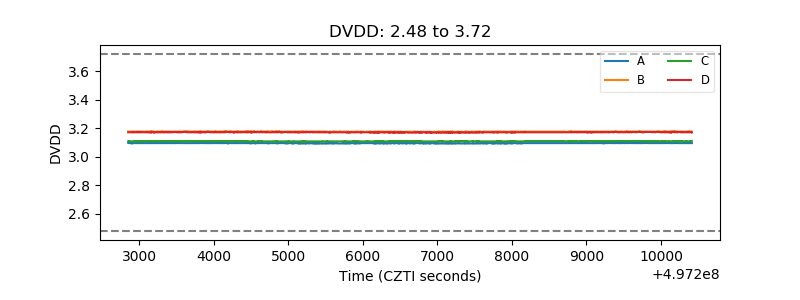 |
| Temperature 1 | 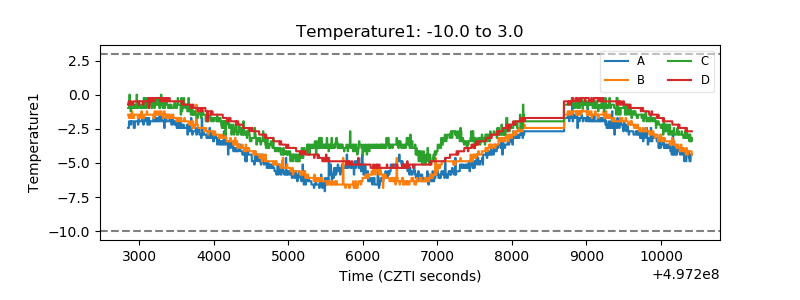 |
| Veto HV Monitor | 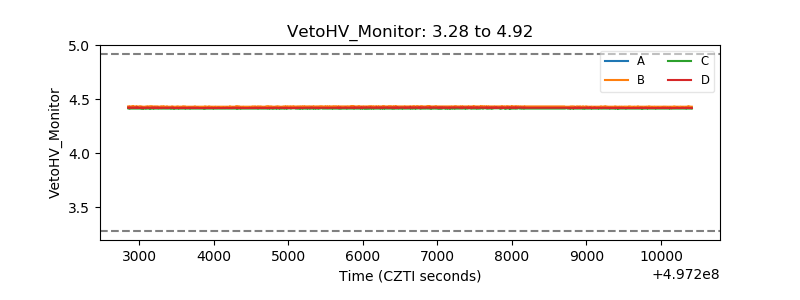 |
| Veto LLD | 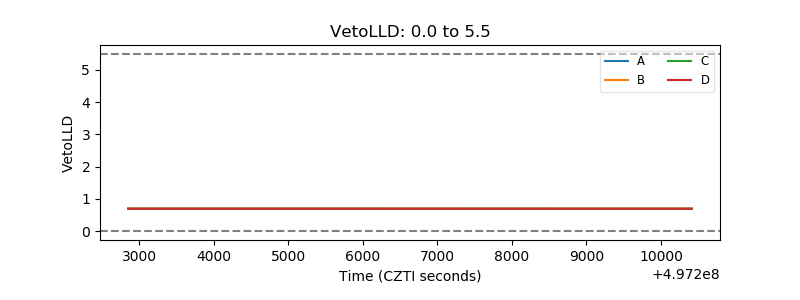 |
| Alpha Counter | 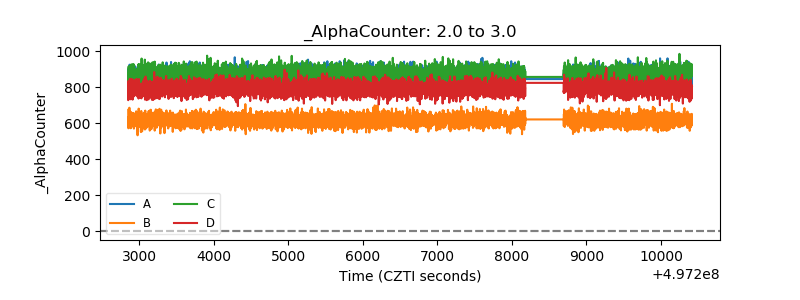 |
| _CPM_Rate | 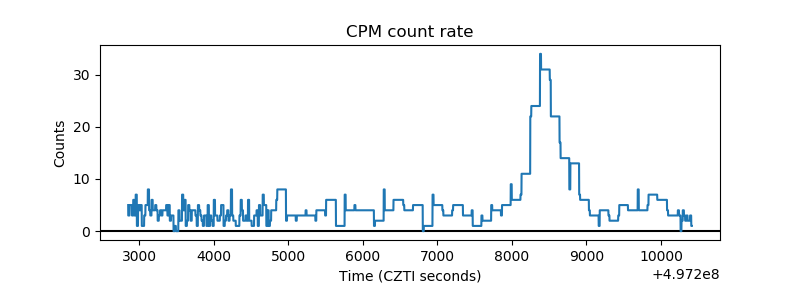 |
| CZT Counter | 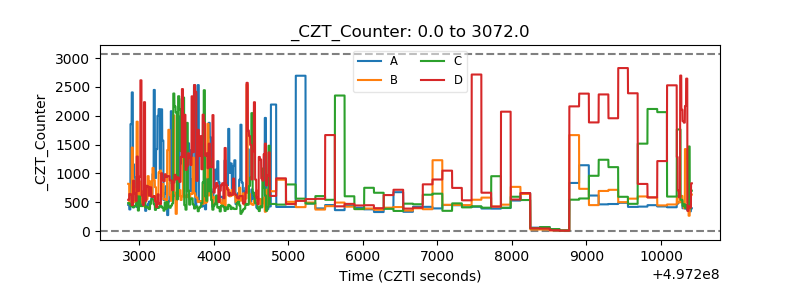 |
| +2.5 Volts monitor |  |
| +5 Volts monitor |  |
| _ROLL_ROT | 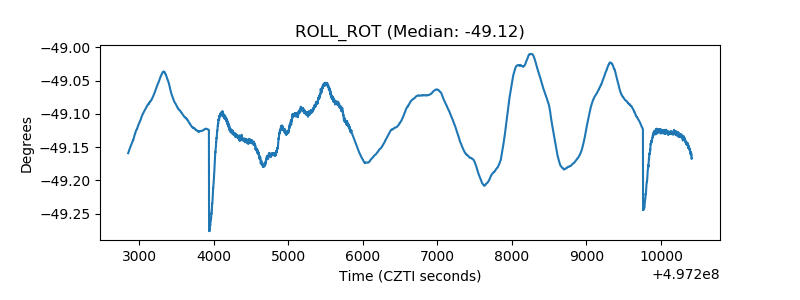 |
| _Roll_DEC | 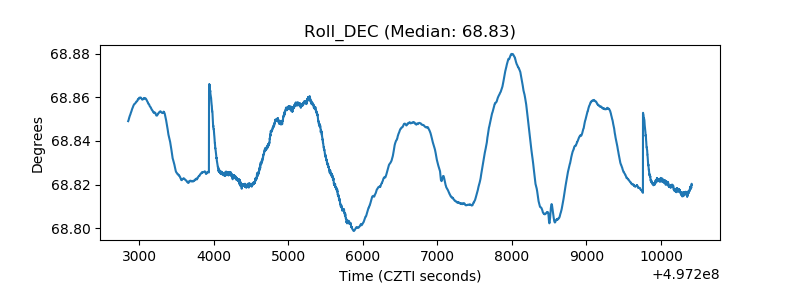 |
| _Roll_RA | 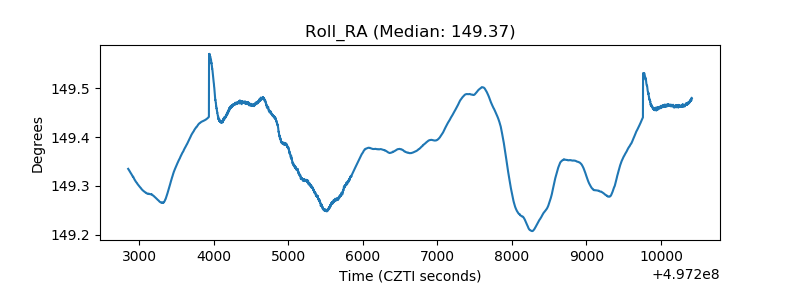 |
| Veto Counter | 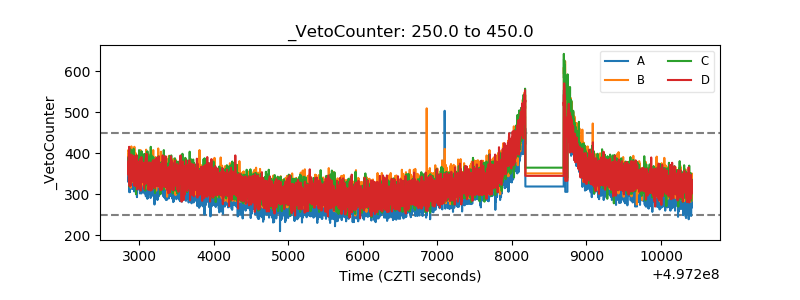 |