| Param | Original file | Final file |
|---|---|---|
| Filename | modeM0/AS1A14_012T01_9000006512_54186cztM0_level2.fits | modeM0/AS1A14_012T01_9000006512_54186cztM0_level2_quad_clean.evt |
| Size (bytes) | 657,411,840 | 104,725,440 |
| Size | 627.0 MB | 99.9 MB |
| Events in quadrant A | 3,829,606 | 733,801 |
| Events in quadrant B | 4,461,170 | 791,496 |
| Events in quadrant C | 7,767,897 | 563,086 |
| Events in quadrant D | 7,672,848 | 541,671 |
| Mode SS | |||
|---|---|---|---|
| Quadrant | BADHDUFLAG | Total packets | Discarded packets |
| A | 0 | 156 | 0 |
| B | 0 | 156 | 0 |
| C | 0 | 156 | 0 |
| D | 0 | 156 | 0 |
| Mode M0 | |||
|---|---|---|---|
| Quadrant | BADHDUFLAG | Total packets | Discarded packets |
| A | 0 | 17079 | 1 |
| B | 0 | 18681 | 1 |
| C | 0 | 28665 | 4 |
| D | 0 | 28367 | 1 |
| Quadrant | Total seconds | Saturated seconds | Saturation percentage |
|---|---|---|---|
| A | 7773 | 134 | 1.723916% |
| B | 7774 | 142 | 1.826601% |
| C | 7773 | 1706 | 21.947768% |
| D | 7773 | 1447 | 18.615721% |
Noise dominated data is calculated using 1-second bins in cleaned event files. If a bin has >2000 counts, and if more than 50% of those come from <1% of pixels, then it is considered to be noise-dominated and hence unusable.
| Quadrant | # 1 sec bins | Bins with >0 counts | Bins with >2000 counts | High rate bins dominated by noise | Noise dominated (total time) | Noise dominated (detector-on time) | Marked lightcurve |
|---|---|---|---|---|---|---|---|
| A | 7773 | 7773 | 50 | 50 | 0.64% | 0.64% | 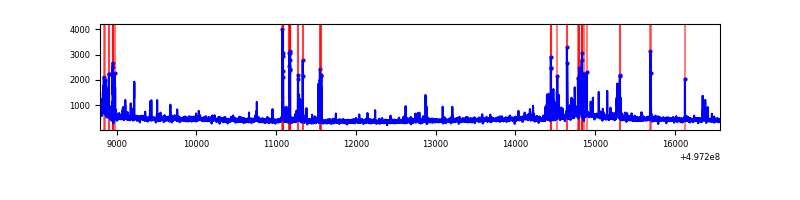 |
| B | 7774 | 7774 | 50 | 50 | 0.64% | 0.64% | 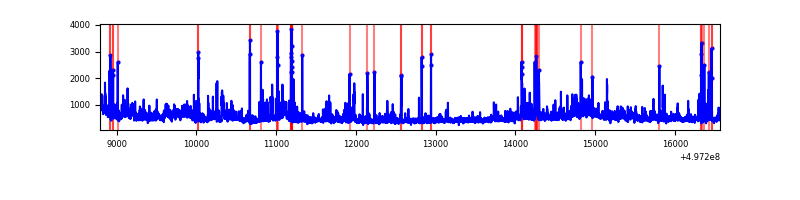 |
| C | 7773 | 7773 | 1411 | 1411 | 18.15% | 18.15% | 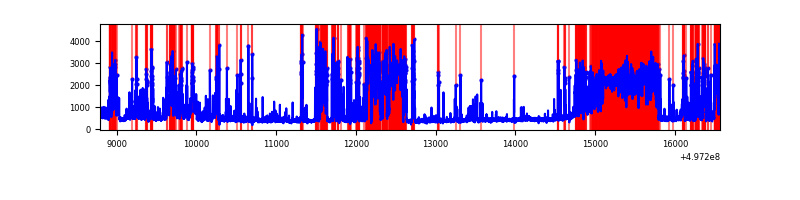 |
| D | 7773 | 7773 | 1297 | 1297 | 16.69% | 16.69% | 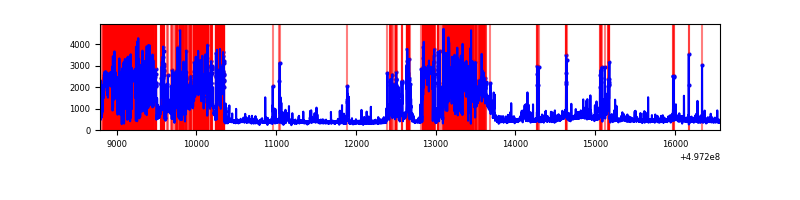 |
Top three noisy pixels from each quadrant. If the there are fewer than three noisy pixels in the level2.evt file, extra rows are filled as -1
| Pixel properties | Quadrant properties | ||||||
|---|---|---|---|---|---|---|---|
| Quadrant | DetID | PixID | Counts | Sigma | Mean | Median | Sigma |
| A | 15 | 174 | 300338 | 1462.26 | 825 | 802 | 204.8 |
| A | 3 | 14 | 87371 | 422.61 | 825 | 802 | 204.8 |
| A | 4 | 3 | 47560 | 228.26 | 825 | 802 | 204.8 |
| B | 15 | 20 | 375480 | 2152.44 | 820 | 791 | 174.1 |
| B | 5 | 236 | 203534 | 1164.68 | 820 | 791 | 174.1 |
| B | 5 | 185 | 151304 | 864.64 | 820 | 791 | 174.1 |
| C | 15 | 215 | 1578808 | 7899.26 | 721 | 712 | 199.8 |
| C | 1 | 241 | 1354890 | 6778.42 | 721 | 712 | 199.8 |
| C | 15 | 177 | 923183 | 4617.49 | 721 | 712 | 199.8 |
| D | 8 | 176 | 3794255 | 18691.37 | 721 | 687 | 203.0 |
| D | 3 | 12 | 764839 | 3765.07 | 721 | 687 | 203.0 |
| D | 3 | 144 | 71999 | 351.36 | 721 | 687 | 203.0 |
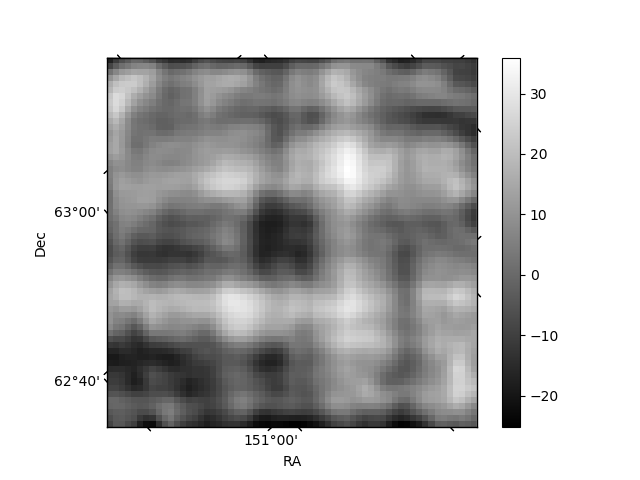
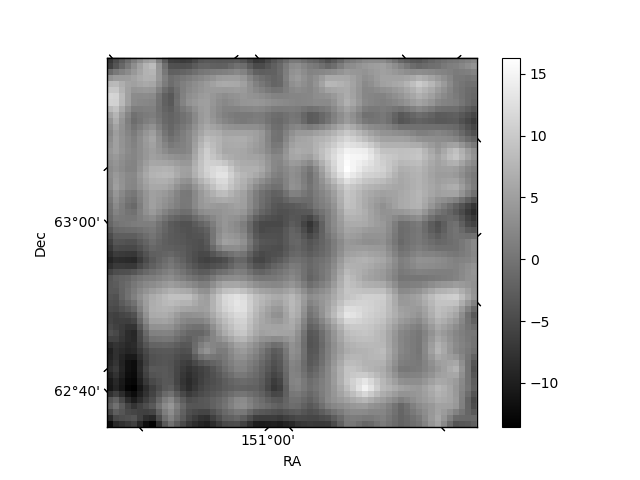
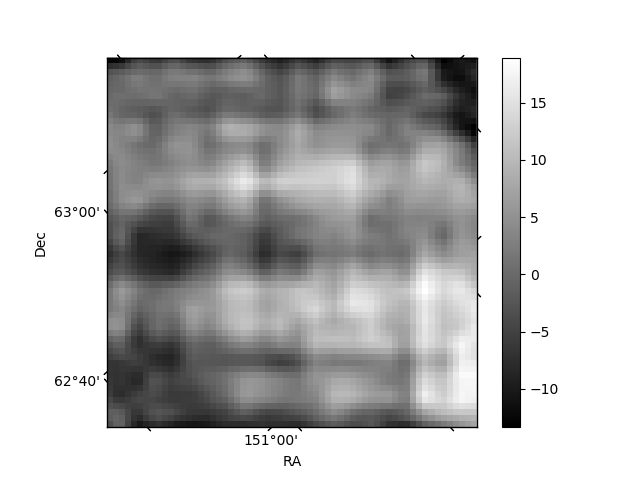
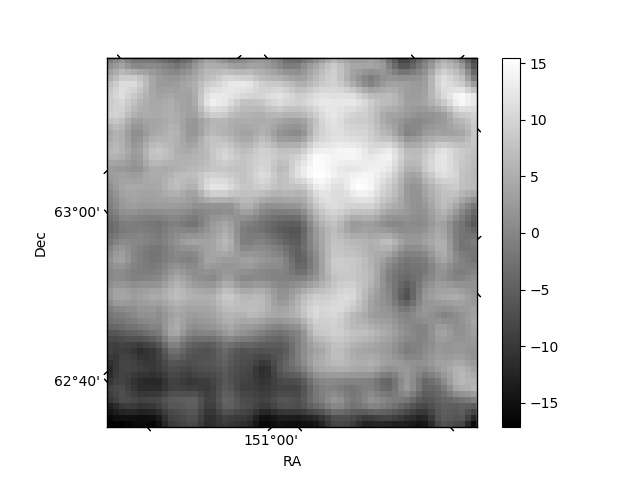
Histogram calculated using DETX and DETY for each event in the final _common_clean file
| Quadrant A | 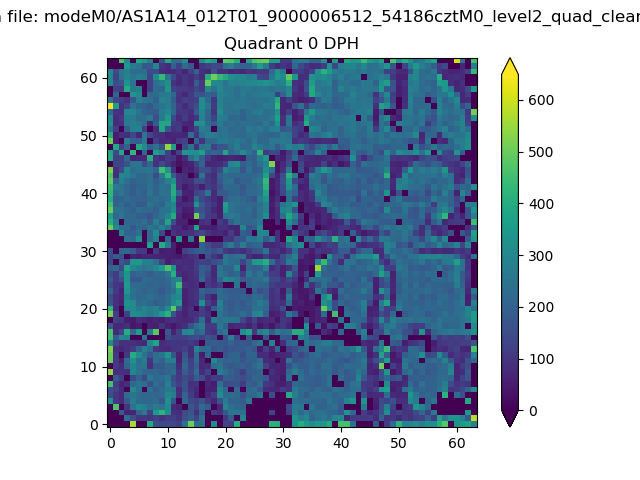 |
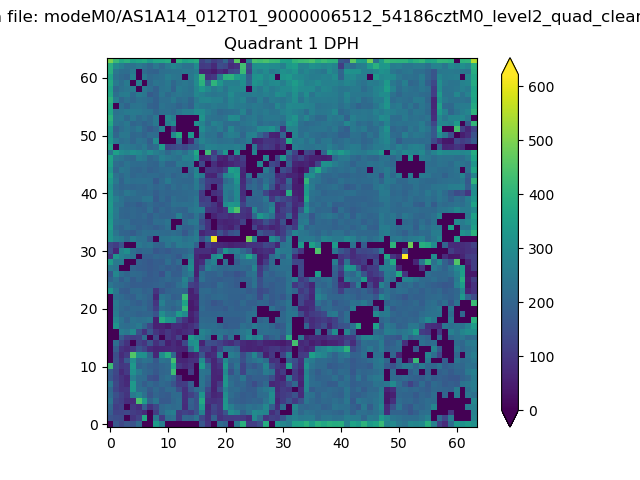 |
Quadrant B |
|---|---|---|---|
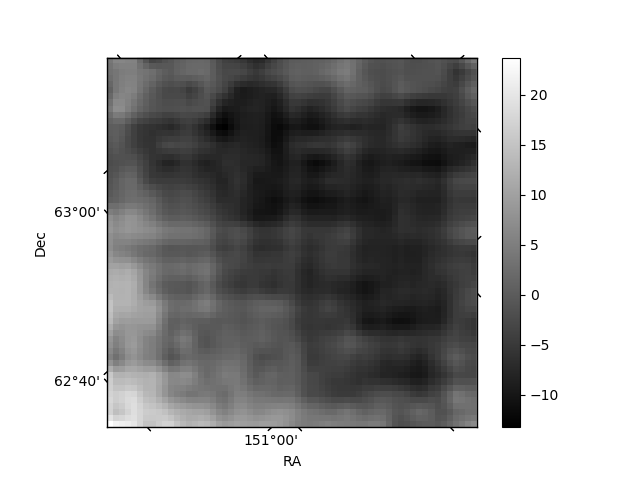
| Quadrant D | 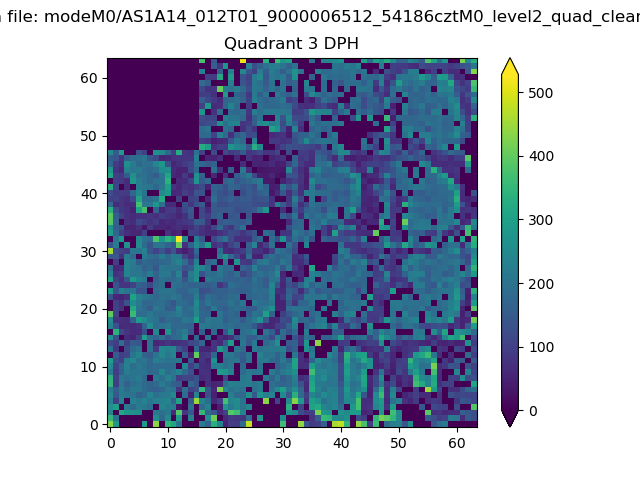 |
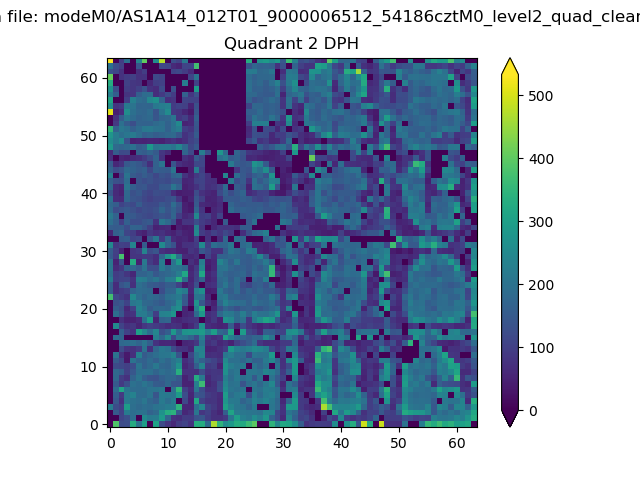 |
Quadrant C |
| Plot type | Count rate plots | Images |
|---|---|---|
| Comparison with Poisson distribution Blue bars denote a histogram of data divided into 1 sec bins. Red curve is a Poisson curve with rate = median count rate of data. |
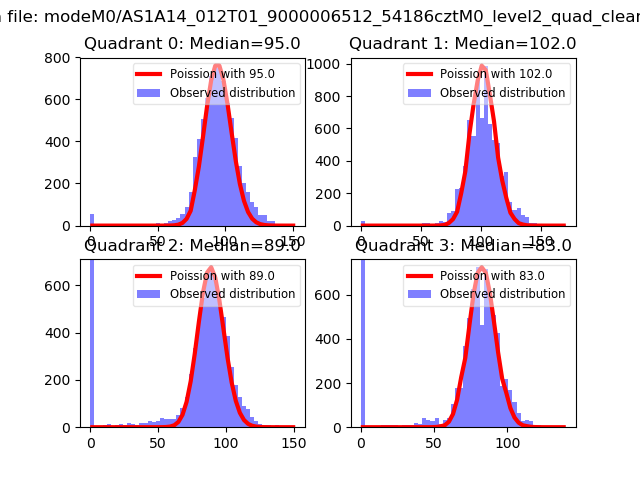 |
 |
| Quadrant-wise count rates Data is divided into 100 sec bins |
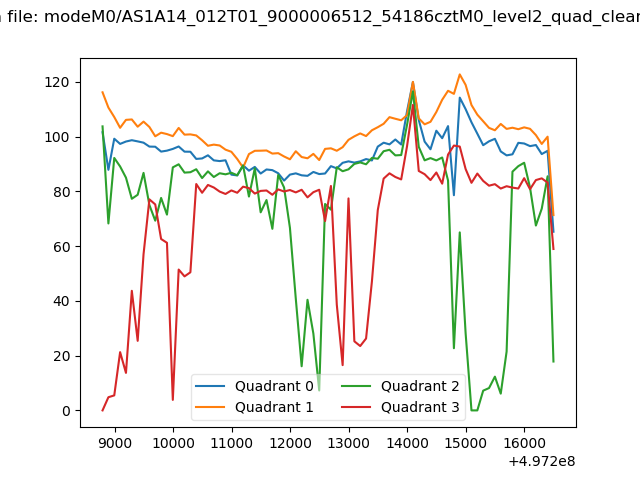 |
|
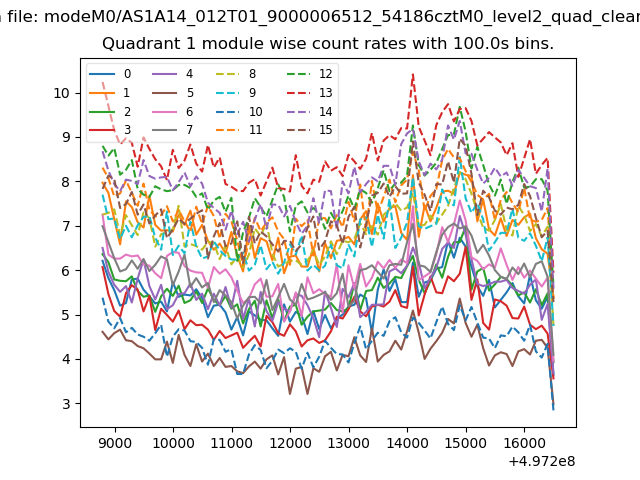
| Module-wise count rates for Quadrant A Data is divided into 100 sec bins |
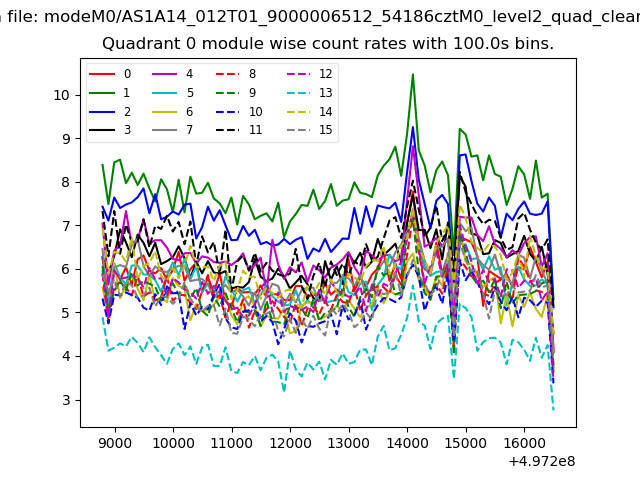 |
 |
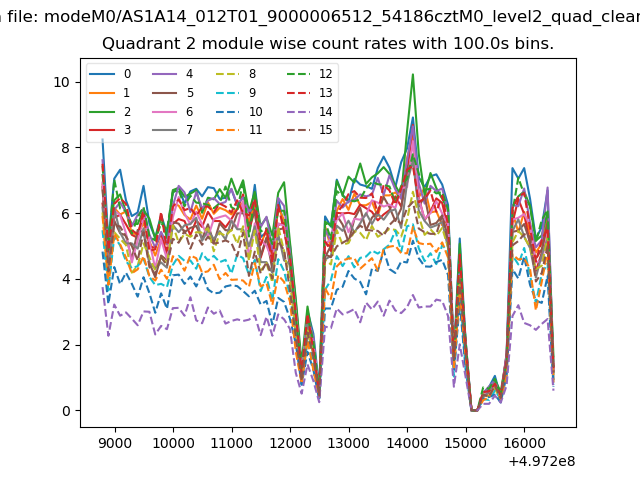
| Module-wise count rates for Quadrant B Data is divided into 100 sec bins |
 |
 |
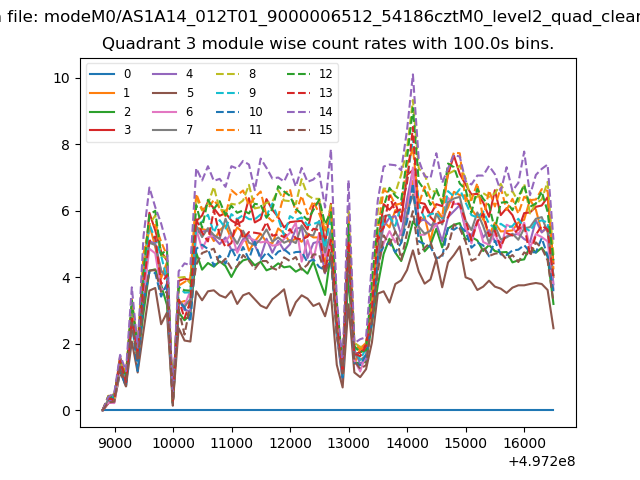
| Module-wise count rates for Quadrant C Data is divided into 100 sec bins |
 |
 |
| Module-wise count rates for Quadrant D Data is divided into 100 sec bins |
 |
 |
| Parameter | Plot |
|---|---|
| CZT HV Monitor | 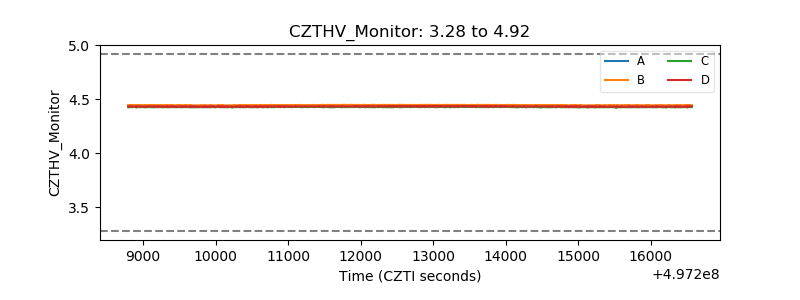 |
| D_VDD | 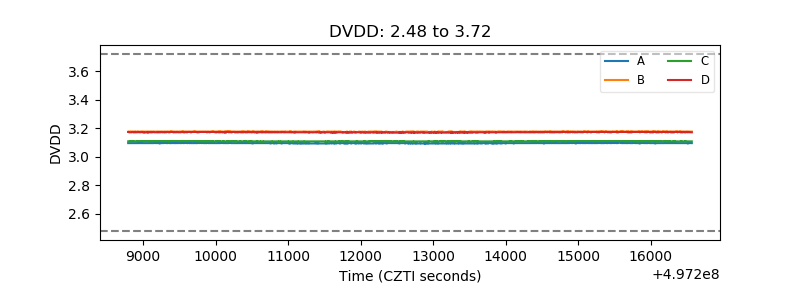 |
| Temperature 1 | 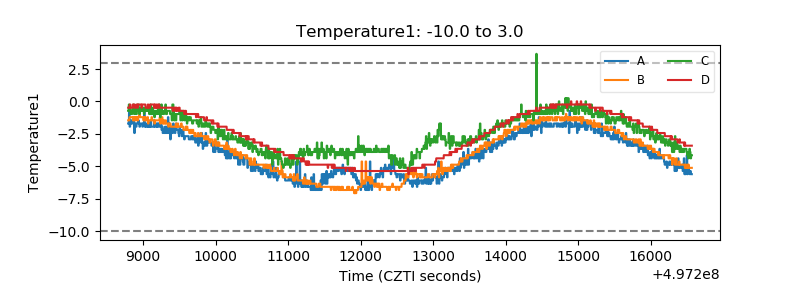 |
| Veto HV Monitor |  |
| Veto LLD | 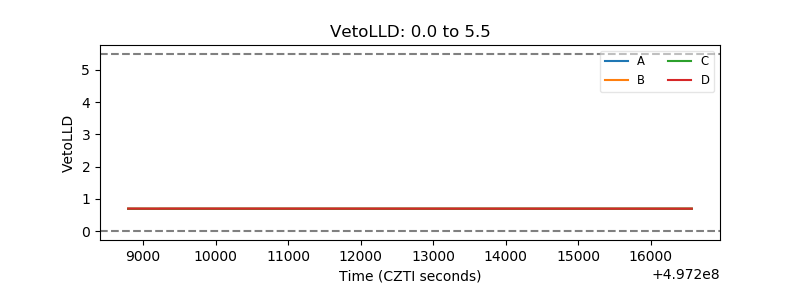 |
| Alpha Counter | 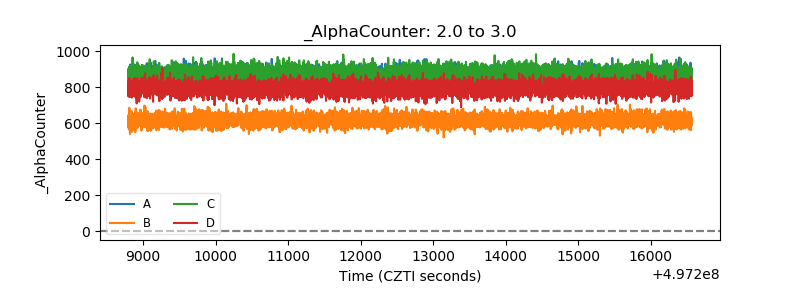 |
| _CPM_Rate | 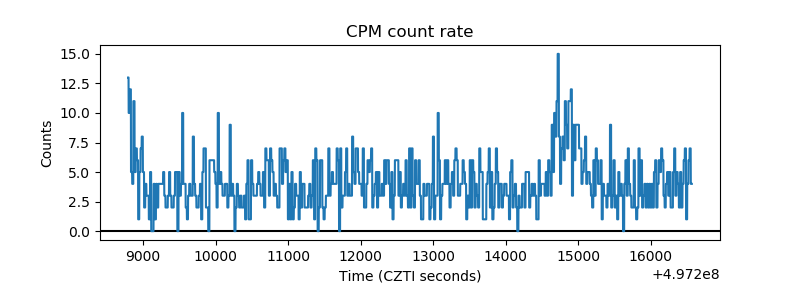 |
| CZT Counter | 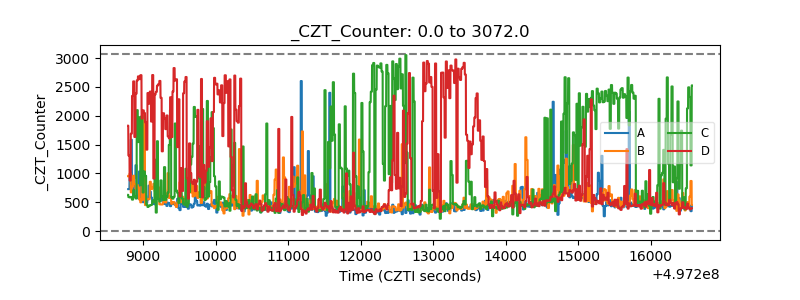 |
| +2.5 Volts monitor |  |
| +5 Volts monitor |  |
| _ROLL_ROT | 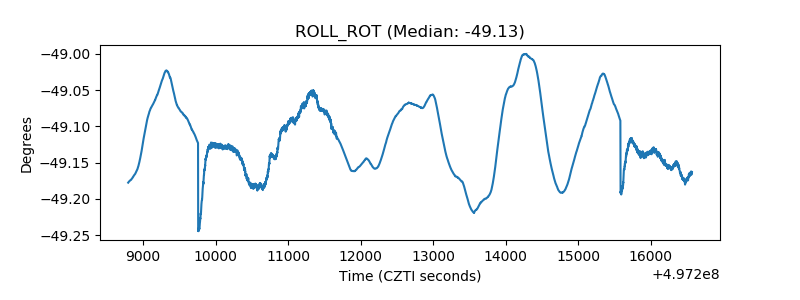 |
| _Roll_DEC | 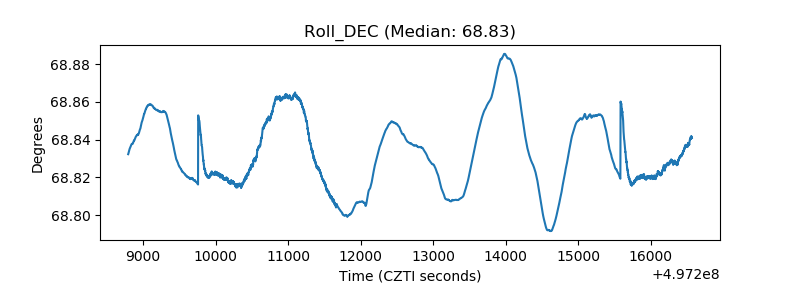 |
| _Roll_RA | 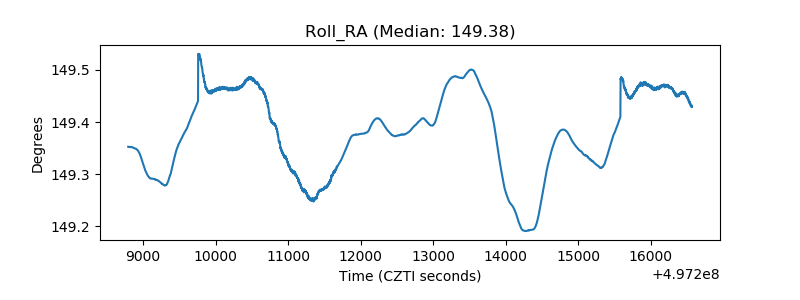 |
| Veto Counter | 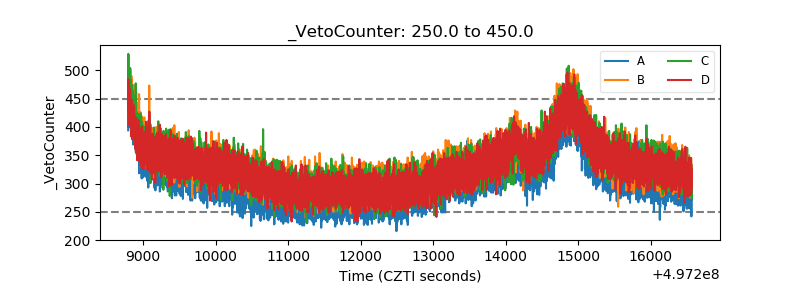 |