| Param | Original file | Final file |
|---|---|---|
| Filename | modeM0/AS1A14_012T01_9000006512_54187cztM0_level2.fits | modeM0/AS1A14_012T01_9000006512_54187cztM0_level2_quad_clean.evt |
| Size (bytes) | 541,244,160 | 105,986,880 |
| Size | 516.2 MB | 101.1 MB |
| Events in quadrant A | 4,869,813 | 701,898 |
| Events in quadrant B | 4,210,101 | 757,645 |
| Events in quadrant C | 6,195,263 | 586,435 |
| Events in quadrant D | 4,170,518 | 635,202 |
| Mode SS | |||
|---|---|---|---|
| Quadrant | BADHDUFLAG | Total packets | Discarded packets |
| A | 0 | 152 | 0 |
| B | 0 | 152 | 0 |
| C | 0 | 152 | 0 |
| D | 0 | 152 | 0 |
| Mode M0 | |||
|---|---|---|---|
| Quadrant | BADHDUFLAG | Total packets | Discarded packets |
| A | 0 | 20089 | 0 |
| B | 0 | 18034 | 0 |
| C | 0 | 24030 | 1 |
| D | 0 | 17872 | 0 |
| Quadrant | Total seconds | Saturated seconds | Saturation percentage |
|---|---|---|---|
| A | 7586 | 237 | 3.124176% |
| B | 7586 | 165 | 2.175059% |
| C | 7586 | 1149 | 15.146322% |
| D | 7586 | 142 | 1.871869% |
Noise dominated data is calculated using 1-second bins in cleaned event files. If a bin has >2000 counts, and if more than 50% of those come from <1% of pixels, then it is considered to be noise-dominated and hence unusable.
| Quadrant | # 1 sec bins | Bins with >0 counts | Bins with >2000 counts | High rate bins dominated by noise | Noise dominated (total time) | Noise dominated (detector-on time) | Marked lightcurve |
|---|---|---|---|---|---|---|---|
| A | 7586 | 7586 | 170 | 170 | 2.24% | 2.24% | 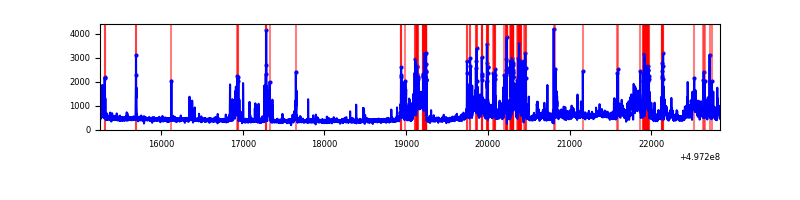 |
| B | 7586 | 7586 | 104 | 104 | 1.37% | 1.37% | 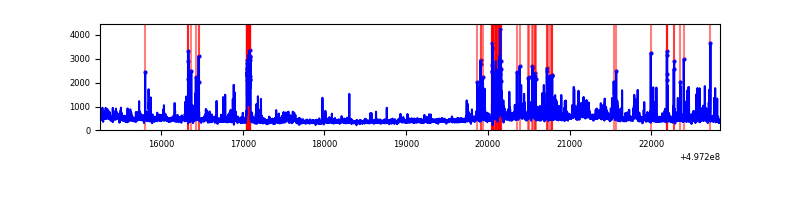 |
| C | 7586 | 7586 | 955 | 955 | 12.59% | 12.59% | 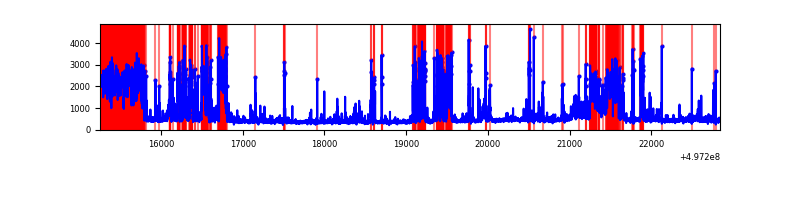 |
| D | 7586 | 7586 | 119 | 119 | 1.57% | 1.57% | 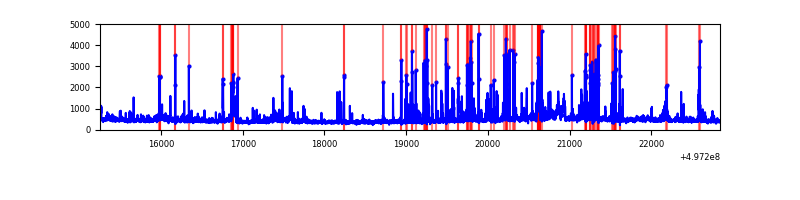 |
Top three noisy pixels from each quadrant. If the there are fewer than three noisy pixels in the level2.evt file, extra rows are filled as -1
| Pixel properties | Quadrant properties | ||||||
|---|---|---|---|---|---|---|---|
| Quadrant | DetID | PixID | Counts | Sigma | Mean | Median | Sigma |
| A | 15 | 174 | 774481 | 3918.97 | 789 | 770 | 197.4 |
| A | 4 | 5 | 420563 | 2126.32 | 789 | 770 | 197.4 |
| A | 3 | 130 | 163303 | 823.26 | 789 | 770 | 197.4 |
| B | 4 | 171 | 462791 | 2745.27 | 783 | 756 | 168.3 |
| B | 15 | 20 | 182056 | 1077.23 | 783 | 756 | 168.3 |
| B | 5 | 236 | 108074 | 637.65 | 783 | 756 | 168.3 |
| C | 15 | 177 | 1204485 | 6050.73 | 720 | 715 | 198.9 |
| C | 15 | 215 | 1119974 | 5625.93 | 720 | 715 | 198.9 |
| C | 15 | 216 | 467238 | 2344.97 | 720 | 715 | 198.9 |
| D | 8 | 176 | 464303 | 2144.94 | 768 | 736 | 216.1 |
| D | 11 | 176 | 197671 | 911.22 | 768 | 736 | 216.1 |
| D | 3 | 12 | 160236 | 738.01 | 768 | 736 | 216.1 |
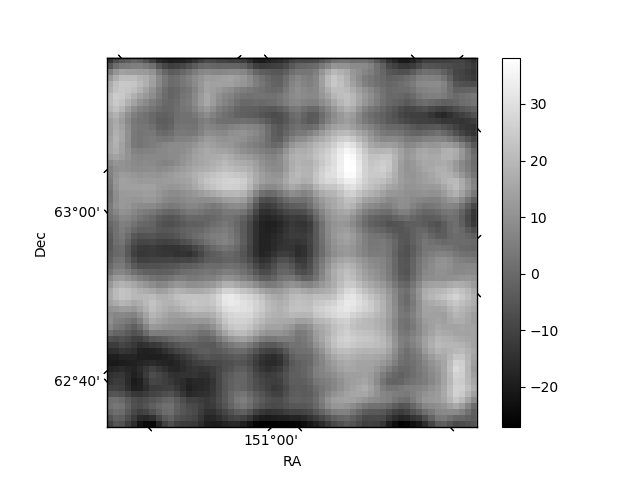
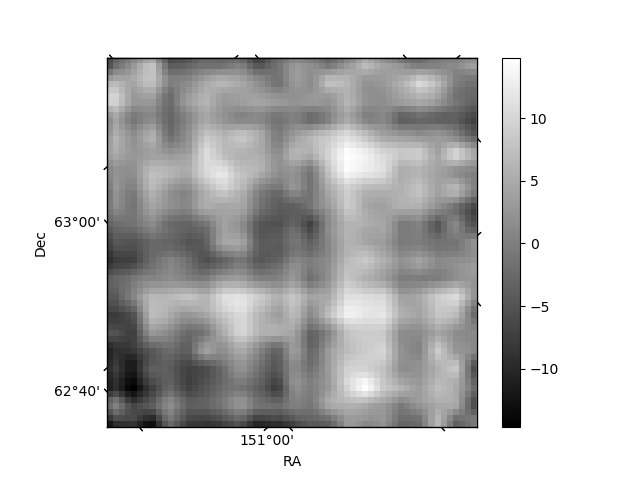
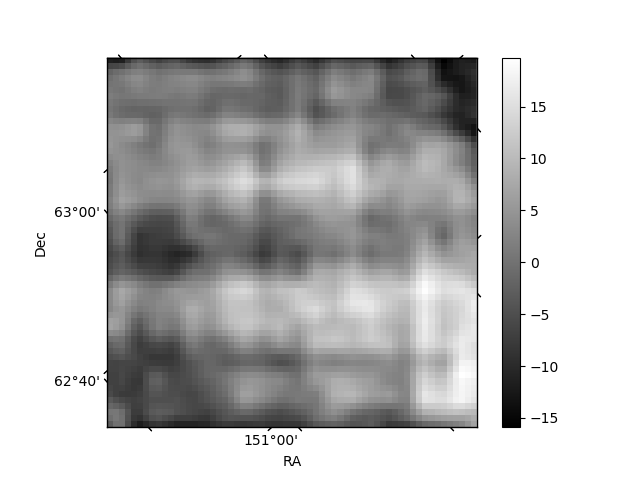
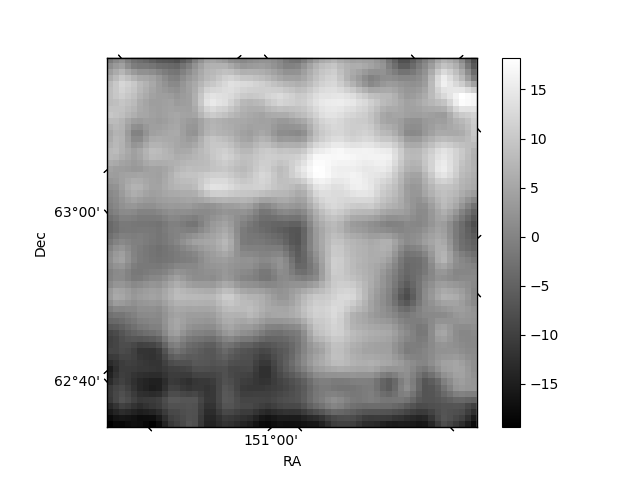
Histogram calculated using DETX and DETY for each event in the final _common_clean file
| Quadrant A | 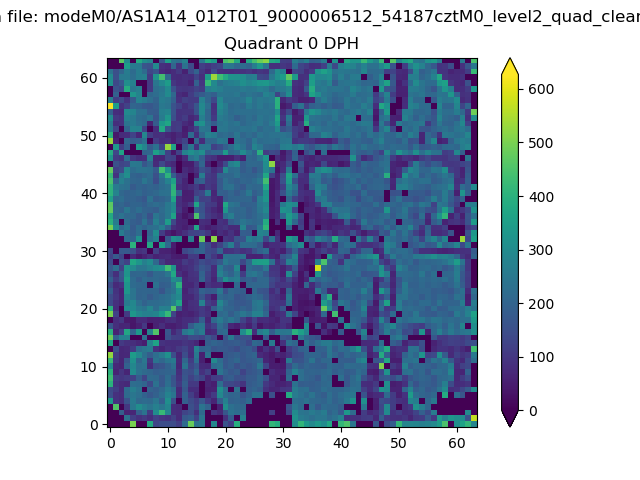 |
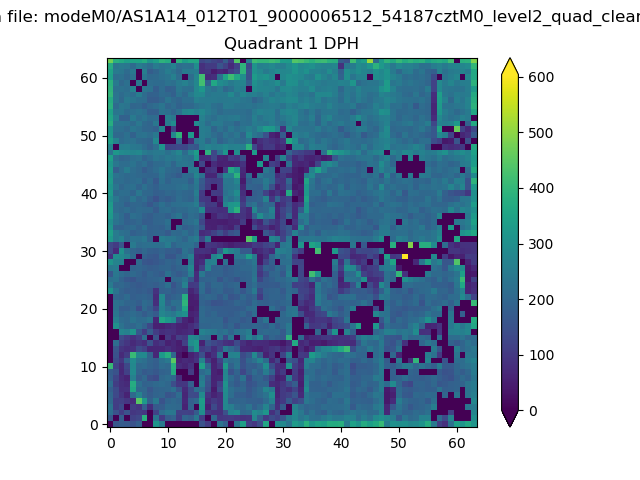 |
Quadrant B |
|---|---|---|---|
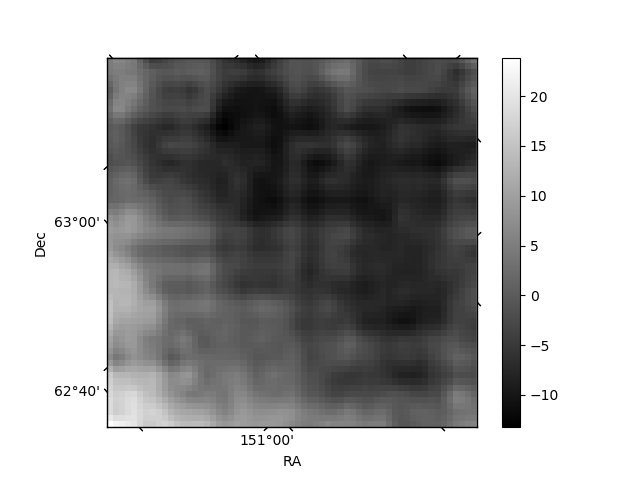
| Quadrant D | 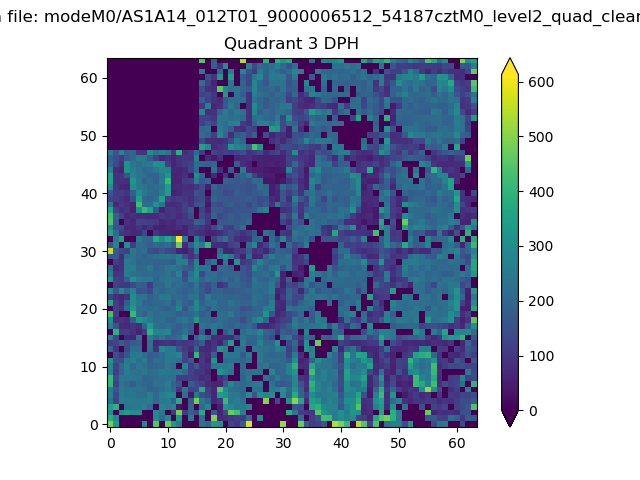 |
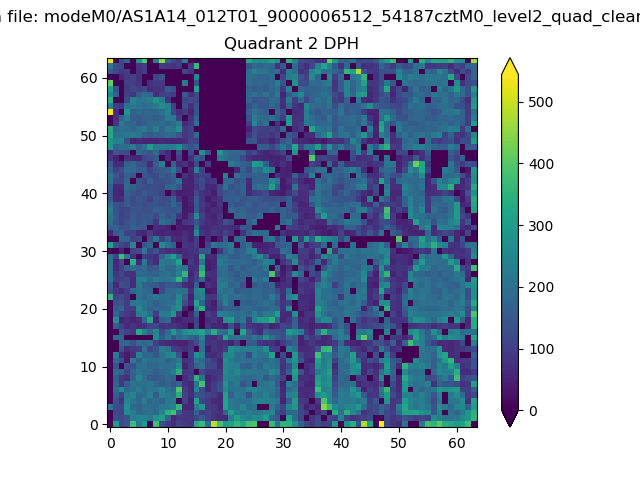 |
Quadrant C |
| Plot type | Count rate plots | Images |
|---|---|---|
| Comparison with Poisson distribution Blue bars denote a histogram of data divided into 1 sec bins. Red curve is a Poisson curve with rate = median count rate of data. |
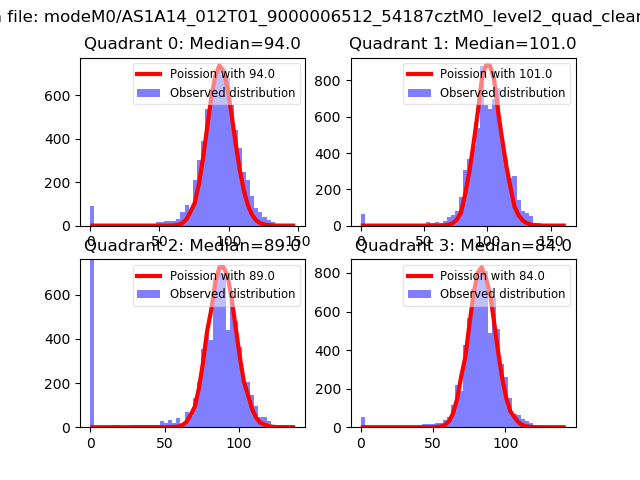 |
 |
| Quadrant-wise count rates Data is divided into 100 sec bins |
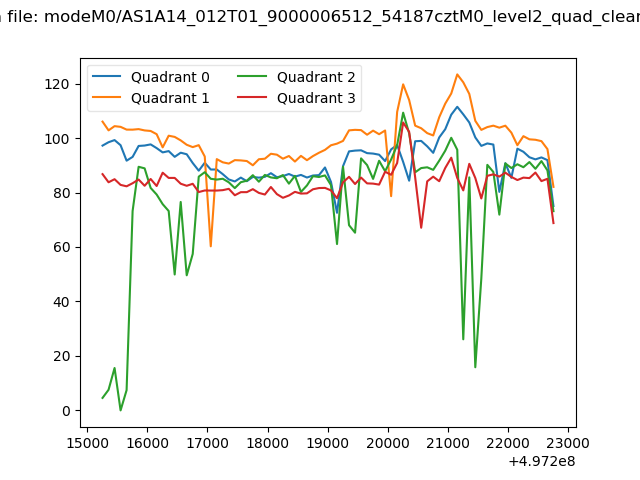 |
|
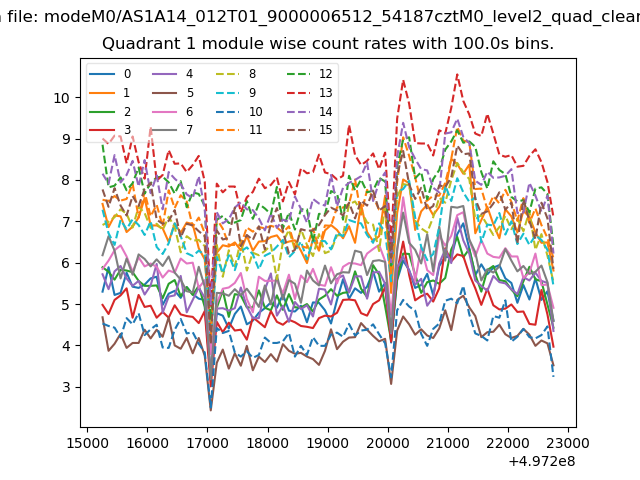
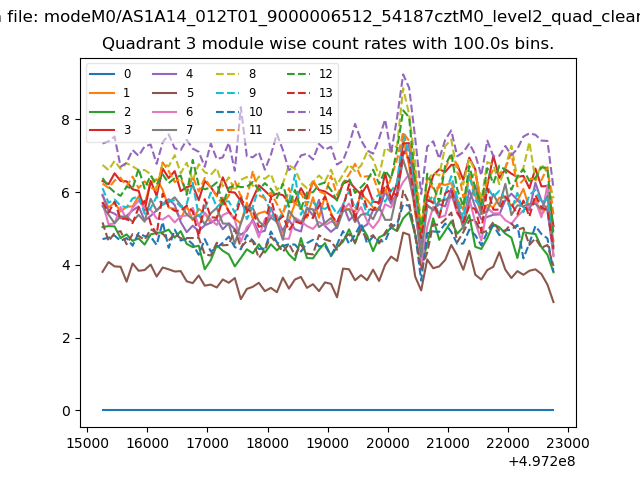
| Module-wise count rates for Quadrant A Data is divided into 100 sec bins |
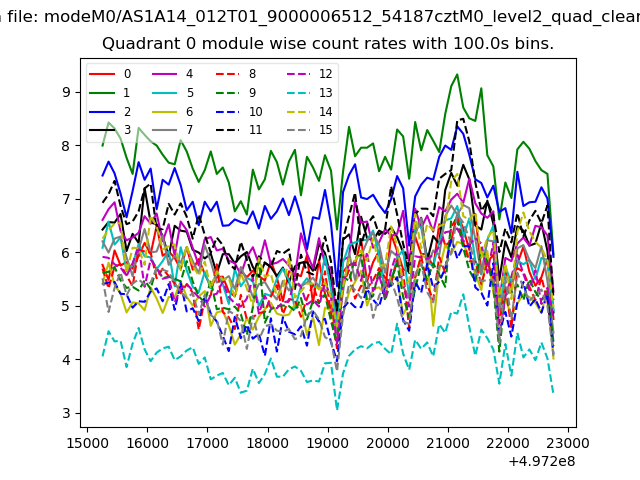 |
 |
| Module-wise count rates for Quadrant B Data is divided into 100 sec bins |
 |
 |
| Module-wise count rates for Quadrant C Data is divided into 100 sec bins |
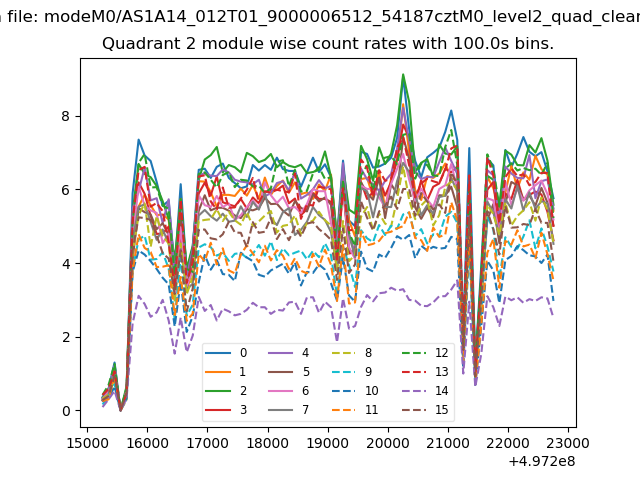 |
 |
| Module-wise count rates for Quadrant D Data is divided into 100 sec bins |
 |
 |
| Parameter | Plot |
|---|---|
| CZT HV Monitor | 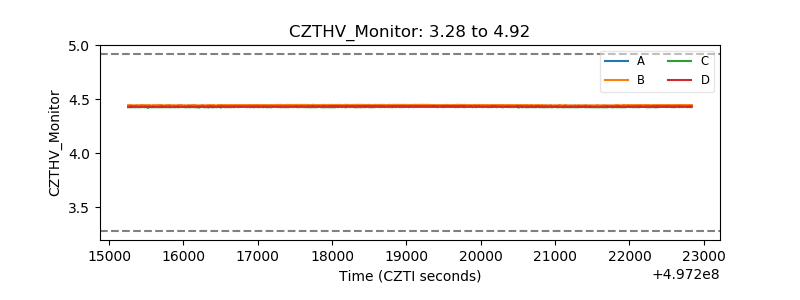 |
| D_VDD | 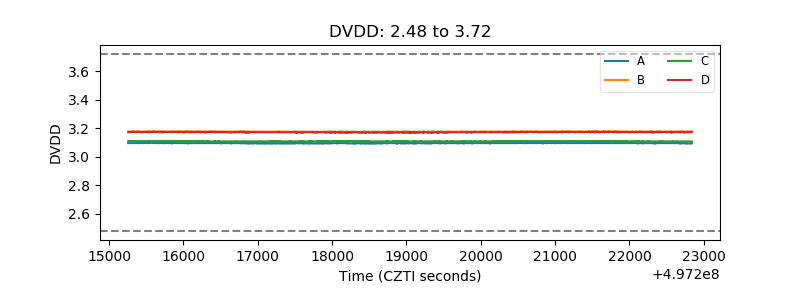 |
| Temperature 1 | 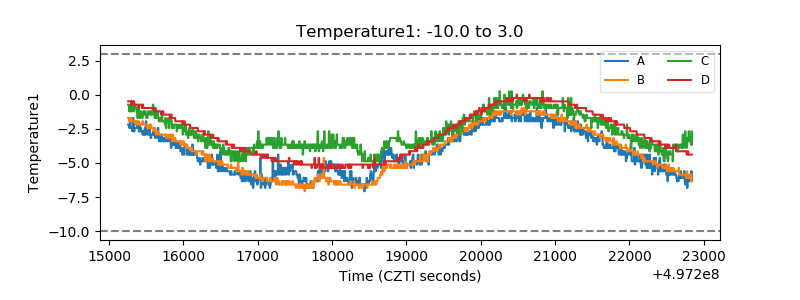 |
| Veto HV Monitor | 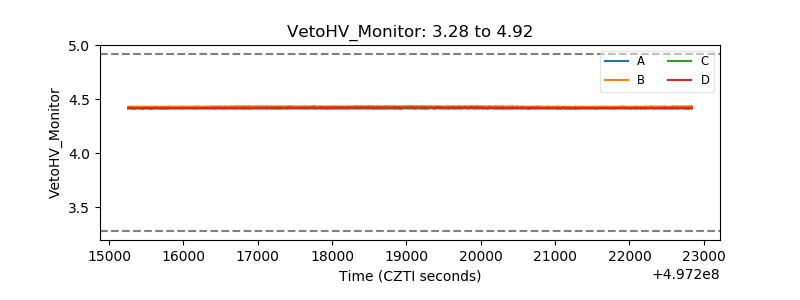 |
| Veto LLD | 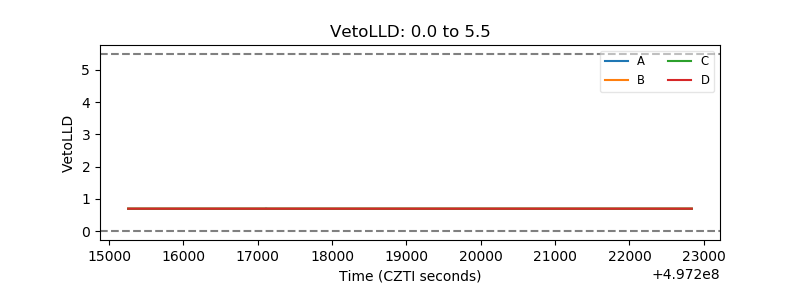 |
| Alpha Counter | 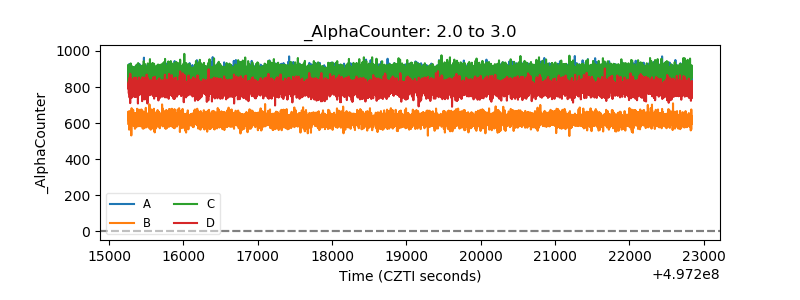 |
| _CPM_Rate | 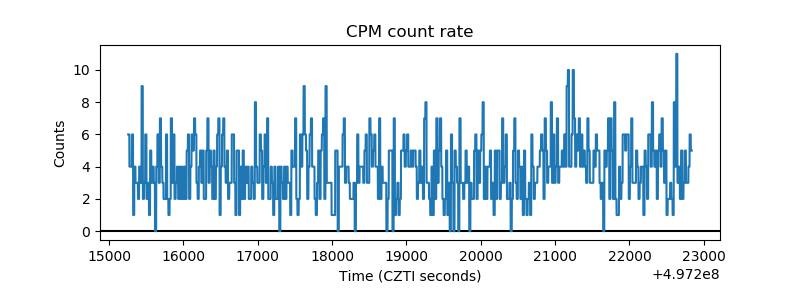 |
| CZT Counter | 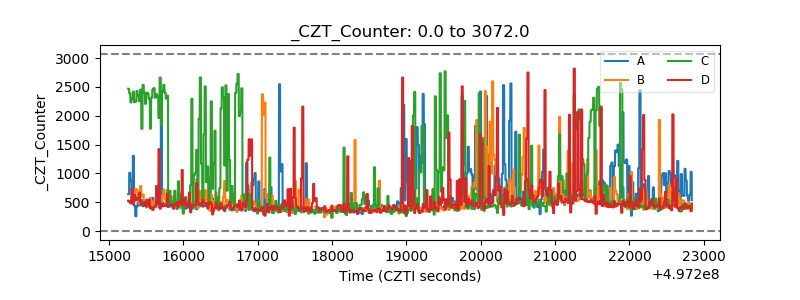 |
| +2.5 Volts monitor |  |
| +5 Volts monitor |  |
| _ROLL_ROT | 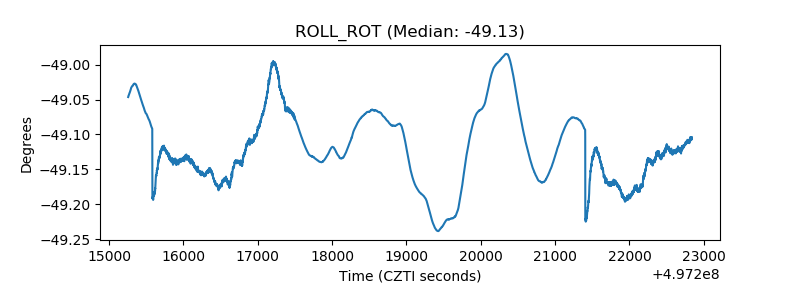 |
| _Roll_DEC | 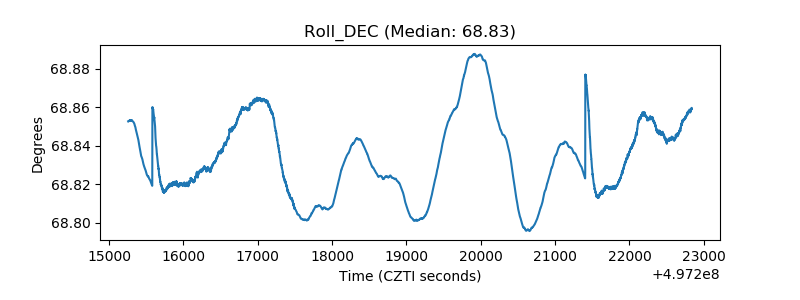 |
| _Roll_RA | 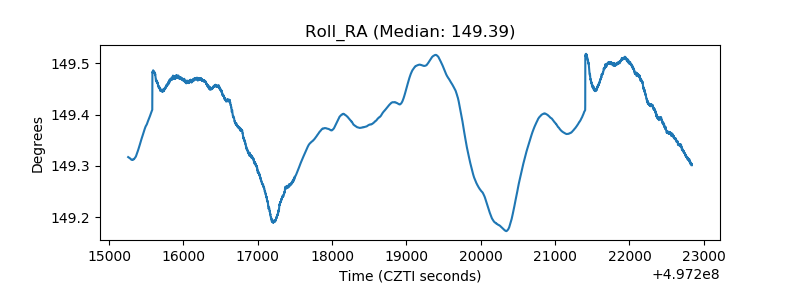 |
| Veto Counter | 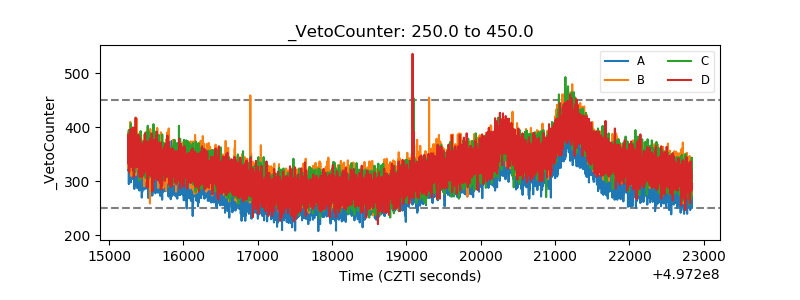 |