| Param | Original file | Final file |
|---|---|---|
| Filename | modeM0/AS1A14_012T01_9000006512_54188cztM0_level2.fits | modeM0/AS1A14_012T01_9000006512_54188cztM0_level2_quad_clean.evt |
| Size (bytes) | 578,108,160 | 114,863,040 |
| Size | 551.3 MB | 109.5 MB |
| Events in quadrant A | 5,259,345 | 750,602 |
| Events in quadrant B | 4,775,490 | 813,185 |
| Events in quadrant C | 5,744,156 | 679,857 |
| Events in quadrant D | 4,990,649 | 670,341 |
| Mode SS | |||
|---|---|---|---|
| Quadrant | BADHDUFLAG | Total packets | Discarded packets |
| A | 0 | 162 | 0 |
| B | 0 | 162 | 0 |
| C | 0 | 162 | 0 |
| D | 0 | 162 | 0 |
| Mode M0 | |||
|---|---|---|---|
| Quadrant | BADHDUFLAG | Total packets | Discarded packets |
| A | 0 | 21485 | 0 |
| B | 0 | 20059 | 0 |
| C | 0 | 23128 | 0 |
| D | 0 | 20801 | 0 |
| Quadrant | Total seconds | Saturated seconds | Saturation percentage |
|---|---|---|---|
| A | 8115 | 238 | 2.932840% |
| B | 8115 | 227 | 2.797289% |
| C | 8116 | 740 | 9.117792% |
| D | 8115 | 322 | 3.967961% |
Noise dominated data is calculated using 1-second bins in cleaned event files. If a bin has >2000 counts, and if more than 50% of those come from <1% of pixels, then it is considered to be noise-dominated and hence unusable.
| Quadrant | # 1 sec bins | Bins with >0 counts | Bins with >2000 counts | High rate bins dominated by noise | Noise dominated (total time) | Noise dominated (detector-on time) | Marked lightcurve |
|---|---|---|---|---|---|---|---|
| A | 8115 | 8115 | 199 | 199 | 2.45% | 2.45% |  |
| B | 8115 | 8115 | 122 | 122 | 1.50% | 1.50% | 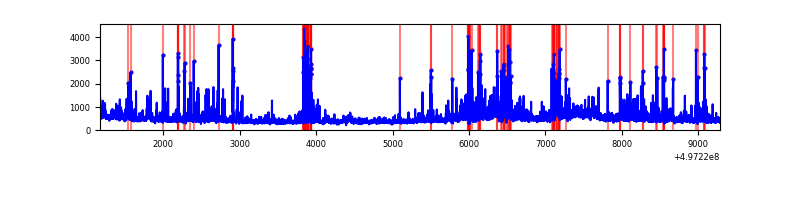 |
| C | 8116 | 8116 | 594 | 594 | 7.32% | 7.32% | 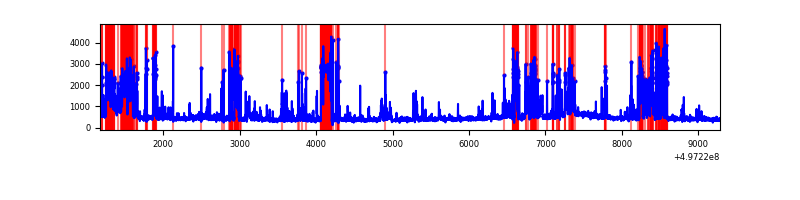 |
| D | 8115 | 8115 | 281 | 281 | 3.46% | 3.46% | 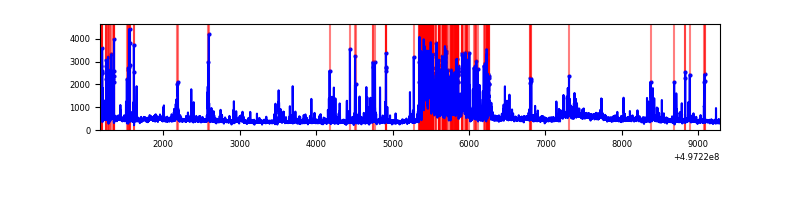 |
Top three noisy pixels from each quadrant. If the there are fewer than three noisy pixels in the level2.evt file, extra rows are filled as -1
| Pixel properties | Quadrant properties | ||||||
|---|---|---|---|---|---|---|---|
| Quadrant | DetID | PixID | Counts | Sigma | Mean | Median | Sigma |
| A | 4 | 5 | 743331 | 3475.72 | 854 | 832 | 213.6 |
| A | 15 | 174 | 338960 | 1582.81 | 854 | 832 | 213.6 |
| A | 3 | 130 | 167401 | 779.73 | 854 | 832 | 213.6 |
| B | 4 | 171 | 515858 | 2844.63 | 850 | 818 | 181.1 |
| B | 15 | 20 | 262749 | 1446.68 | 850 | 818 | 181.1 |
| B | 5 | 185 | 199658 | 1098.22 | 850 | 818 | 181.1 |
| C | 1 | 241 | 1151107 | 5151.92 | 812 | 804 | 223.3 |
| C | 15 | 215 | 499787 | 2234.82 | 812 | 804 | 223.3 |
| C | 12 | 2 | 303010 | 1353.51 | 812 | 804 | 223.3 |
| D | 8 | 176 | 1065047 | 4510.22 | 828 | 792 | 236.0 |
| D | 3 | 12 | 208230 | 879.1 | 828 | 792 | 236.0 |
| D | 11 | 176 | 143985 | 606.84 | 828 | 792 | 236.0 |
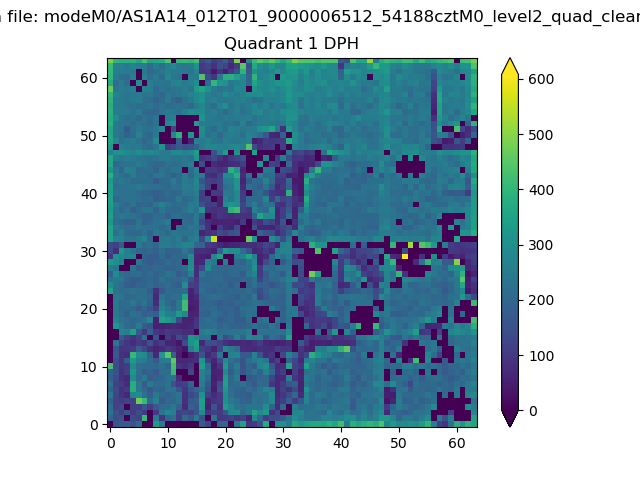
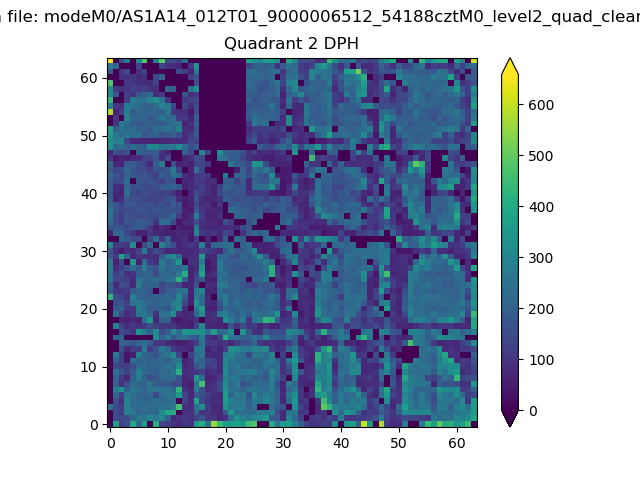
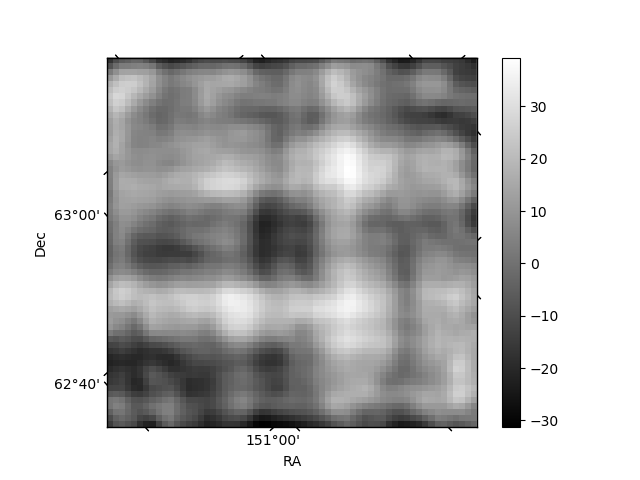
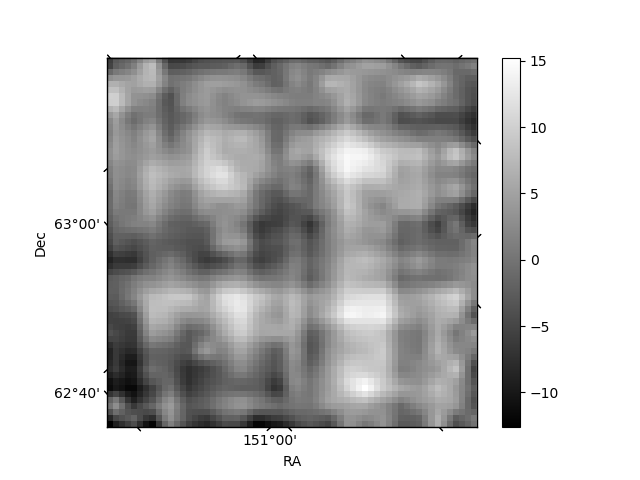
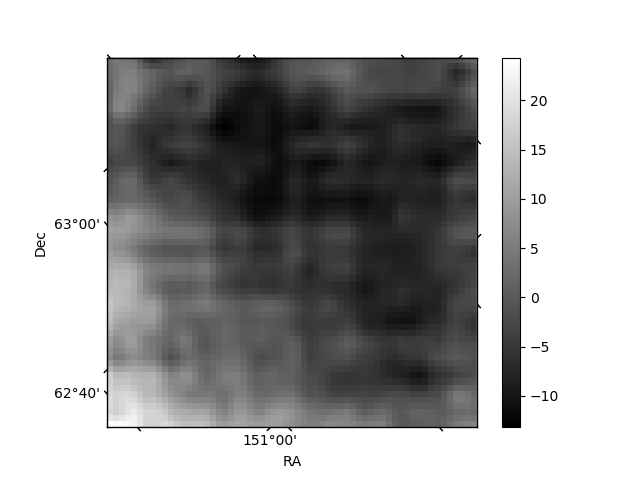
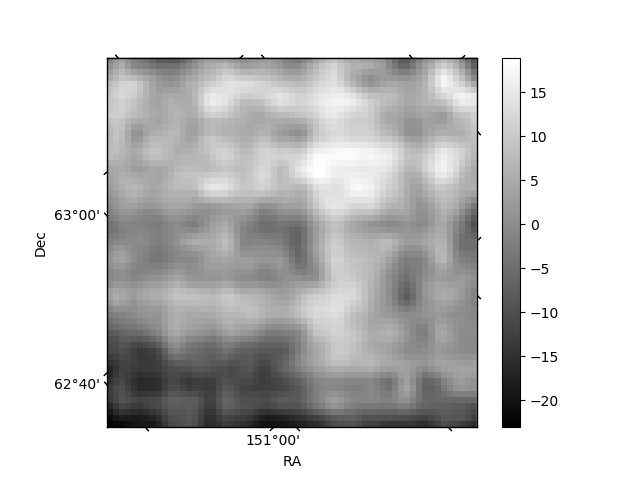
Histogram calculated using DETX and DETY for each event in the final _common_clean file
| Quadrant A | 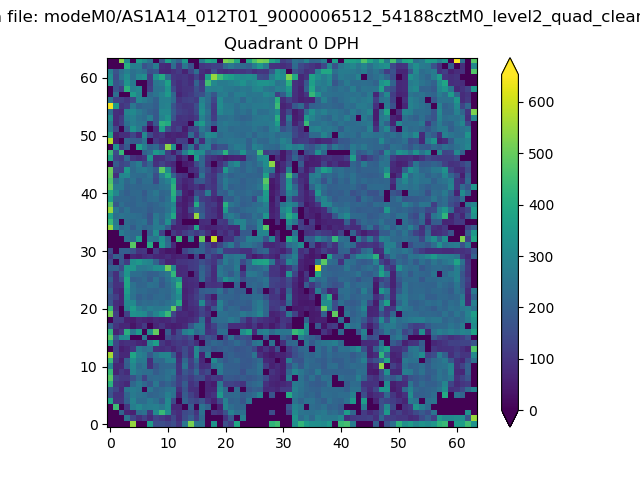 |
 |
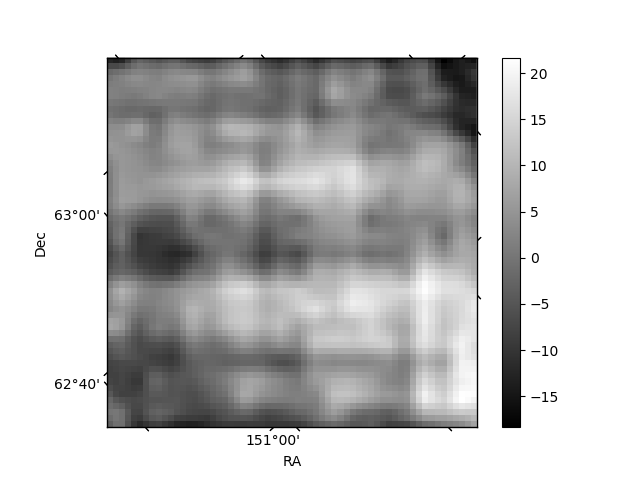
Quadrant B |
|---|---|---|---|
| Quadrant D | 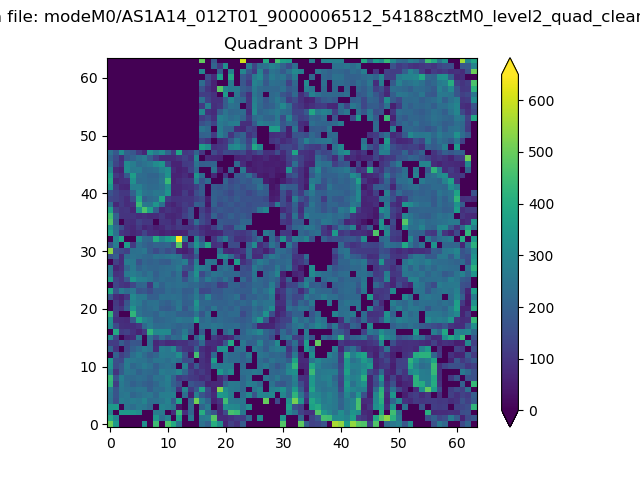 |
 |
Quadrant C |
| Plot type | Count rate plots | Images |
|---|---|---|
| Comparison with Poisson distribution Blue bars denote a histogram of data divided into 1 sec bins. Red curve is a Poisson curve with rate = median count rate of data. |
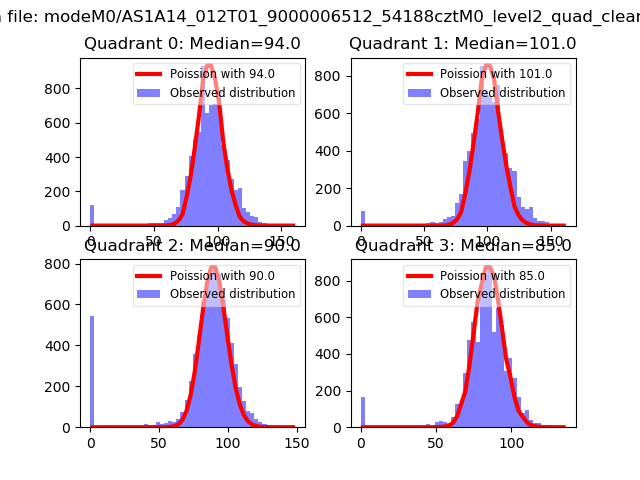 |
 |
| Quadrant-wise count rates Data is divided into 100 sec bins |
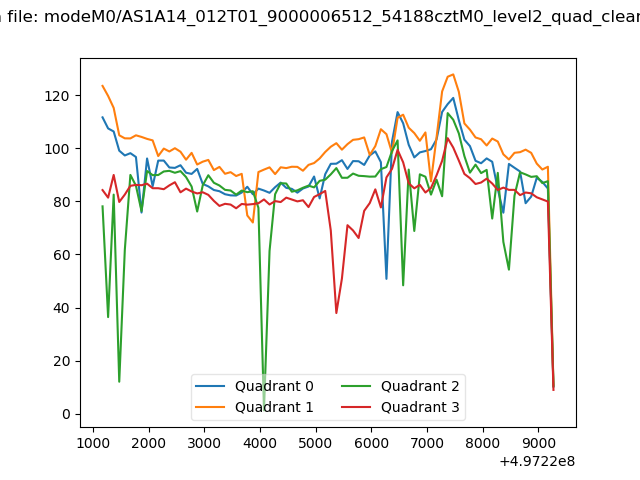 |
|
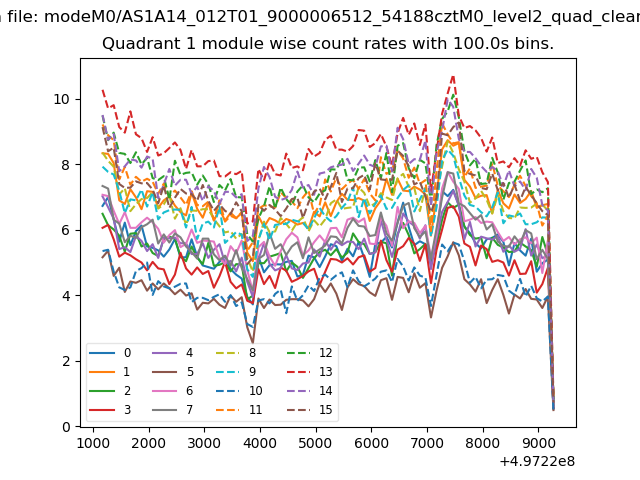
| Module-wise count rates for Quadrant A Data is divided into 100 sec bins |
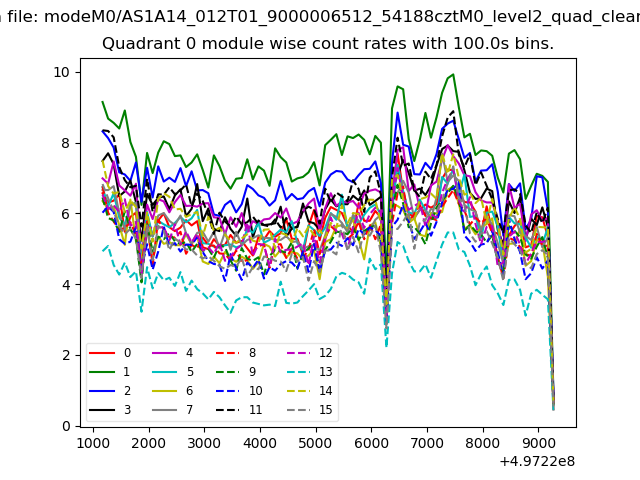 |
 |
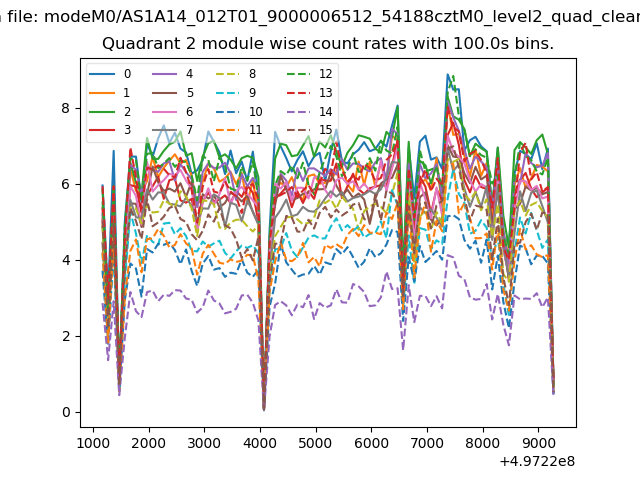
| Module-wise count rates for Quadrant B Data is divided into 100 sec bins |
 |
 |
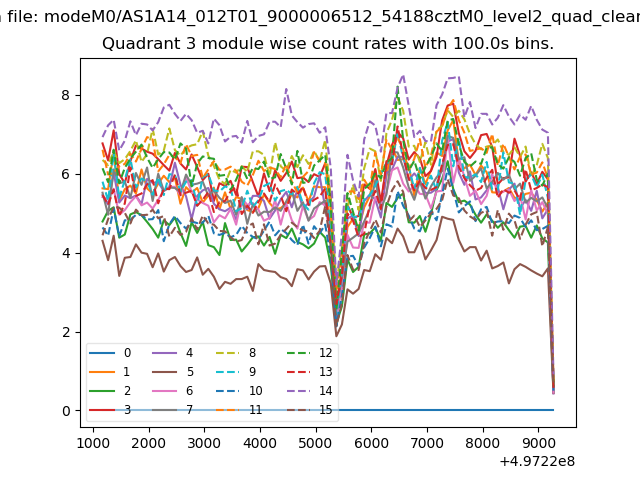
| Module-wise count rates for Quadrant C Data is divided into 100 sec bins |
 |
 |
| Module-wise count rates for Quadrant D Data is divided into 100 sec bins |
 |
 |
| Parameter | Plot |
|---|---|
| CZT HV Monitor | 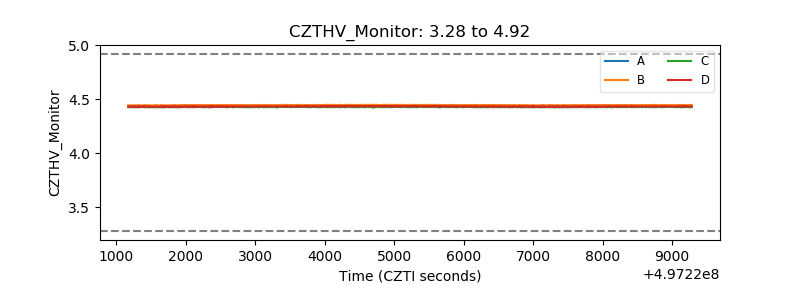 |
| D_VDD | 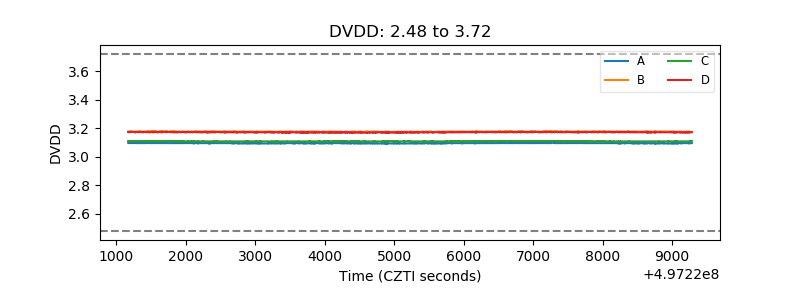 |
| Temperature 1 | 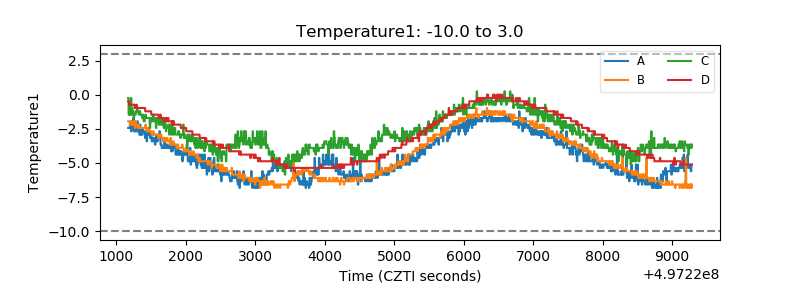 |
| Veto HV Monitor | 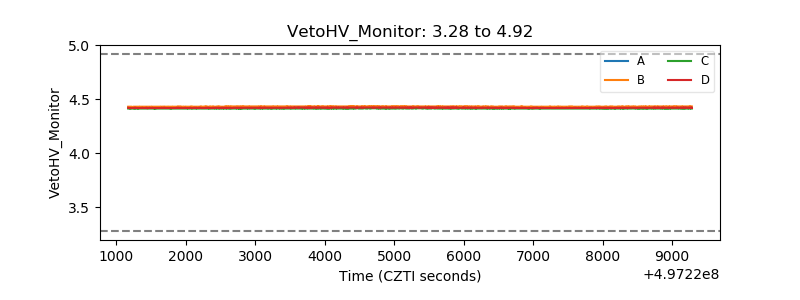 |
| Veto LLD | 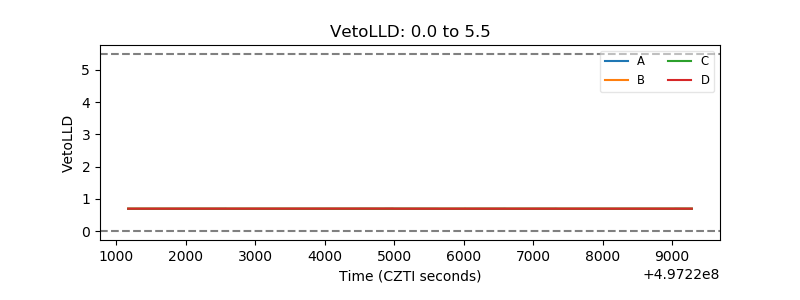 |
| Alpha Counter | 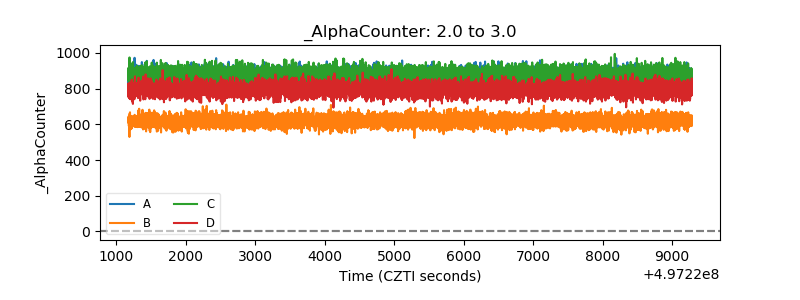 |
| _CPM_Rate | 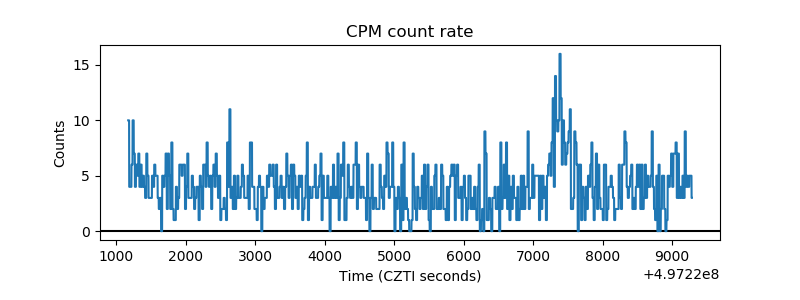 |
| CZT Counter | 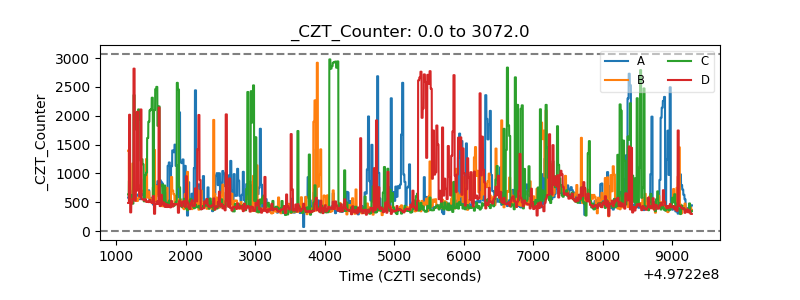 |
| +2.5 Volts monitor | 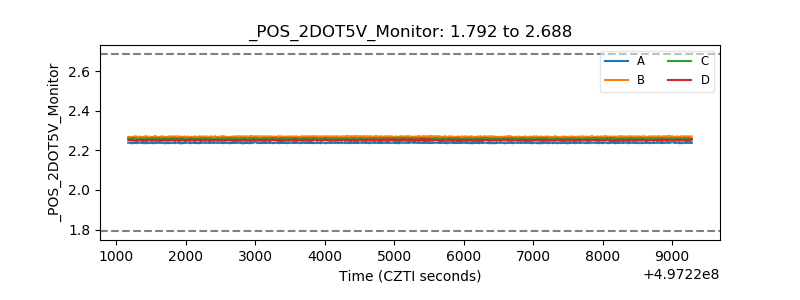 |
| +5 Volts monitor | 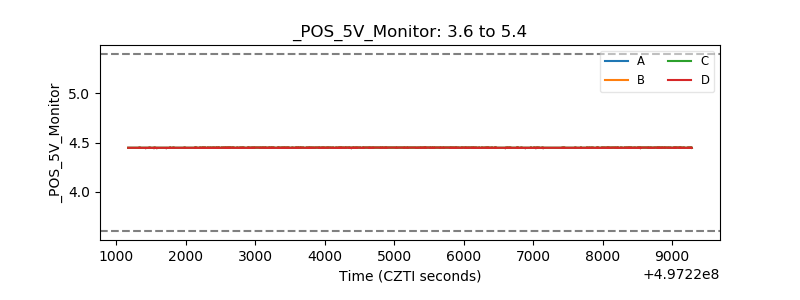 |
| _ROLL_ROT | 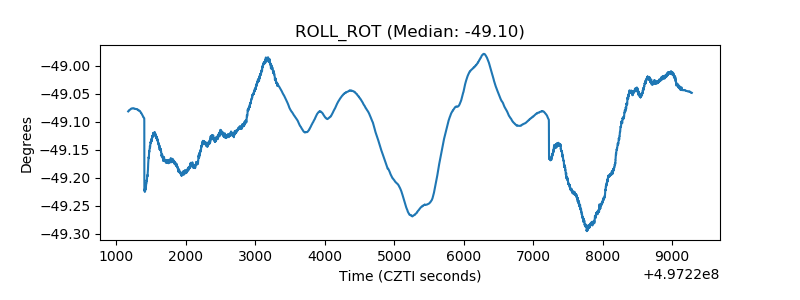 |
| _Roll_DEC | 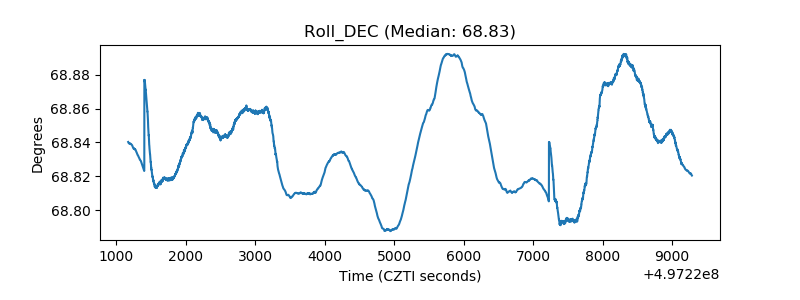 |
| _Roll_RA | 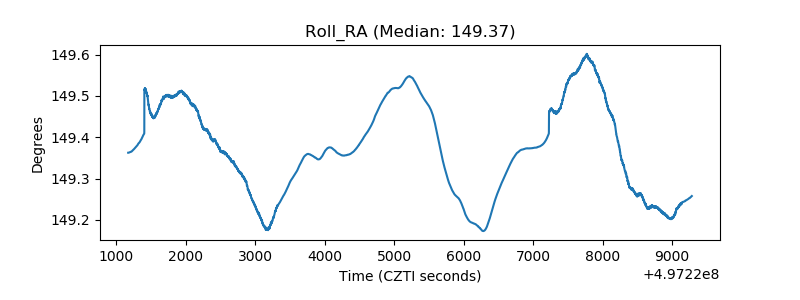 |
| Veto Counter | 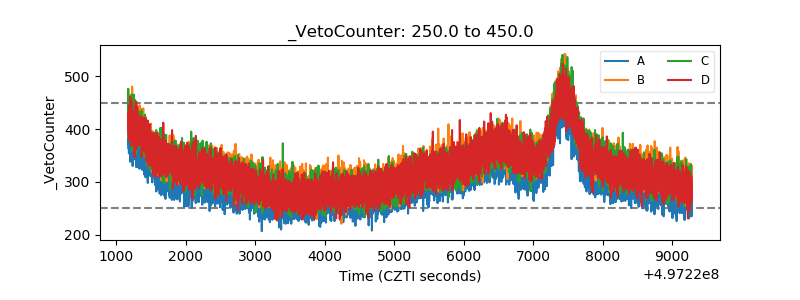 |