| Param | Original file | Final file |
|---|---|---|
| Filename | modeM0/AS1A14_012T01_9000006512_54191cztM0_level2.fits | modeM0/AS1A14_012T01_9000006512_54191cztM0_level2_quad_clean.evt |
| Size (bytes) | 426,709,440 | 87,056,640 |
| Size | 406.9 MB | 83.0 MB |
| Events in quadrant A | 4,814,814 | 531,509 |
| Events in quadrant B | 3,475,077 | 619,667 |
| Events in quadrant C | 3,504,103 | 541,639 |
| Events in quadrant D | 3,520,834 | 511,551 |
| Mode SS | |||
|---|---|---|---|
| Quadrant | BADHDUFLAG | Total packets | Discarded packets |
| A | 0 | 124 | 0 |
| B | 0 | 124 | 0 |
| C | 0 | 124 | 0 |
| D | 0 | 124 | 0 |
| Mode M0 | |||
|---|---|---|---|
| Quadrant | BADHDUFLAG | Total packets | Discarded packets |
| A | 0 | 18720 | 0 |
| B | 0 | 14895 | 0 |
| C | 0 | 15167 | 0 |
| D | 0 | 15178 | 0 |
| Quadrant | Total seconds | Saturated seconds | Saturation percentage |
|---|---|---|---|
| A | 6178 | 642 | 10.391713% |
| B | 6178 | 110 | 1.780511% |
| C | 6179 | 247 | 3.997411% |
| D | 6179 | 173 | 2.799806% |
Noise dominated data is calculated using 1-second bins in cleaned event files. If a bin has >2000 counts, and if more than 50% of those come from <1% of pixels, then it is considered to be noise-dominated and hence unusable.
| Quadrant | # 1 sec bins | Bins with >0 counts | Bins with >2000 counts | High rate bins dominated by noise | Noise dominated (total time) | Noise dominated (detector-on time) | Marked lightcurve |
|---|---|---|---|---|---|---|---|
| A | 6178 | 6178 | 400 | 400 | 6.47% | 6.47% | 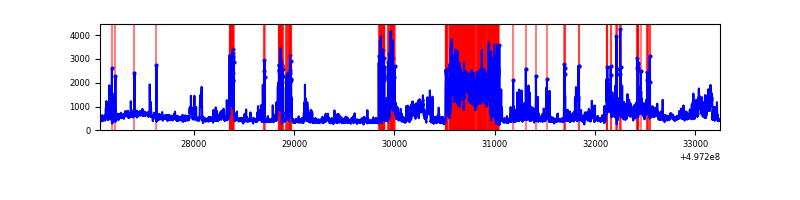 |
| B | 6178 | 6178 | 49 | 49 | 0.79% | 0.79% | 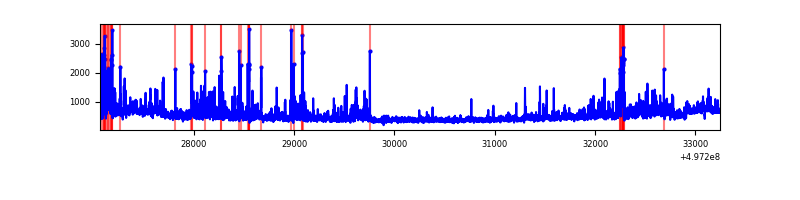 |
| C | 6179 | 6179 | 193 | 193 | 3.12% | 3.12% | 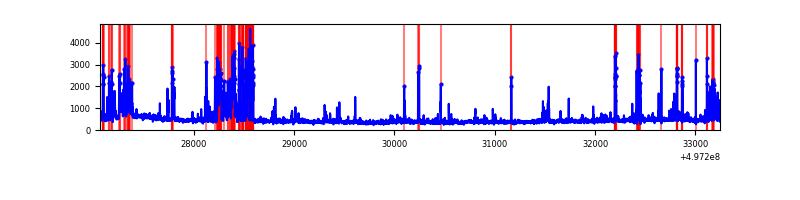 |
| D | 6179 | 6179 | 155 | 155 | 2.51% | 2.51% | 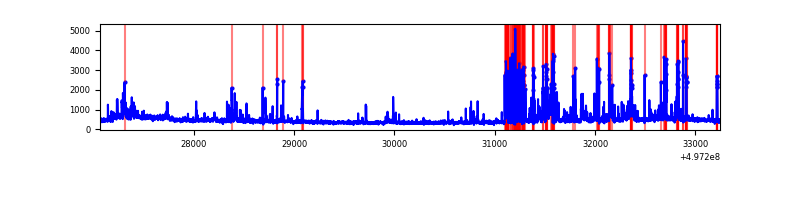 |
Top three noisy pixels from each quadrant. If the there are fewer than three noisy pixels in the level2.evt file, extra rows are filled as -1
| Pixel properties | Quadrant properties | ||||||
|---|---|---|---|---|---|---|---|
| Quadrant | DetID | PixID | Counts | Sigma | Mean | Median | Sigma |
| A | 7 | 29 | 1154656 | 7553.44 | 616 | 600 | 152.8 |
| A | 4 | 5 | 536189 | 3505.5 | 616 | 600 | 152.8 |
| A | 15 | 174 | 199622 | 1302.62 | 616 | 600 | 152.8 |
| B | 15 | 20 | 330756 | 2360.74 | 646 | 622 | 139.8 |
| B | 4 | 171 | 167621 | 1194.18 | 646 | 622 | 139.8 |
| B | 5 | 236 | 125032 | 889.64 | 646 | 622 | 139.8 |
| C | 1 | 241 | 459581 | 2672.77 | 629 | 625 | 171.7 |
| C | 12 | 2 | 152665 | 885.42 | 629 | 625 | 171.7 |
| C | 15 | 215 | 129260 | 749.12 | 629 | 625 | 171.7 |
| D | 8 | 176 | 549184 | 3079.24 | 628 | 600 | 178.2 |
| D | 3 | 12 | 193534 | 1082.95 | 628 | 600 | 178.2 |
| D | 14 | 52 | 55878 | 310.28 | 628 | 600 | 178.2 |
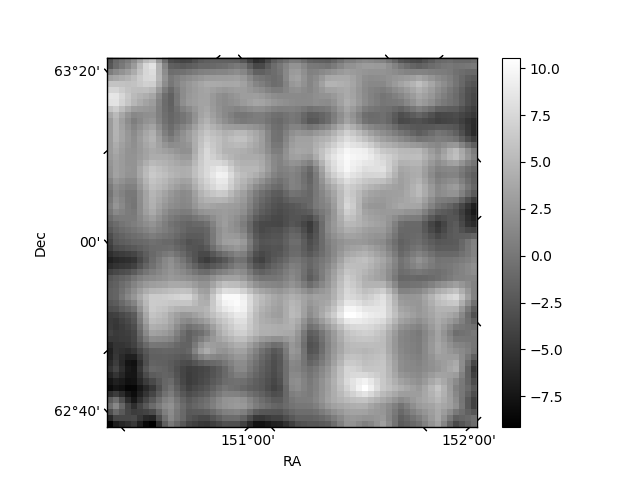
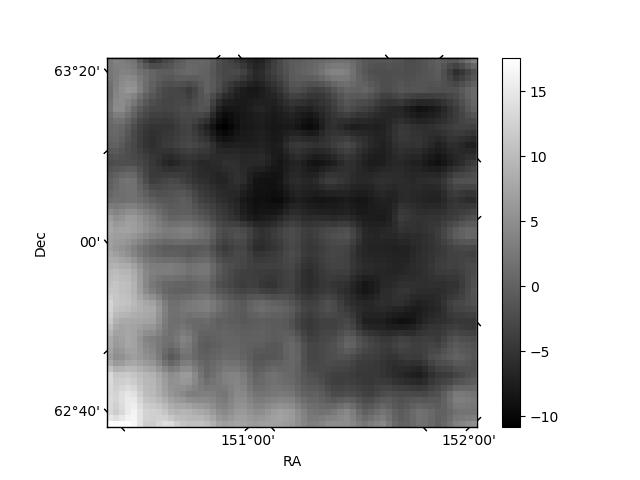
Histogram calculated using DETX and DETY for each event in the final _common_clean file
| Quadrant A | 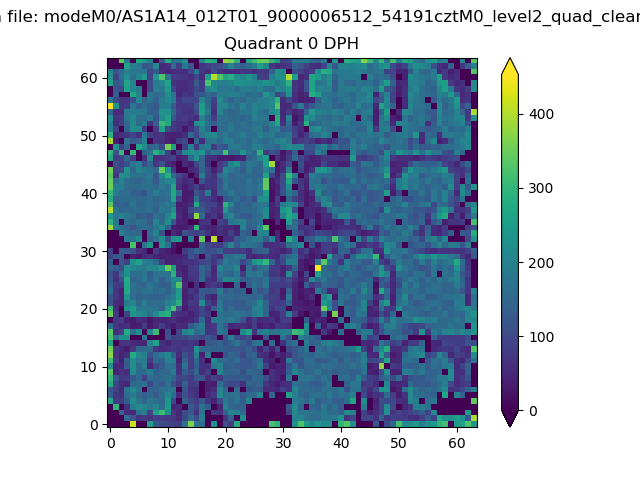 |
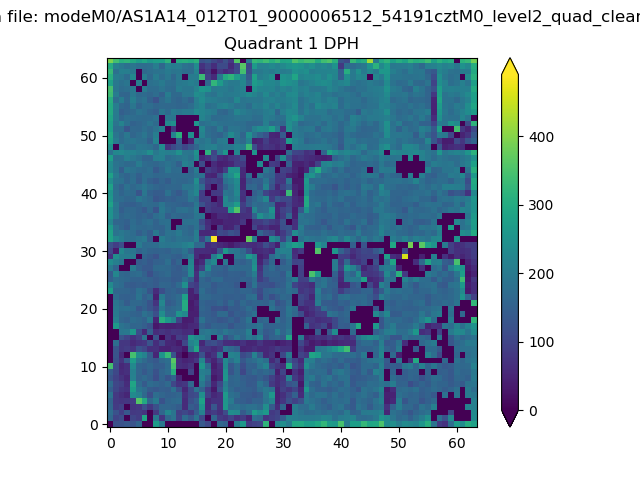 |
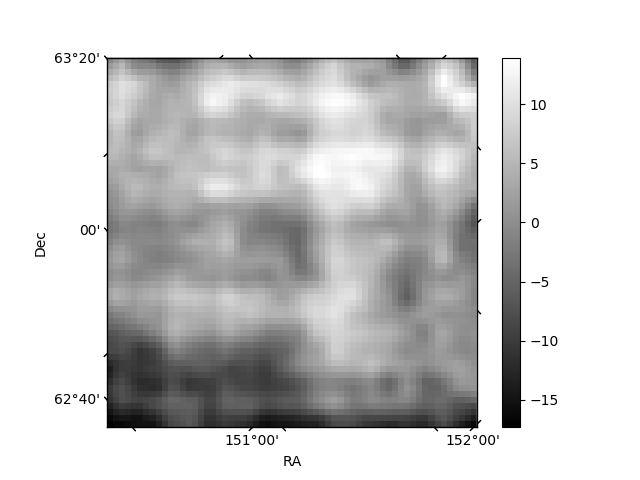
Quadrant B |
|---|---|---|---|
| Quadrant D | 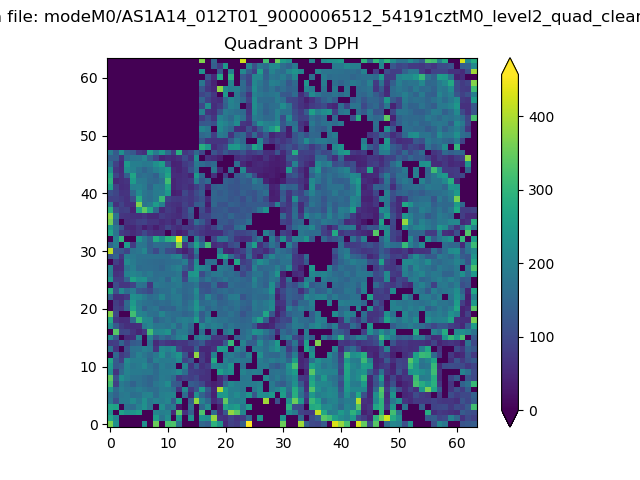 |
 |
Quadrant C |
| Plot type | Count rate plots | Images |
|---|---|---|
| Comparison with Poisson distribution Blue bars denote a histogram of data divided into 1 sec bins. Red curve is a Poisson curve with rate = median count rate of data. |
 |
 |
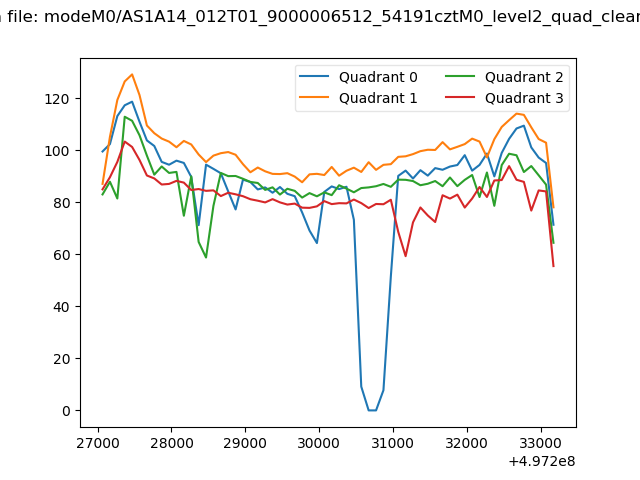
| Quadrant-wise count rates Data is divided into 100 sec bins |
 |
|
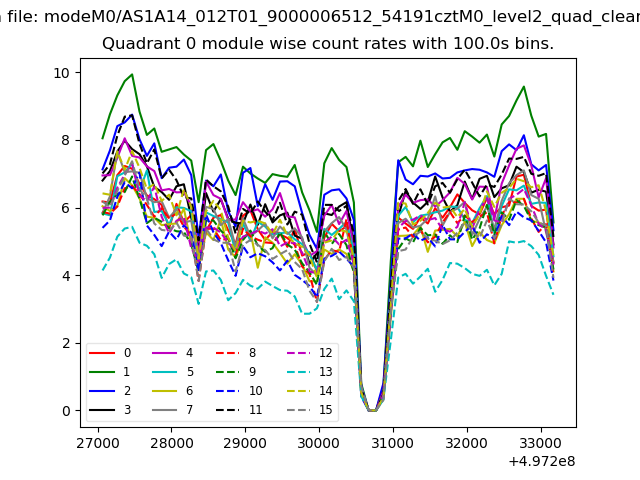
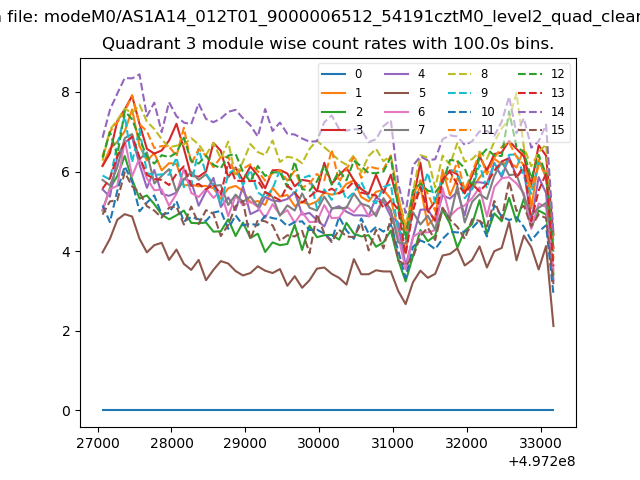
| Module-wise count rates for Quadrant A Data is divided into 100 sec bins |
 |
 |
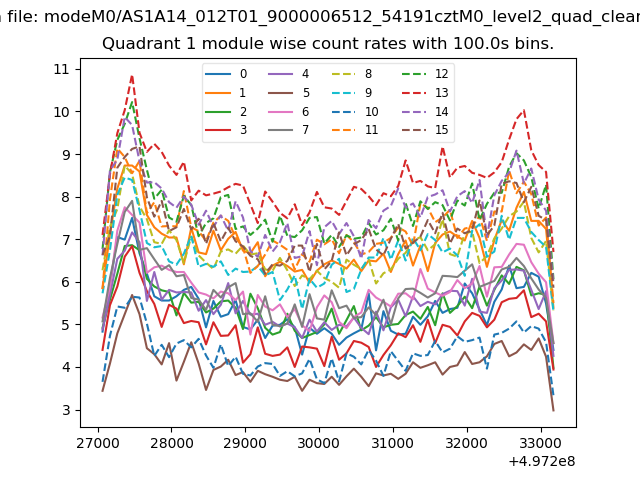
| Module-wise count rates for Quadrant B Data is divided into 100 sec bins |
 |
 |
| Module-wise count rates for Quadrant C Data is divided into 100 sec bins |
 |
 |
| Module-wise count rates for Quadrant D Data is divided into 100 sec bins |
 |
 |
| Parameter | Plot |
|---|---|
| CZT HV Monitor | 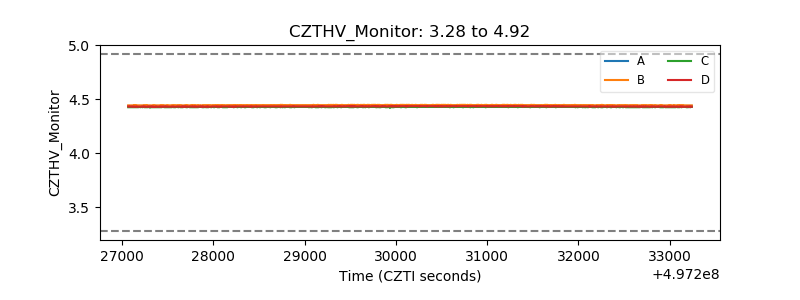 |
| D_VDD | 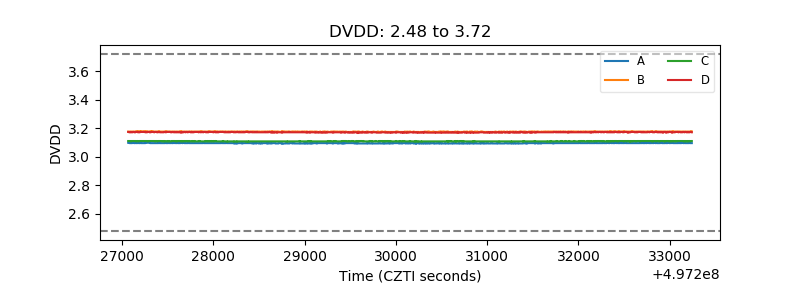 |
| Temperature 1 | 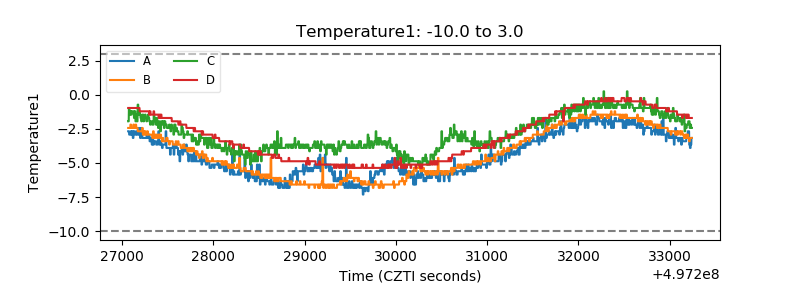 |
| Veto HV Monitor | 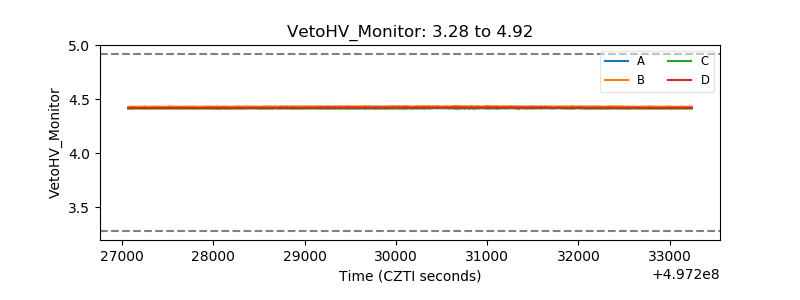 |
| Veto LLD | 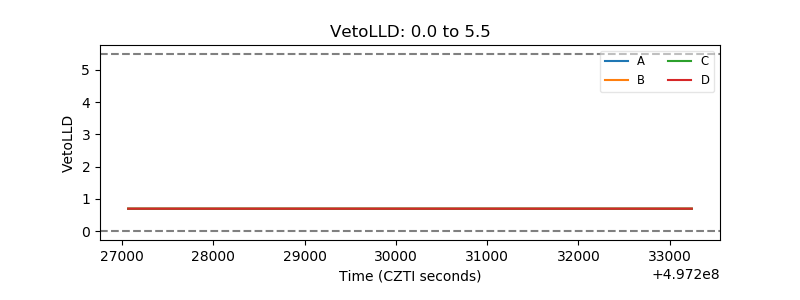 |
| Alpha Counter | 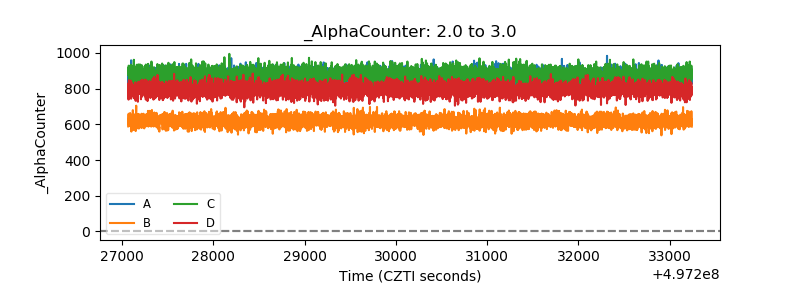 |
| _CPM_Rate |  |
| CZT Counter | 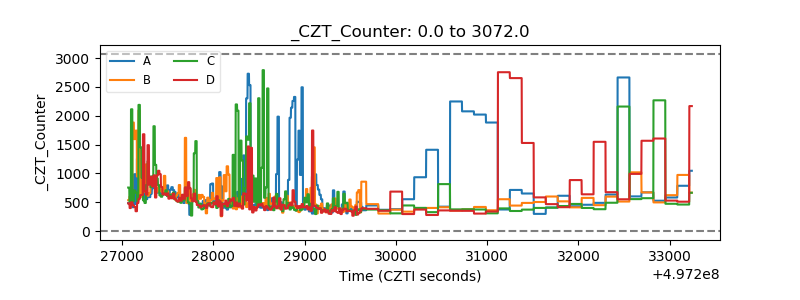 |
| +2.5 Volts monitor |  |
| +5 Volts monitor |  |
| _ROLL_ROT | 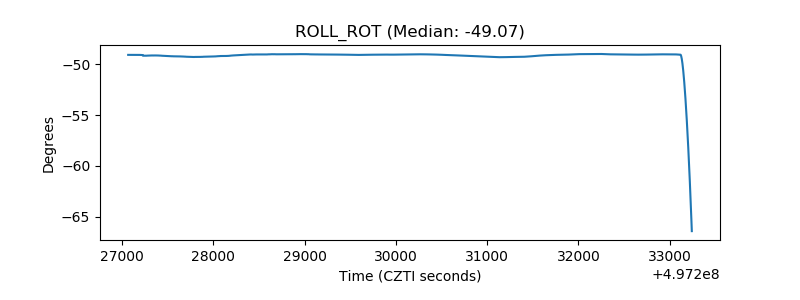 |
| _Roll_DEC | 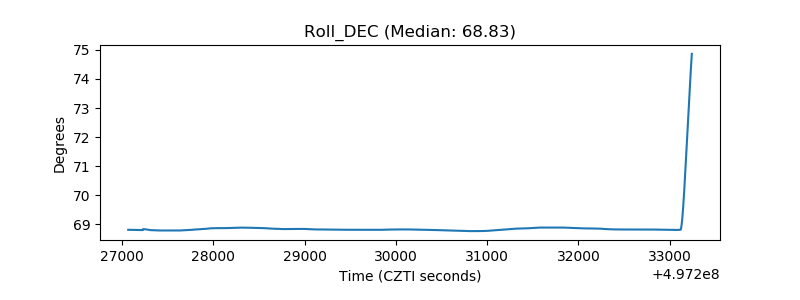 |
| _Roll_RA | 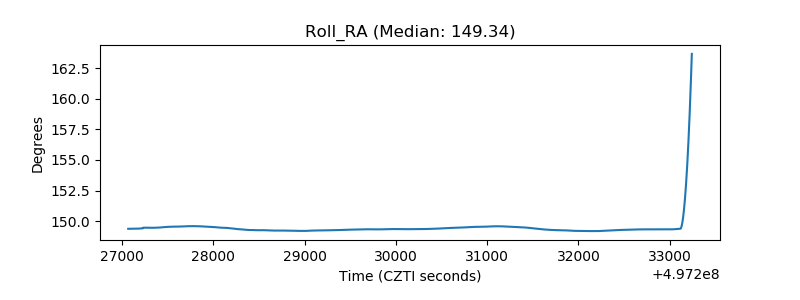 |
| Veto Counter | 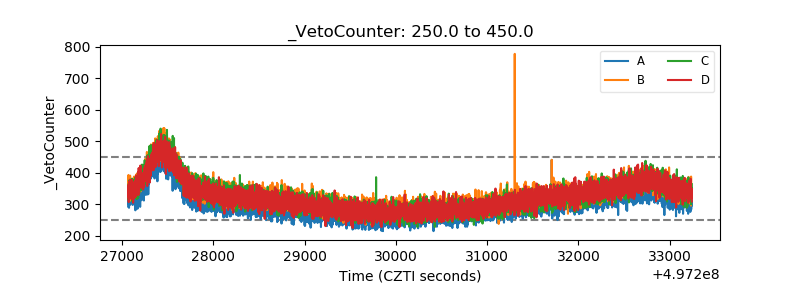 |