| Param | Original file | Final file |
|---|---|---|
| Filename | modeM0/AS1C09_004T08_9000006514_54192cztM0_level2.fits | modeM0/AS1C09_004T08_9000006514_54192cztM0_level2_quad_clean.evt |
| Size (bytes) | 566,870,400 | 80,049,600 |
| Size | 540.6 MB | 76.3 MB |
| Events in quadrant A | 3,133,130 | 562,207 |
| Events in quadrant B | 4,252,823 | 612,051 |
| Events in quadrant C | 3,518,748 | 517,321 |
| Events in quadrant D | 9,604,673 | 305,704 |
| Mode M0 | |||
|---|---|---|---|
| Quadrant | BADHDUFLAG | Total packets | Discarded packets |
| A | 0 | 13831 | 1 |
| B | 0 | 16732 | 3 |
| C | 0 | 15098 | 1 |
| D | 0 | 32716 | 1 |
| Mode M9 | |||
|---|---|---|---|
| Quadrant | BADHDUFLAG | Total packets | Discarded packets |
| A | 0 | 8 | 0 |
| B | 0 | 8 | 0 |
| C | 0 | 8 | 0 |
| D | 0 | 8 | 0 |
| Mode SS | |||
|---|---|---|---|
| Quadrant | BADHDUFLAG | Total packets | Discarded packets |
| A | 0 | 126 | 0 |
| B | 0 | 126 | 0 |
| C | 0 | 126 | 0 |
| D | 0 | 126 | 0 |
| Quadrant | Total seconds | Saturated seconds | Saturation percentage |
|---|---|---|---|
| A | 6100 | 159 | 2.606557% |
| B | 6099 | 140 | 2.295458% |
| C | 6100 | 312 | 5.114754% |
| D | 6100 | 2690 | 44.098361% |
Noise dominated data is calculated using 1-second bins in cleaned event files. If a bin has >2000 counts, and if more than 50% of those come from <1% of pixels, then it is considered to be noise-dominated and hence unusable.
| Quadrant | # 1 sec bins | Bins with >0 counts | Bins with >2000 counts | High rate bins dominated by noise | Noise dominated (total time) | Noise dominated (detector-on time) | Marked lightcurve |
|---|---|---|---|---|---|---|---|
| A | 6995 | 6101 | 84 | 84 | 1.20% | 1.38% | 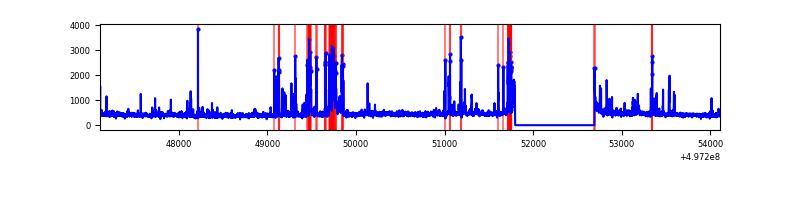 |
| B | 6994 | 6099 | 76 | 76 | 1.09% | 1.25% | 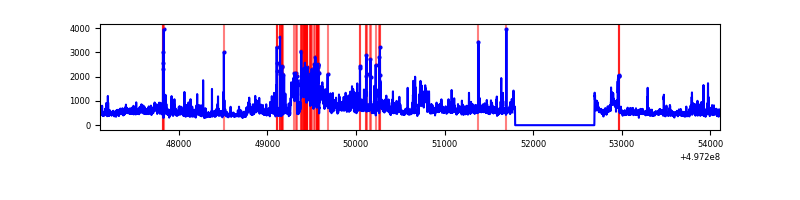 |
| C | 6995 | 6101 | 245 | 245 | 3.50% | 4.02% | 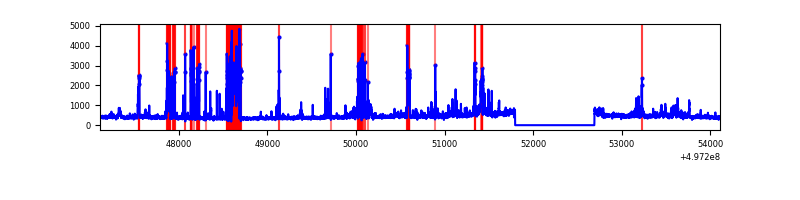 |
| D | 6994 | 6100 | 2383 | 2383 | 34.07% | 39.07% | 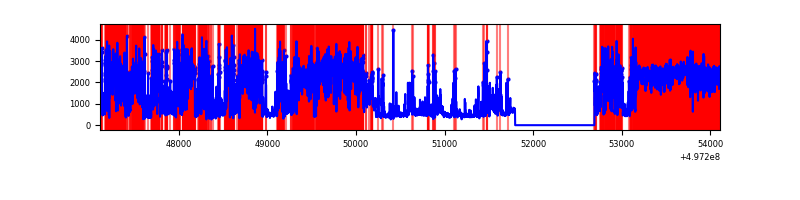 |
Top three noisy pixels from each quadrant. If the there are fewer than three noisy pixels in the level2.evt file, extra rows are filled as -1
| Pixel properties | Quadrant properties | ||||||
|---|---|---|---|---|---|---|---|
| Quadrant | DetID | PixID | Counts | Sigma | Mean | Median | Sigma |
| A | 15 | 174 | 255367 | 1637.78 | 628 | 612 | 155.5 |
| A | 7 | 29 | 190427 | 1220.29 | 628 | 612 | 155.5 |
| A | 8 | 246 | 68854 | 438.72 | 628 | 612 | 155.5 |
| B | 5 | 236 | 888997 | 6600.37 | 627 | 606 | 134.6 |
| B | 15 | 20 | 525310 | 3898.33 | 627 | 606 | 134.6 |
| B | 4 | 171 | 79744 | 587.96 | 627 | 606 | 134.6 |
| C | 4 | 5 | 679623 | 4110.3 | 598 | 591 | 165.2 |
| C | 12 | 2 | 113118 | 681.15 | 598 | 591 | 165.2 |
| C | 9 | 38 | 97938 | 589.26 | 598 | 591 | 165.2 |
| D | 8 | 176 | 7408775 | 57924.04 | 446 | 427 | 127.9 |
| D | 3 | 12 | 303338 | 2368.39 | 446 | 427 | 127.9 |
| D | 5 | 173 | 34116 | 263.41 | 446 | 427 | 127.9 |
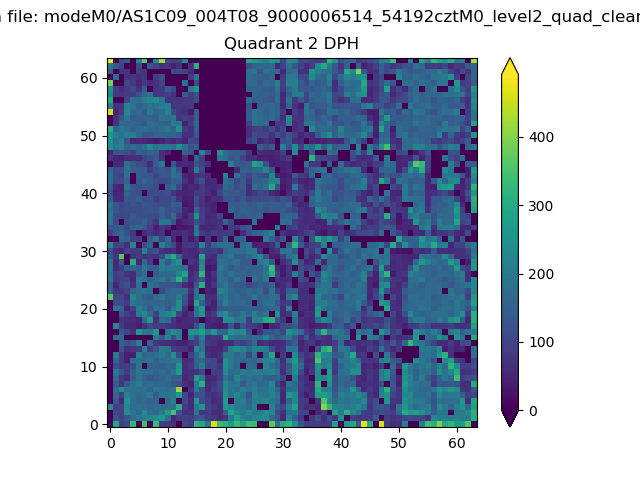
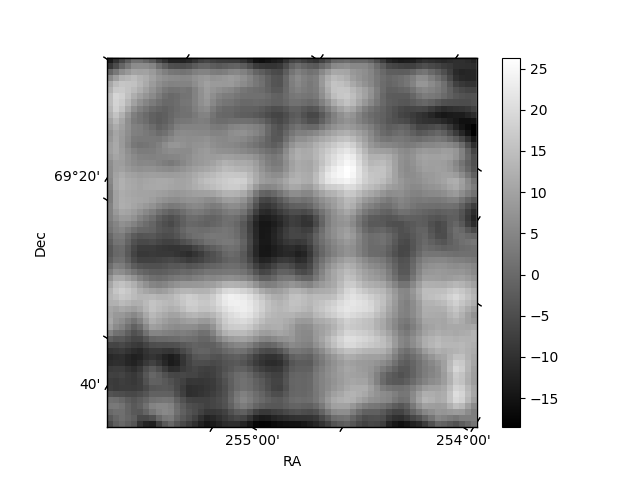
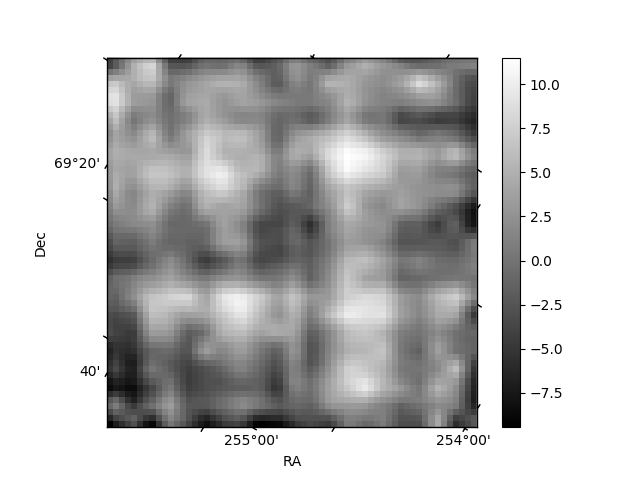
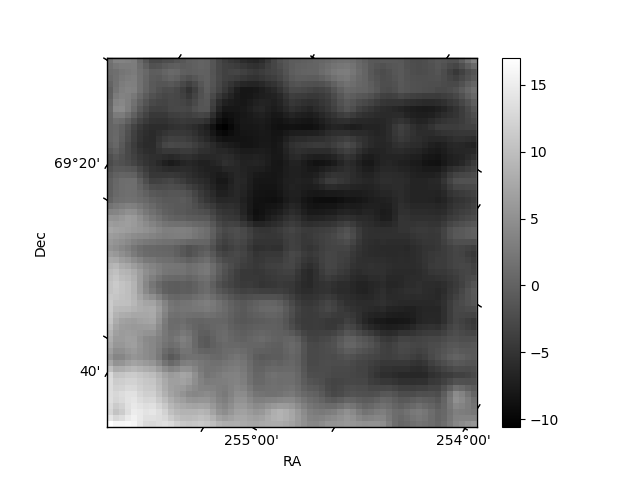
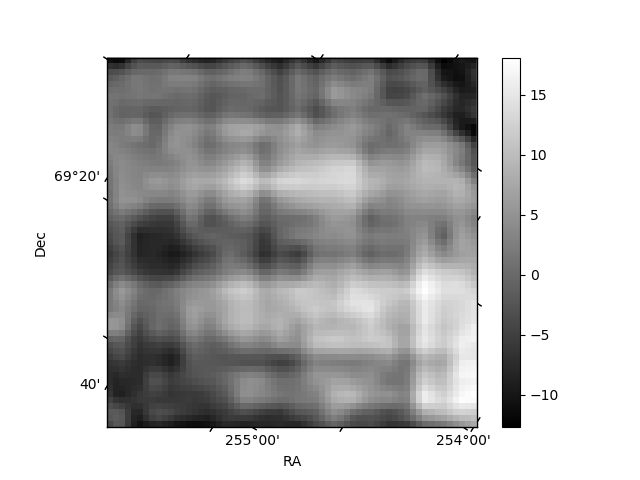
Histogram calculated using DETX and DETY for each event in the final _common_clean file
| Quadrant A | 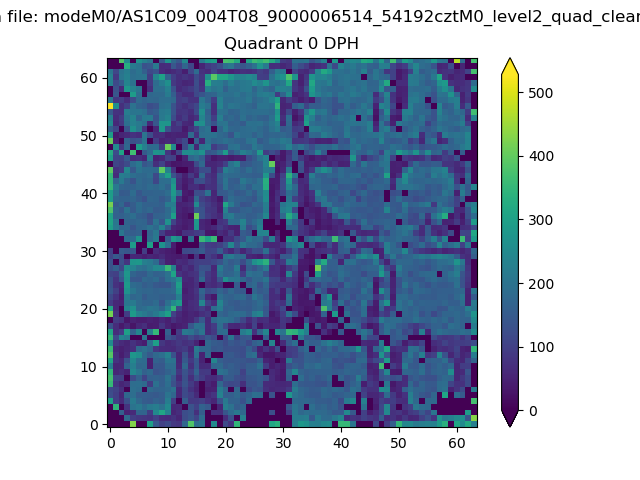 |
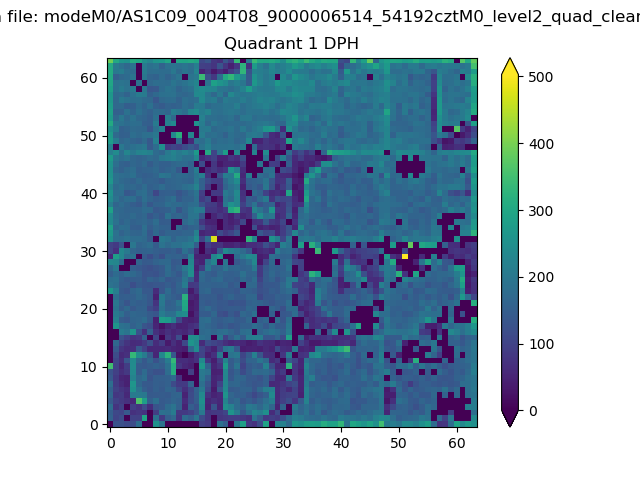 |
Quadrant B |
|---|---|---|---|
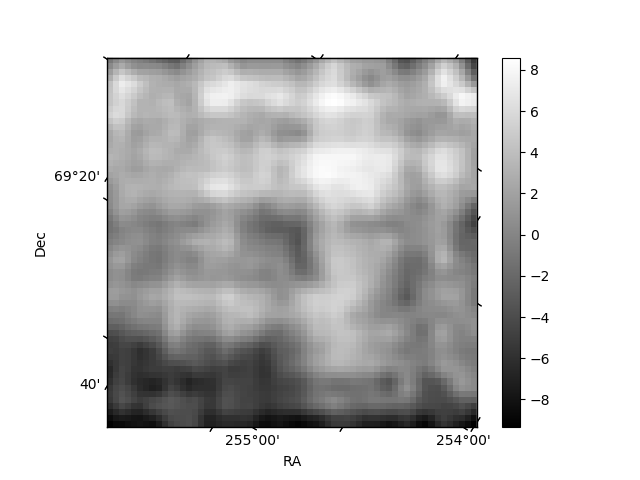
| Quadrant D | 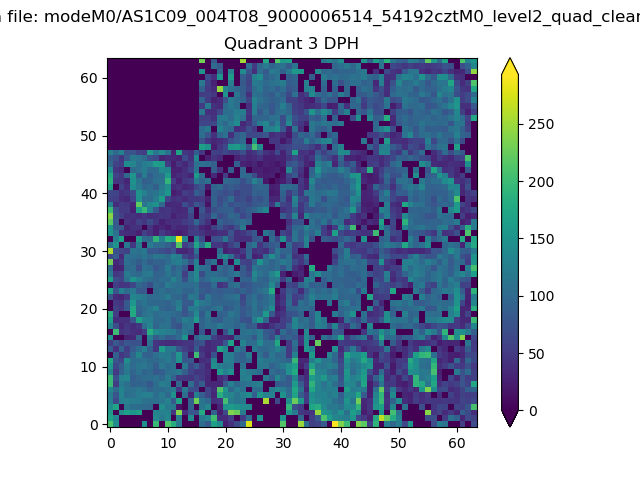 |
 |
Quadrant C |
| Plot type | Count rate plots | Images |
|---|---|---|
| Comparison with Poisson distribution Blue bars denote a histogram of data divided into 1 sec bins. Red curve is a Poisson curve with rate = median count rate of data. |
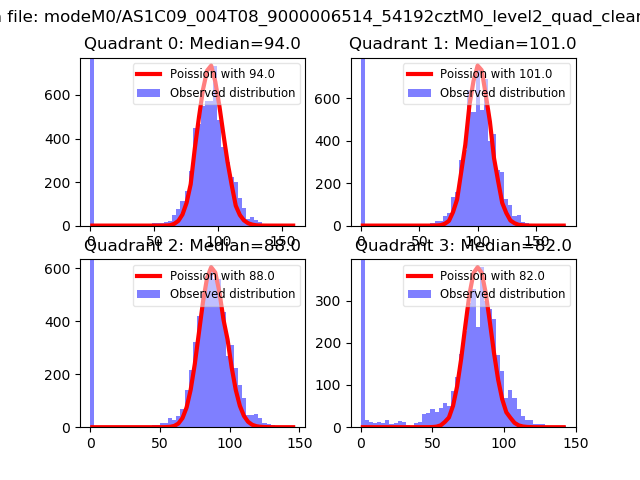 |
 |
| Quadrant-wise count rates Data is divided into 100 sec bins |
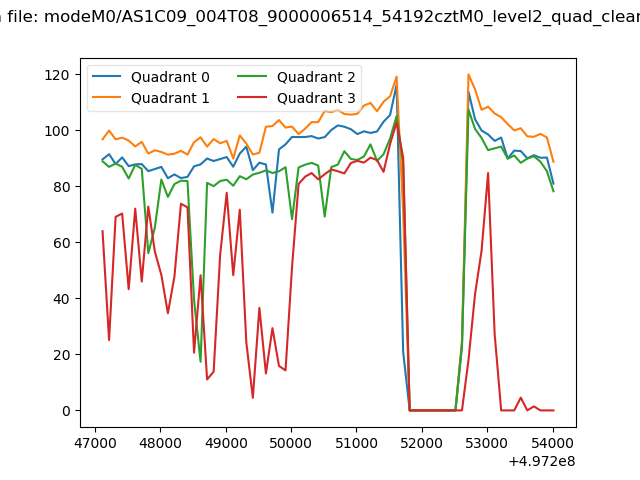 |
|
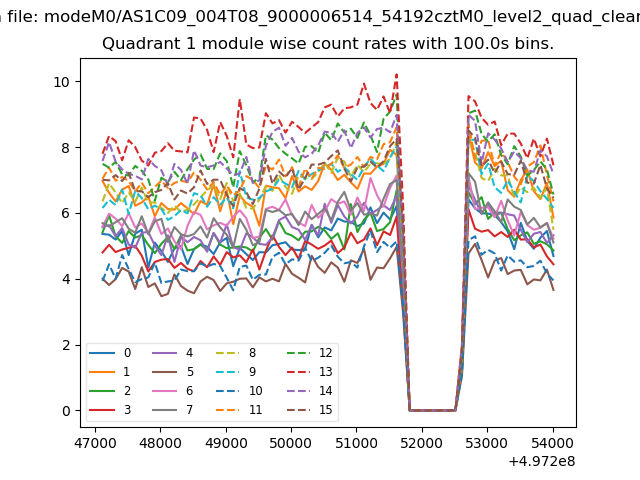
| Module-wise count rates for Quadrant A Data is divided into 100 sec bins |
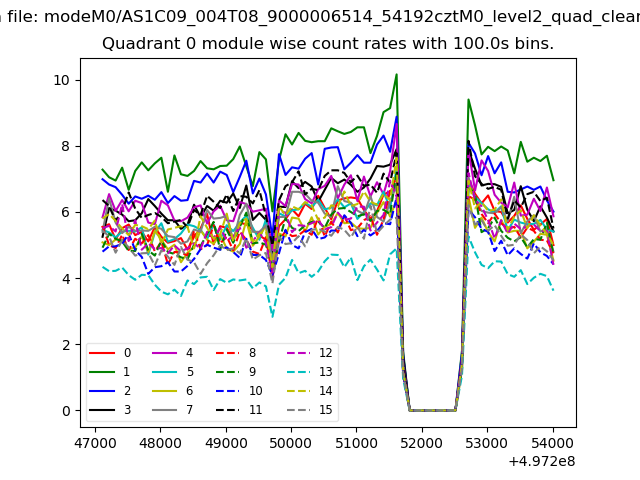 |
 |
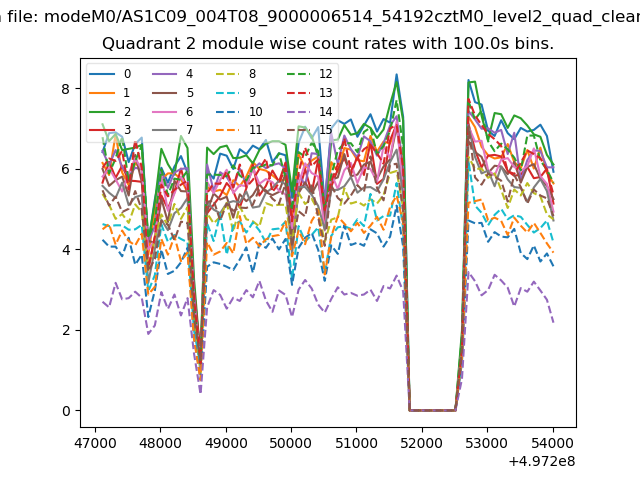
| Module-wise count rates for Quadrant B Data is divided into 100 sec bins |
 |
 |
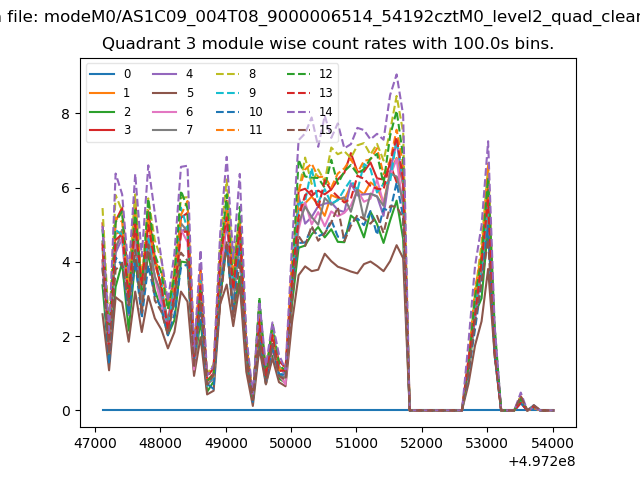
| Module-wise count rates for Quadrant C Data is divided into 100 sec bins |
 |
 |
| Module-wise count rates for Quadrant D Data is divided into 100 sec bins |
 |
 |
| Parameter | Plot |
|---|---|
| CZT HV Monitor | 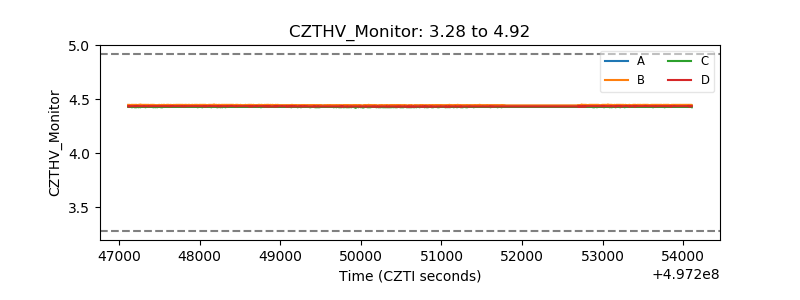 |
| D_VDD | 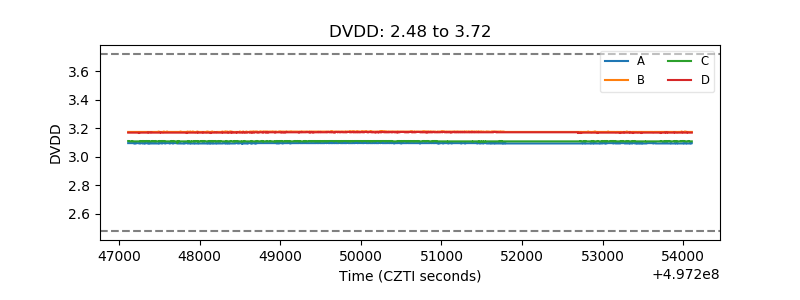 |
| Temperature 1 | 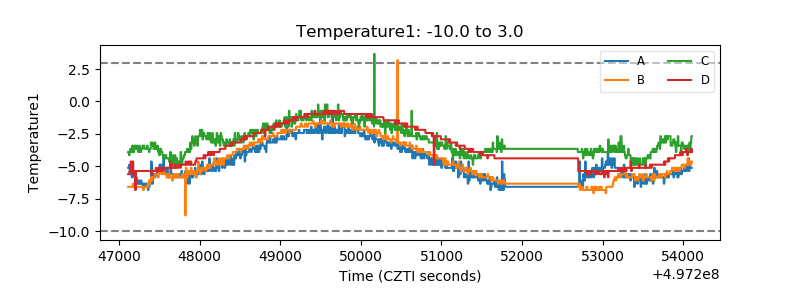 |
| Veto HV Monitor | 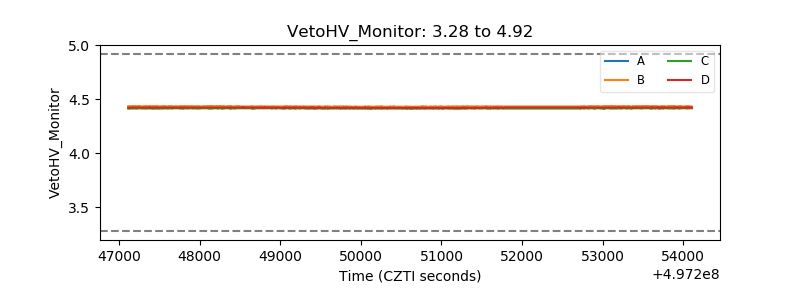 |
| Veto LLD | 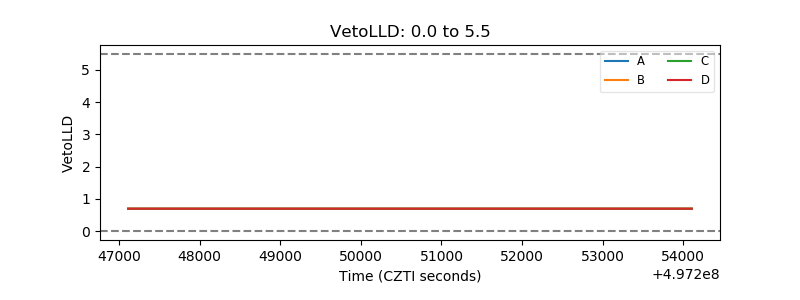 |
| Alpha Counter | 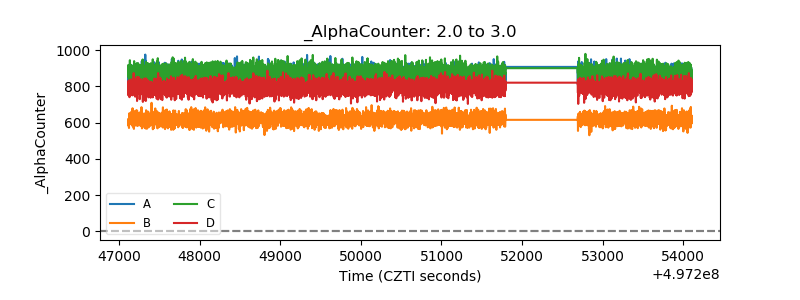 |
| _CPM_Rate | 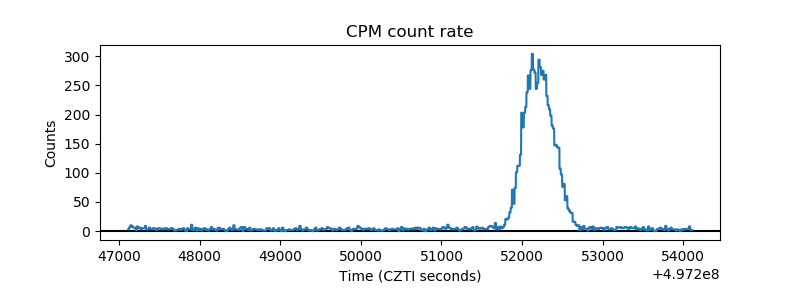 |
| CZT Counter | 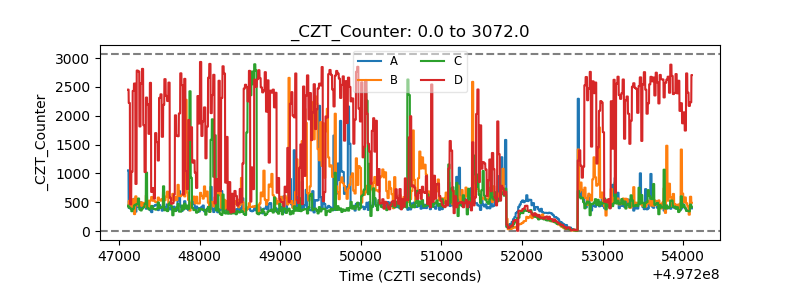 |
| +2.5 Volts monitor |  |
| +5 Volts monitor | 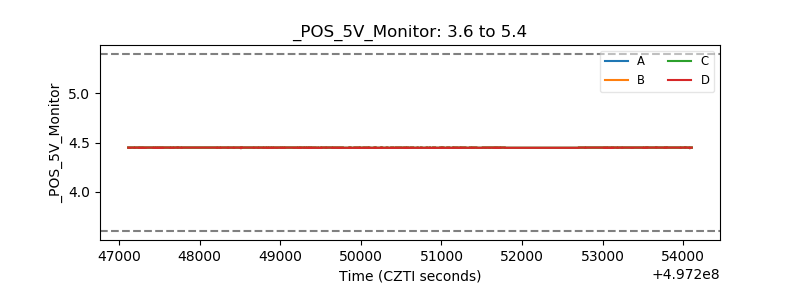 |
| _ROLL_ROT | 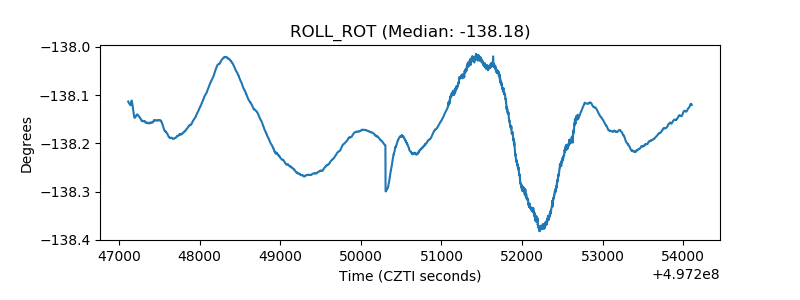 |
| _Roll_DEC | 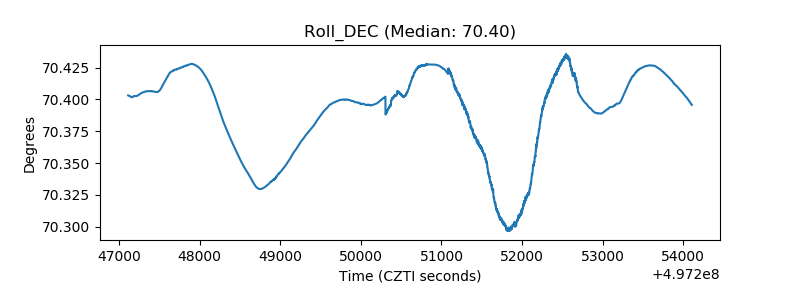 |
| _Roll_RA | 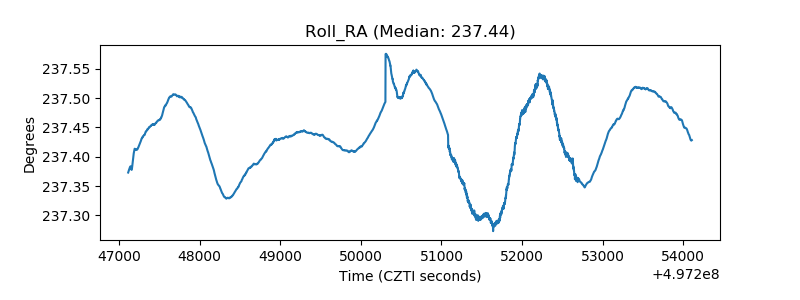 |
| Veto Counter | 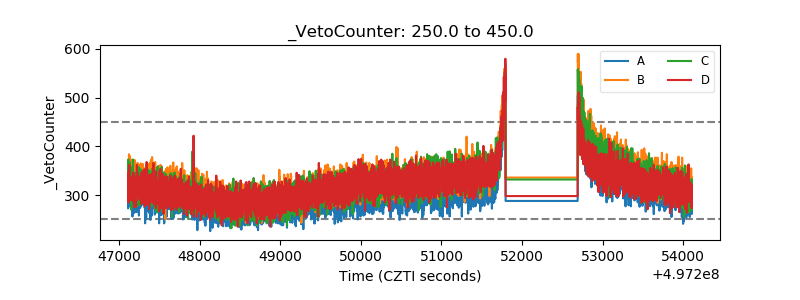 |