| Param | Original file | Final file |
|---|---|---|
| Filename | modeM0/AS1C09_004T08_9000006514_54194cztM0_level2.fits | modeM0/AS1C09_004T08_9000006514_54194cztM0_level2_quad_clean.evt |
| Size (bytes) | 576,961,920 | 84,355,200 |
| Size | 550.2 MB | 80.4 MB |
| Events in quadrant A | 3,050,834 | 616,858 |
| Events in quadrant B | 3,842,071 | 649,636 |
| Events in quadrant C | 2,832,030 | 581,752 |
| Events in quadrant D | 11,134,665 | 259,957 |
| Mode M0 | |||
|---|---|---|---|
| Quadrant | BADHDUFLAG | Total packets | Discarded packets |
| A | 0 | 13758 | 1 |
| B | 0 | 15547 | 1 |
| C | 0 | 13344 | 1 |
| D | 0 | 37420 | 1 |
| Mode M9 | |||
|---|---|---|---|
| Quadrant | BADHDUFLAG | Total packets | Discarded packets |
| A | 0 | 10 | 0 |
| B | 0 | 10 | 0 |
| C | 0 | 10 | 0 |
| D | 0 | 10 | 0 |
| Mode SS | |||
|---|---|---|---|
| Quadrant | BADHDUFLAG | Total packets | Discarded packets |
| A | 0 | 130 | 0 |
| B | 0 | 130 | 0 |
| C | 0 | 130 | 0 |
| D | 0 | 130 | 0 |
| Quadrant | Total seconds | Saturated seconds | Saturation percentage |
|---|---|---|---|
| A | 6391 | 58 | 0.907526% |
| B | 6391 | 227 | 3.551870% |
| C | 6392 | 17 | 0.265957% |
| D | 6392 | 3636 | 56.883605% |
Noise dominated data is calculated using 1-second bins in cleaned event files. If a bin has >2000 counts, and if more than 50% of those come from <1% of pixels, then it is considered to be noise-dominated and hence unusable.
| Quadrant | # 1 sec bins | Bins with >0 counts | Bins with >2000 counts | High rate bins dominated by noise | Noise dominated (total time) | Noise dominated (detector-on time) | Marked lightcurve |
|---|---|---|---|---|---|---|---|
| A | 7381 | 6391 | 19 | 19 | 0.26% | 0.30% | 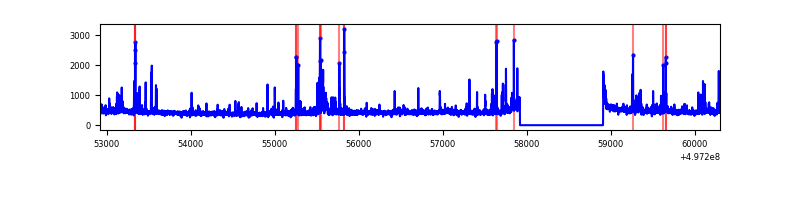 |
| B | 7381 | 6391 | 130 | 130 | 1.76% | 2.03% | 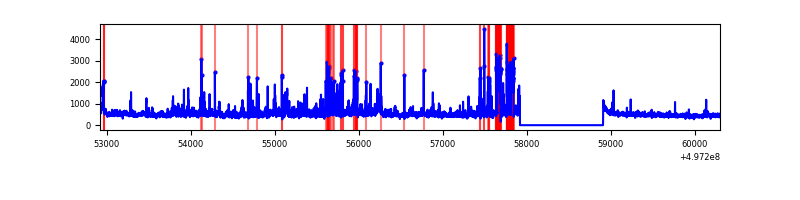 |
| C | 7382 | 6393 | 7 | 7 | 0.09% | 0.11% | 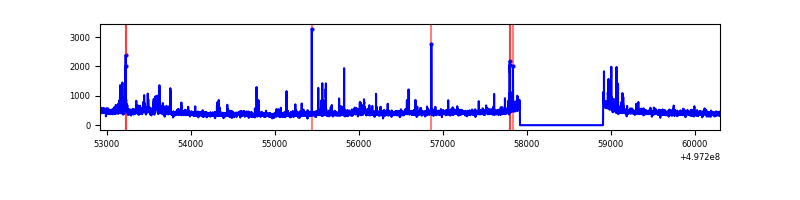 |
| D | 7381 | 6392 | 3318 | 3318 | 44.95% | 51.91% | 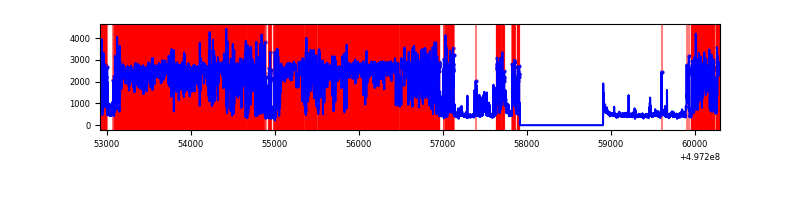 |
Top three noisy pixels from each quadrant. If the there are fewer than three noisy pixels in the level2.evt file, extra rows are filled as -1
| Pixel properties | Quadrant properties | ||||||
|---|---|---|---|---|---|---|---|
| Quadrant | DetID | PixID | Counts | Sigma | Mean | Median | Sigma |
| A | 15 | 174 | 128416 | 763.96 | 678 | 662 | 167.2 |
| A | 8 | 246 | 66631 | 394.49 | 678 | 662 | 167.2 |
| A | 7 | 29 | 51708 | 305.25 | 678 | 662 | 167.2 |
| B | 0 | 213 | 383713 | 2705.25 | 661 | 638 | 141.6 |
| B | 15 | 20 | 278603 | 1962.97 | 661 | 638 | 141.6 |
| B | 5 | 236 | 256314 | 1805.57 | 661 | 638 | 141.6 |
| C | 15 | 215 | 43777 | 239.69 | 649 | 642 | 180.0 |
| C | 0 | 193 | 41023 | 224.39 | 649 | 642 | 180.0 |
| C | 12 | 252 | 39984 | 218.62 | 649 | 642 | 180.0 |
| D | 8 | 176 | 9256394 | 81161.68 | 402 | 386 | 114.0 |
| D | 3 | 12 | 189978 | 1662.45 | 402 | 386 | 114.0 |
| D | 3 | 144 | 62808 | 547.35 | 402 | 386 | 114.0 |
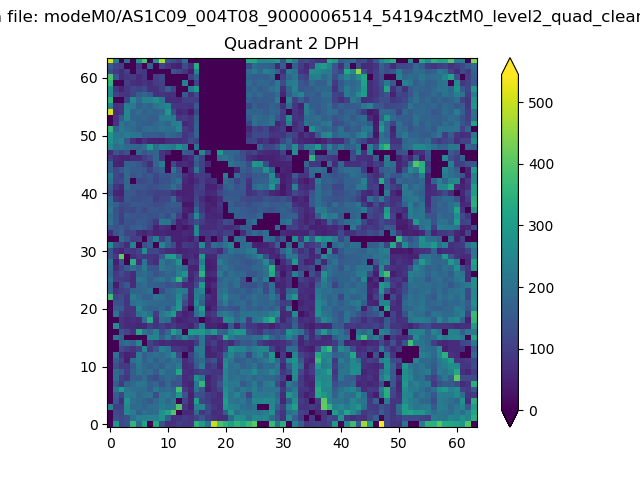
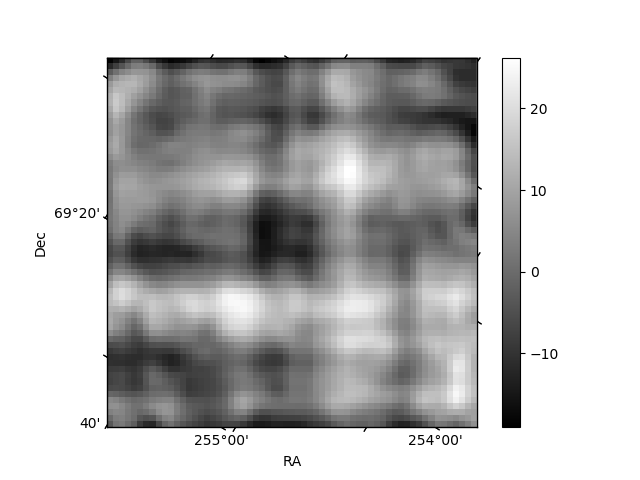
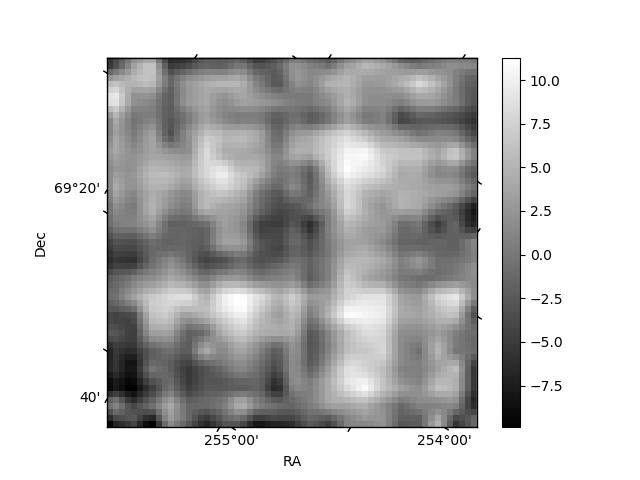
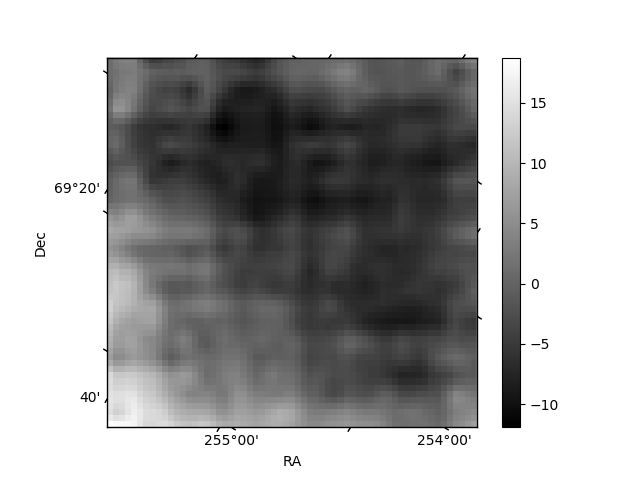
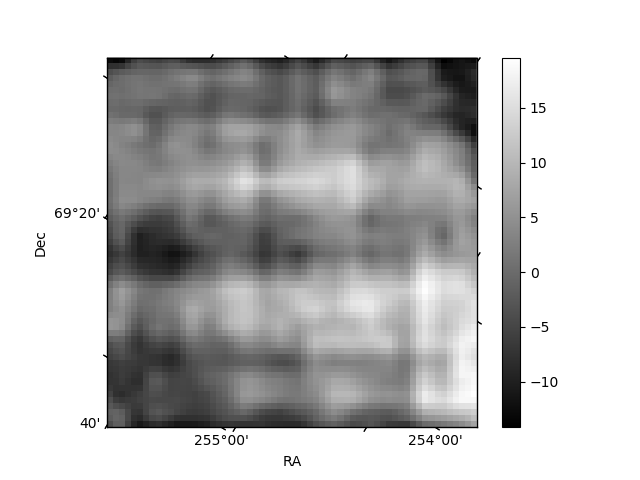
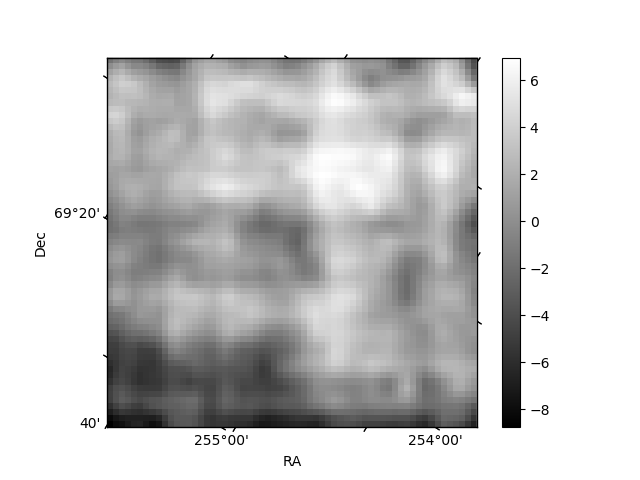
Histogram calculated using DETX and DETY for each event in the final _common_clean file
| Quadrant A | 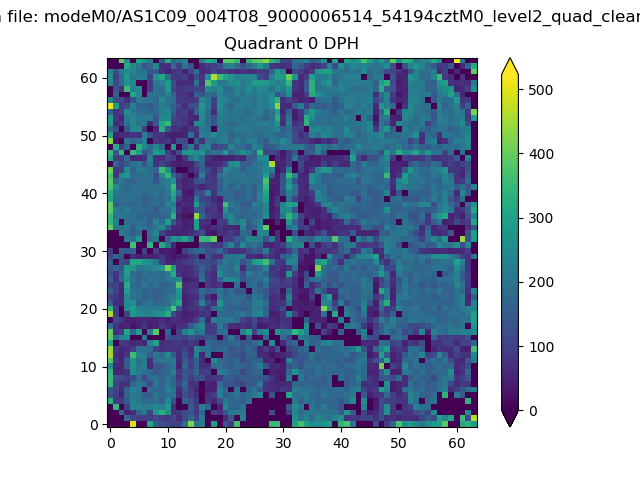 |
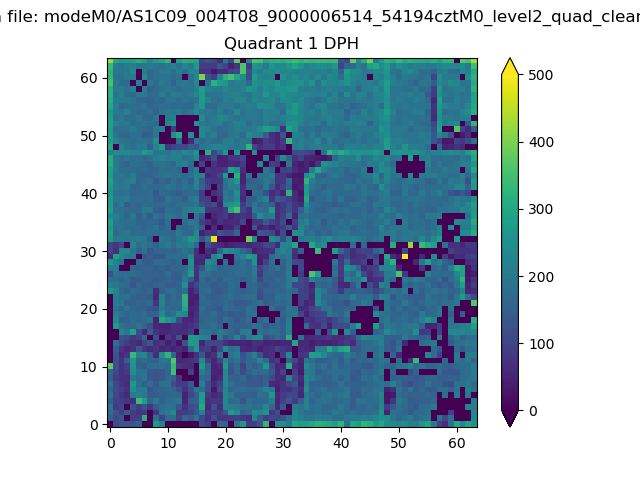 |
Quadrant B |
|---|---|---|---|
| Quadrant D | 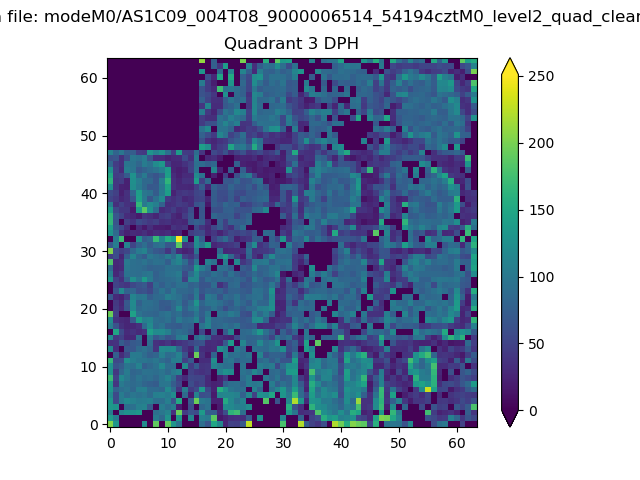 |
 |
Quadrant C |
| Plot type | Count rate plots | Images |
|---|---|---|
| Comparison with Poisson distribution Blue bars denote a histogram of data divided into 1 sec bins. Red curve is a Poisson curve with rate = median count rate of data. |
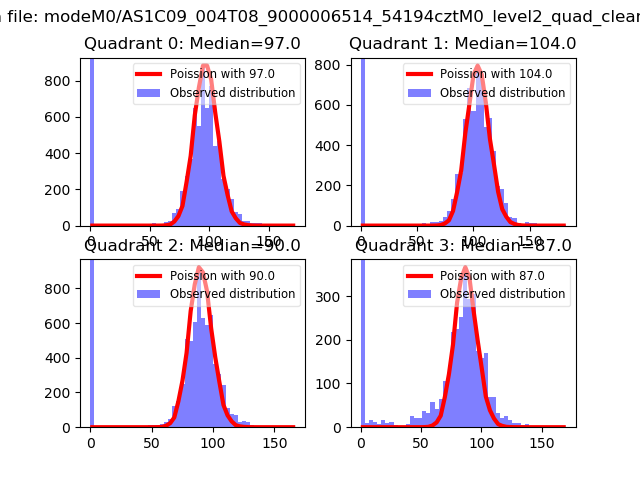 |
 |
| Quadrant-wise count rates Data is divided into 100 sec bins |
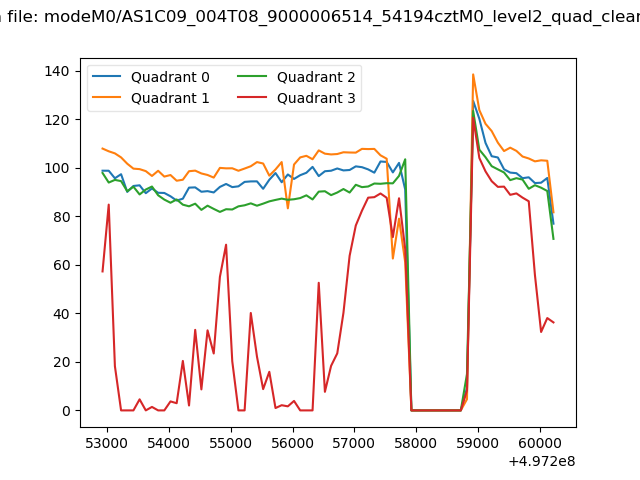 |
|
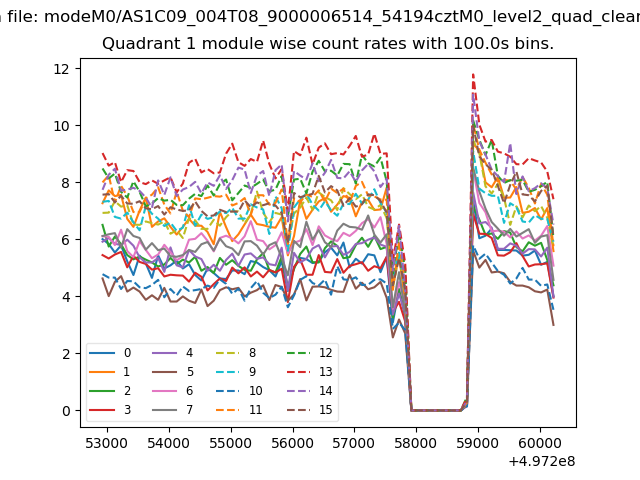
| Module-wise count rates for Quadrant A Data is divided into 100 sec bins |
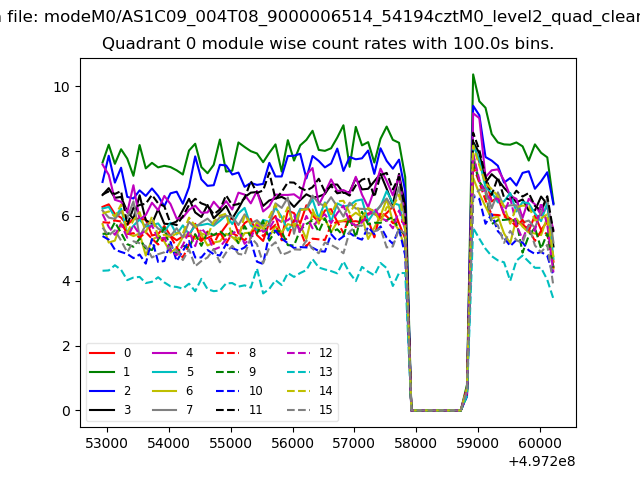 |
 |
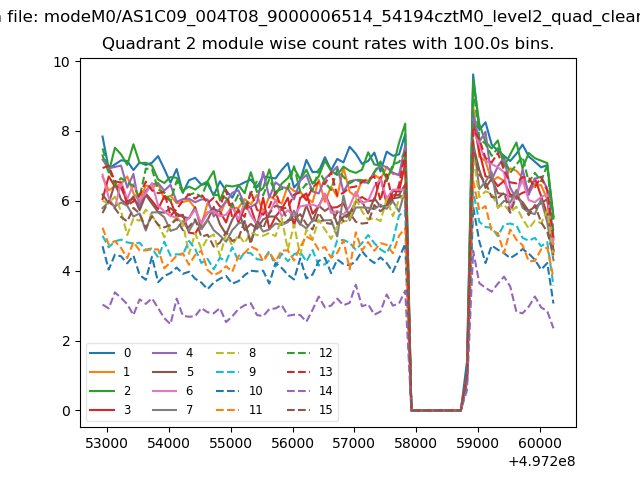
| Module-wise count rates for Quadrant B Data is divided into 100 sec bins |
 |
 |
| Module-wise count rates for Quadrant C Data is divided into 100 sec bins |
 |
 |
| Module-wise count rates for Quadrant D Data is divided into 100 sec bins |
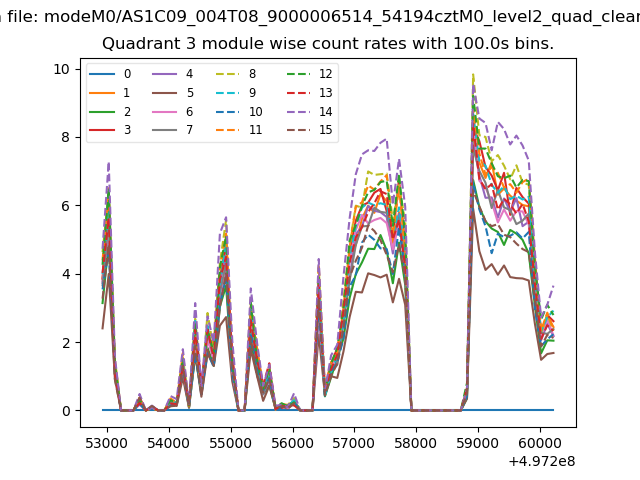 |
 |
| Parameter | Plot |
|---|---|
| CZT HV Monitor | 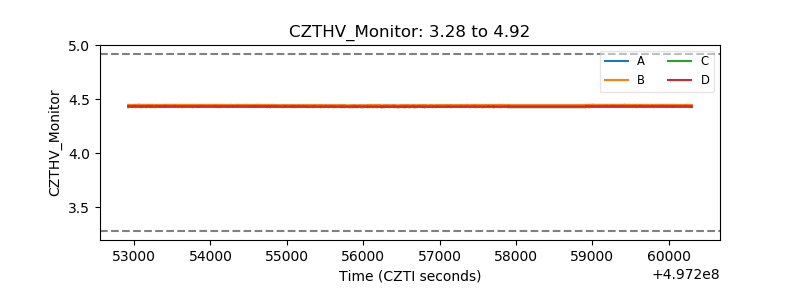 |
| D_VDD | 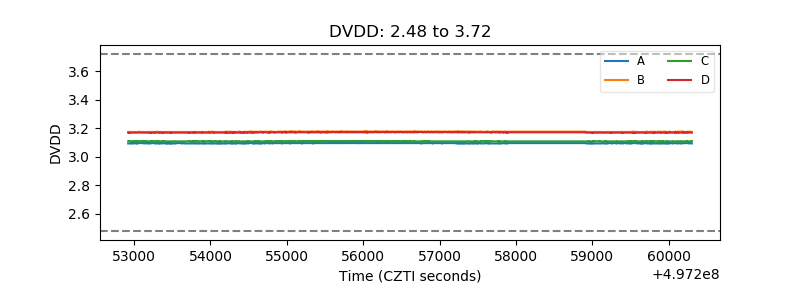 |
| Temperature 1 | 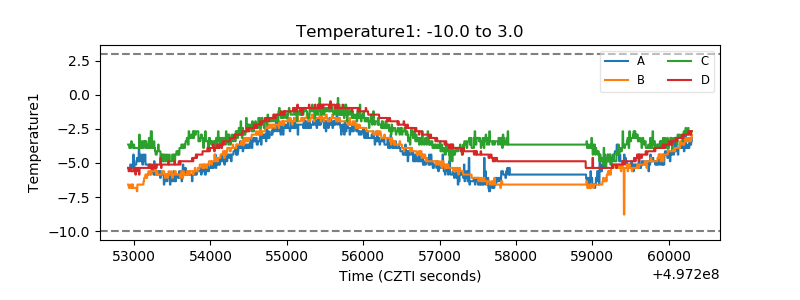 |
| Veto HV Monitor |  |
| Veto LLD | 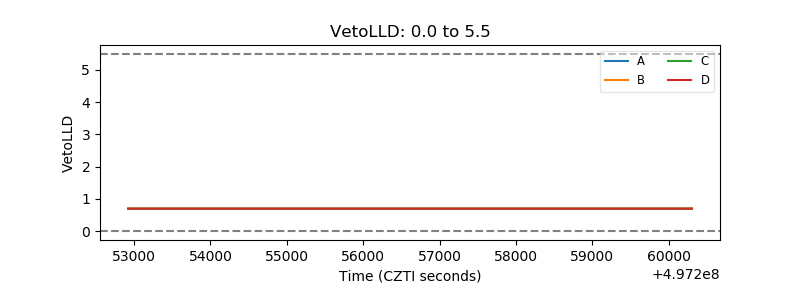 |
| Alpha Counter | 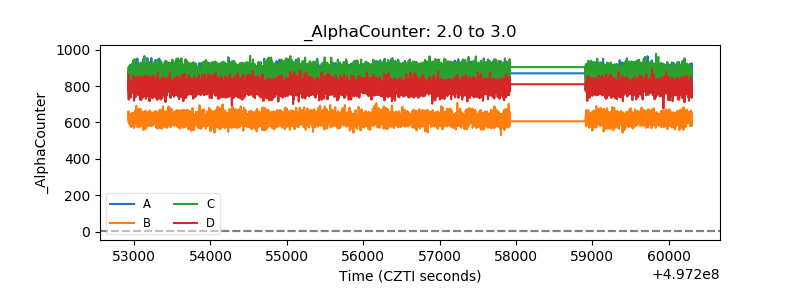 |
| _CPM_Rate | 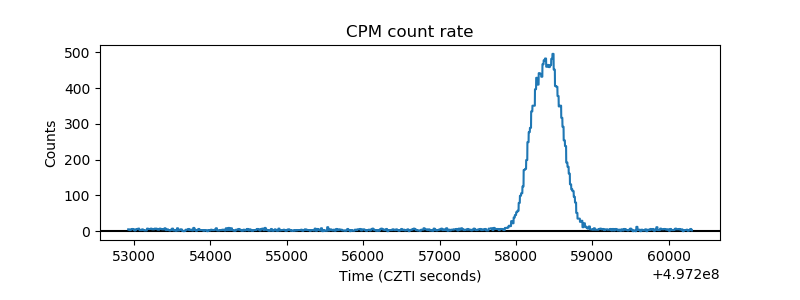 |
| CZT Counter | 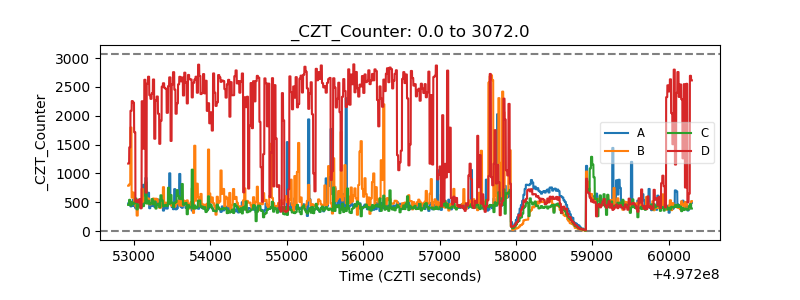 |
| +2.5 Volts monitor |  |
| +5 Volts monitor | 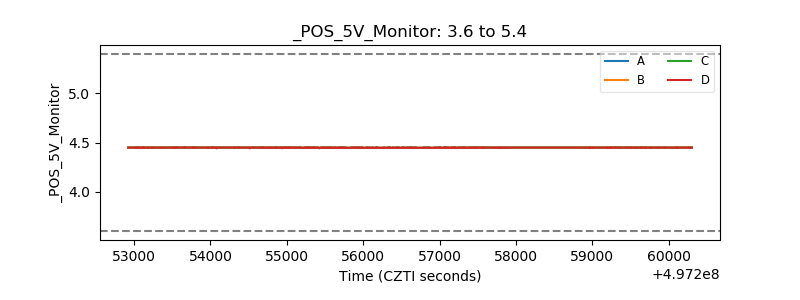 |
| _ROLL_ROT | 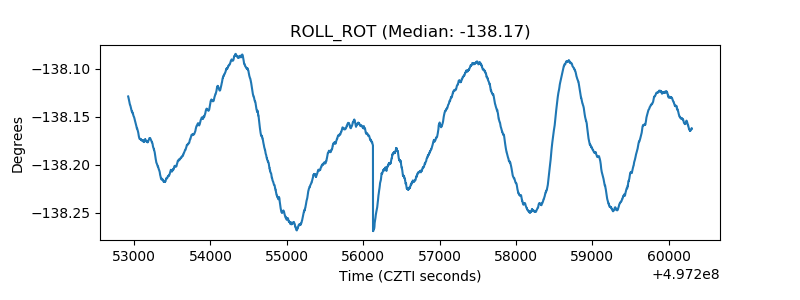 |
| _Roll_DEC | 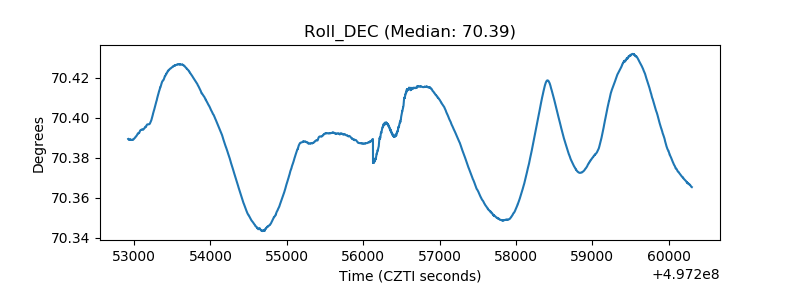 |
| _Roll_RA | 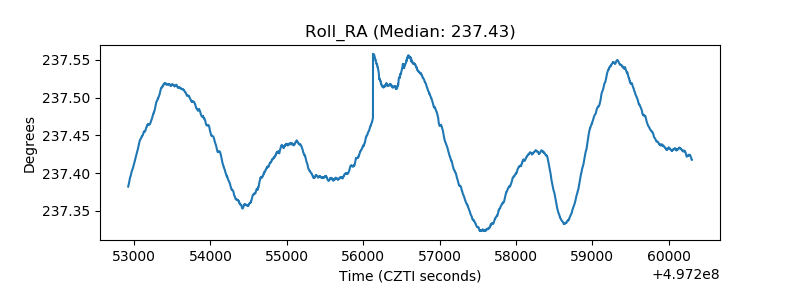 |
| Veto Counter | 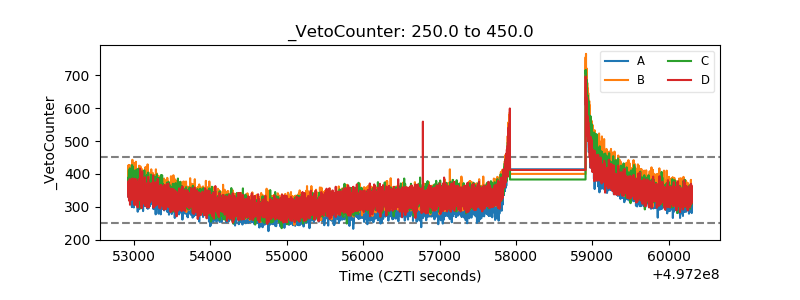 |