| Param | Original file | Final file |
|---|---|---|
| Filename | modeM0/AS1C09_004T08_9000006514_54195cztM0_level2.fits | modeM0/AS1C09_004T08_9000006514_54195cztM0_level2_quad_clean.evt |
| Size (bytes) | 501,295,680 | 85,763,520 |
| Size | 478.1 MB | 81.8 MB |
| Events in quadrant A | 3,134,102 | 593,397 |
| Events in quadrant B | 3,342,913 | 646,276 |
| Events in quadrant C | 2,888,790 | 554,777 |
| Events in quadrant D | 8,718,501 | 378,662 |
| Mode M0 | |||
|---|---|---|---|
| Quadrant | BADHDUFLAG | Total packets | Discarded packets |
| A | 0 | 13458 | 1 |
| B | 0 | 13927 | 1 |
| C | 0 | 13252 | 1 |
| D | 0 | 30172 | 1 |
| Mode M9 | |||
|---|---|---|---|
| Quadrant | BADHDUFLAG | Total packets | Discarded packets |
| A | 0 | 11 | 0 |
| B | 0 | 11 | 0 |
| C | 0 | 11 | 0 |
| D | 0 | 11 | 0 |
| Mode SS | |||
|---|---|---|---|
| Quadrant | BADHDUFLAG | Total packets | Discarded packets |
| A | 0 | 122 | 0 |
| B | 0 | 122 | 0 |
| C | 0 | 122 | 0 |
| D | 0 | 122 | 0 |
| Quadrant | Total seconds | Saturated seconds | Saturation percentage |
|---|---|---|---|
| A | 6073 | 97 | 1.597234% |
| B | 6074 | 96 | 1.580507% |
| C | 6074 | 77 | 1.267698% |
| D | 6074 | 1926 | 31.708923% |
Noise dominated data is calculated using 1-second bins in cleaned event files. If a bin has >2000 counts, and if more than 50% of those come from <1% of pixels, then it is considered to be noise-dominated and hence unusable.
| Quadrant | # 1 sec bins | Bins with >0 counts | Bins with >2000 counts | High rate bins dominated by noise | Noise dominated (total time) | Noise dominated (detector-on time) | Marked lightcurve |
|---|---|---|---|---|---|---|---|
| A | 7163 | 6073 | 47 | 47 | 0.66% | 0.77% | 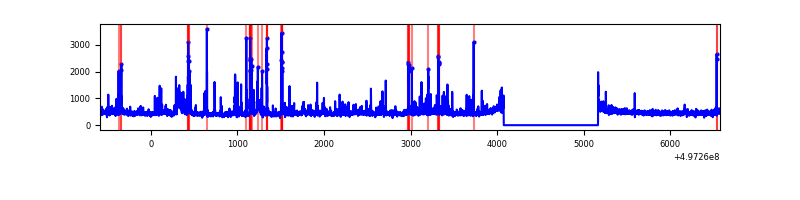 |
| B | 7164 | 6075 | 31 | 31 | 0.43% | 0.51% | 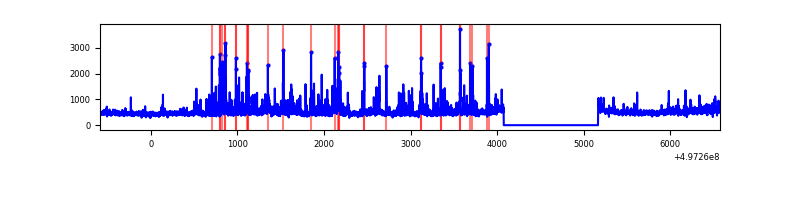 |
| C | 7164 | 6075 | 49 | 49 | 0.68% | 0.81% | 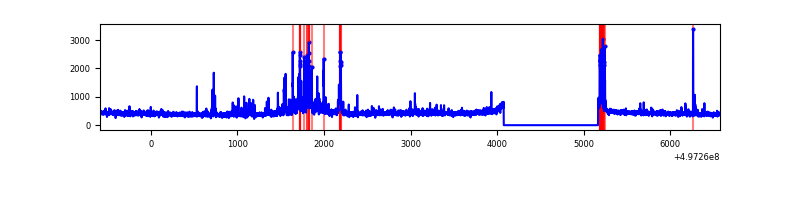 |
| D | 7164 | 6075 | 1955 | 1955 | 27.29% | 32.18% | 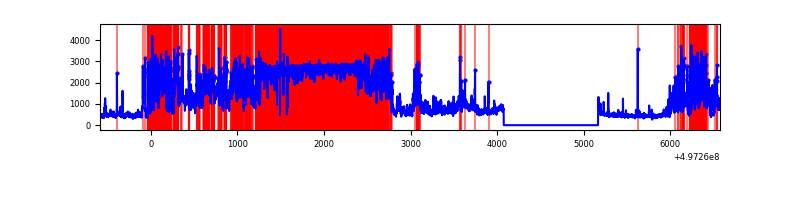 |
Top three noisy pixels from each quadrant. If the there are fewer than three noisy pixels in the level2.evt file, extra rows are filled as -1
| Pixel properties | Quadrant properties | ||||||
|---|---|---|---|---|---|---|---|
| Quadrant | DetID | PixID | Counts | Sigma | Mean | Median | Sigma |
| A | 15 | 174 | 306238 | 1913.89 | 647 | 630 | 159.7 |
| A | 11 | 3 | 92912 | 577.92 | 647 | 630 | 159.7 |
| A | 4 | 3 | 53544 | 331.38 | 647 | 630 | 159.7 |
| B | 15 | 20 | 273056 | 2022.68 | 638 | 619 | 134.7 |
| B | 4 | 171 | 195120 | 1444.06 | 638 | 619 | 134.7 |
| B | 0 | 213 | 73742 | 542.9 | 638 | 619 | 134.7 |
| C | 15 | 215 | 270145 | 1593.01 | 615 | 609 | 169.2 |
| C | 14 | 254 | 53851 | 314.67 | 615 | 609 | 169.2 |
| C | 15 | 216 | 48398 | 282.44 | 615 | 609 | 169.2 |
| D | 8 | 176 | 6234369 | 42840.51 | 512 | 488 | 145.5 |
| D | 2 | 172 | 194253 | 1331.59 | 512 | 488 | 145.5 |
| D | 3 | 12 | 122744 | 840.17 | 512 | 488 | 145.5 |
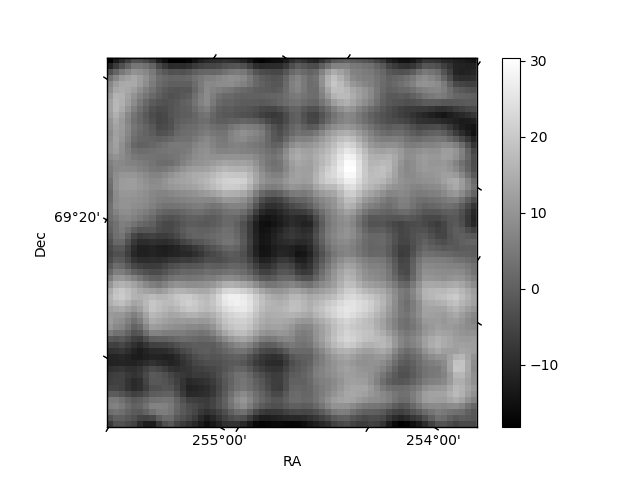
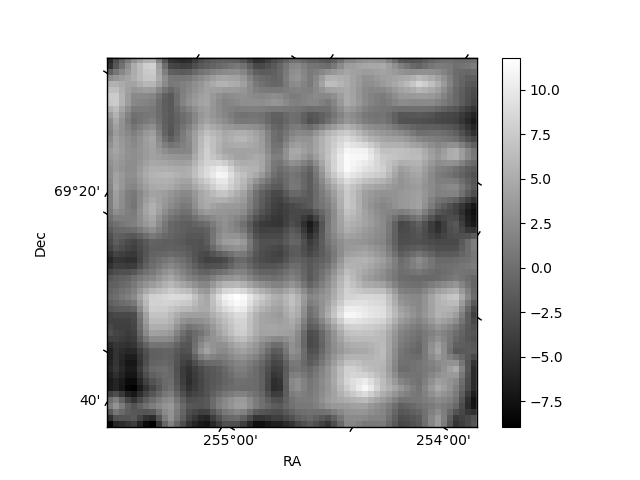
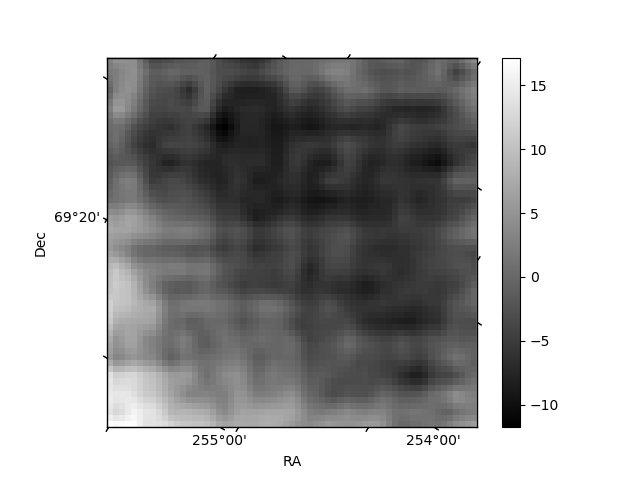
Histogram calculated using DETX and DETY for each event in the final _common_clean file
| Quadrant A | 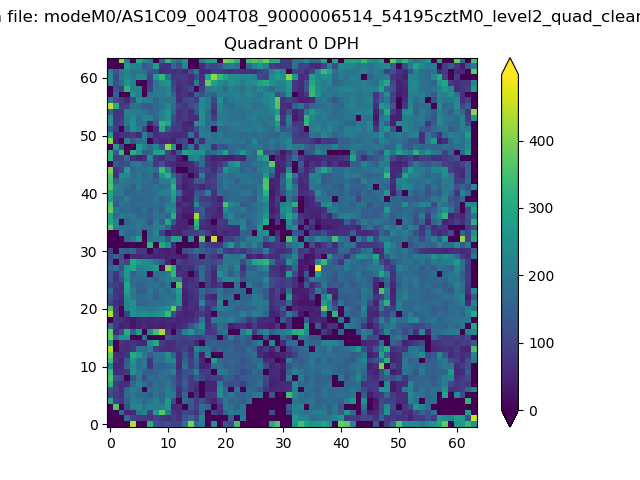 |
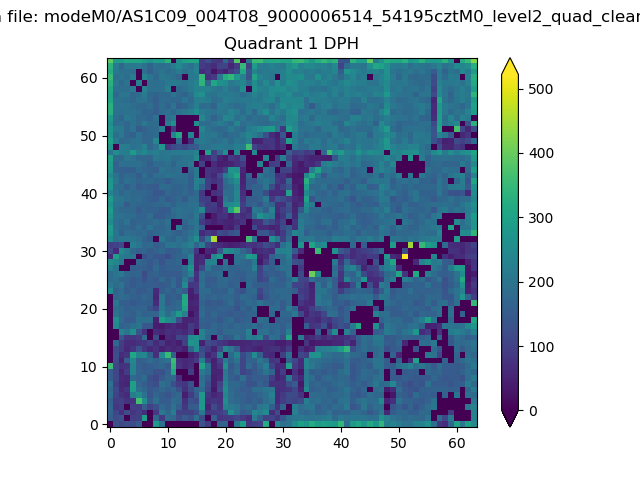 |
Quadrant B |
|---|---|---|---|
| Quadrant D | 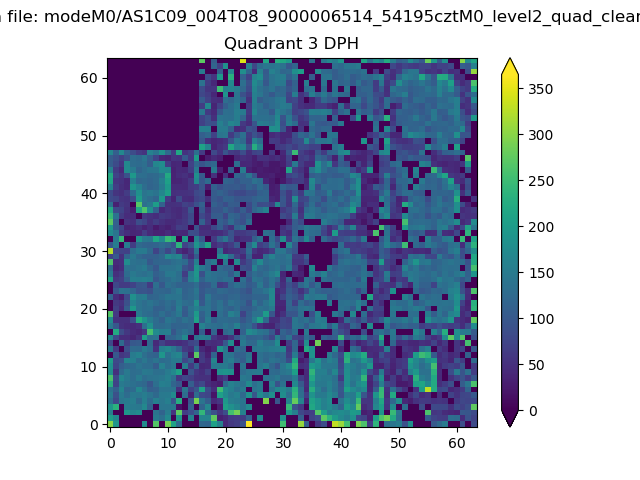 |
 |
Quadrant C |
| Plot type | Count rate plots | Images |
|---|---|---|
| Comparison with Poisson distribution Blue bars denote a histogram of data divided into 1 sec bins. Red curve is a Poisson curve with rate = median count rate of data. |
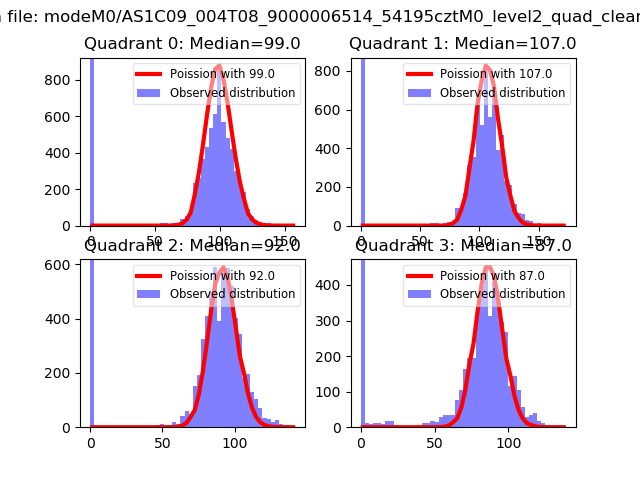 |
 |
| Quadrant-wise count rates Data is divided into 100 sec bins |
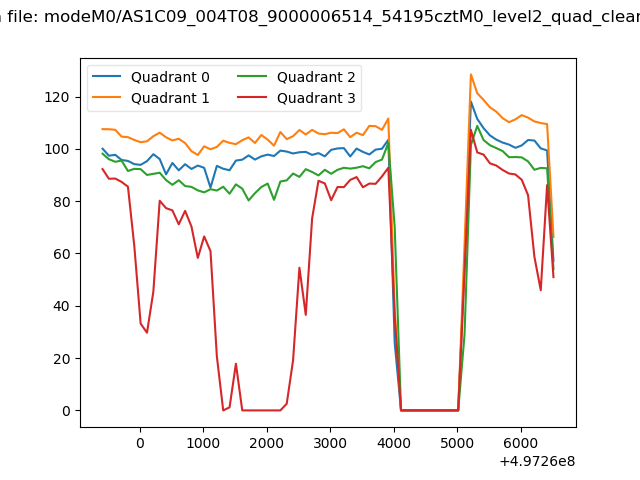 |
|
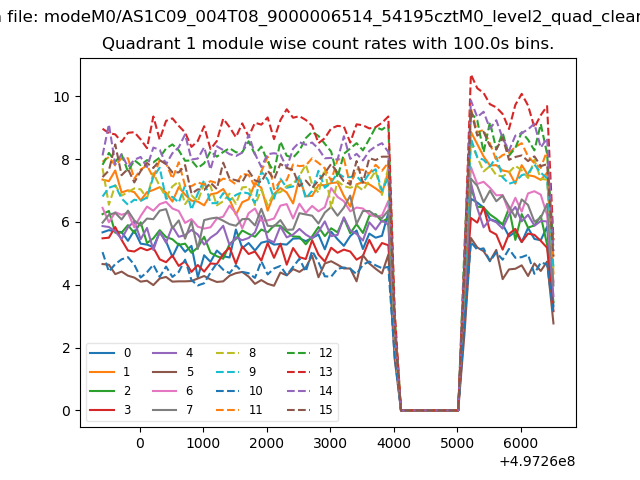
| Module-wise count rates for Quadrant A Data is divided into 100 sec bins |
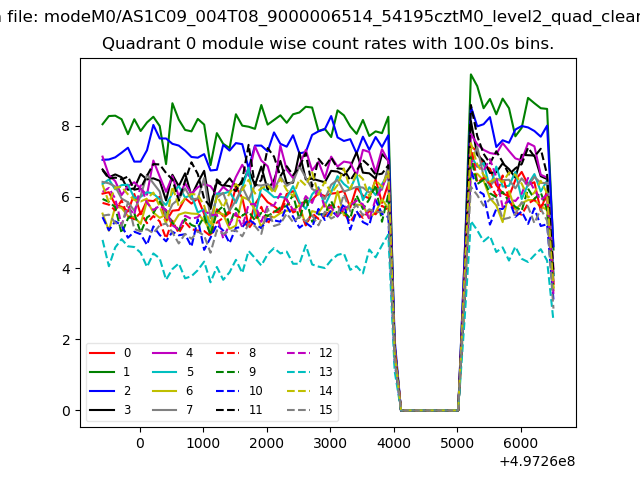 |
 |
| Module-wise count rates for Quadrant B Data is divided into 100 sec bins |
 |
 |
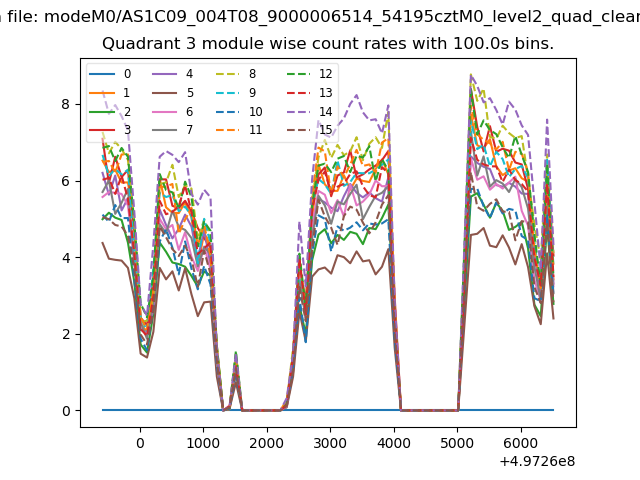
| Module-wise count rates for Quadrant C Data is divided into 100 sec bins |
 |
 |
| Module-wise count rates for Quadrant D Data is divided into 100 sec bins |
 |
 |
| Parameter | Plot |
|---|---|
| CZT HV Monitor | 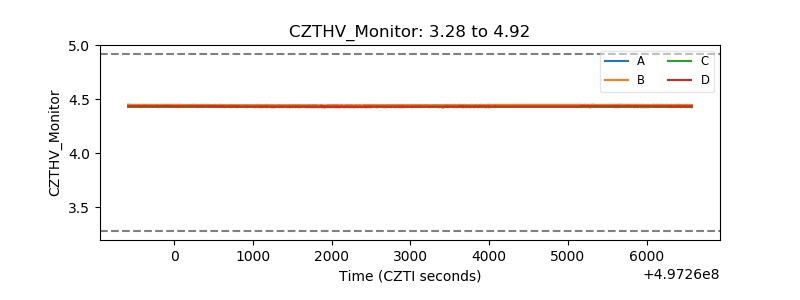 |
| D_VDD | 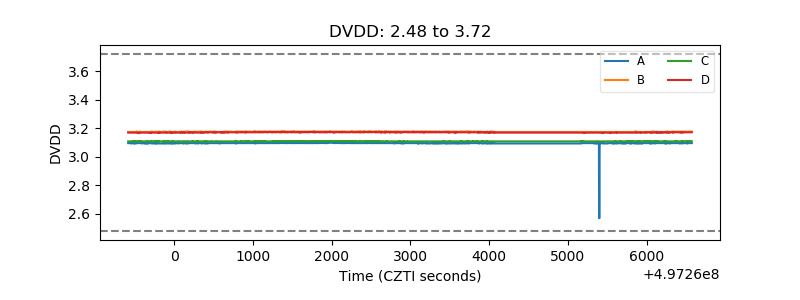 |
| Temperature 1 | 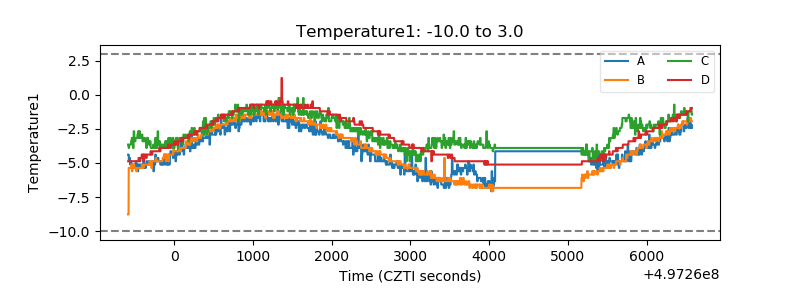 |
| Veto HV Monitor | 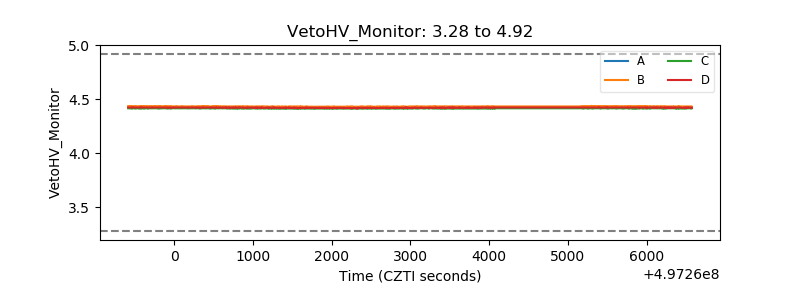 |
| Veto LLD | 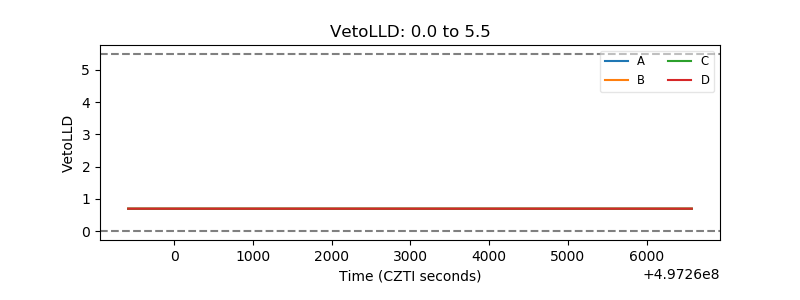 |
| Alpha Counter | 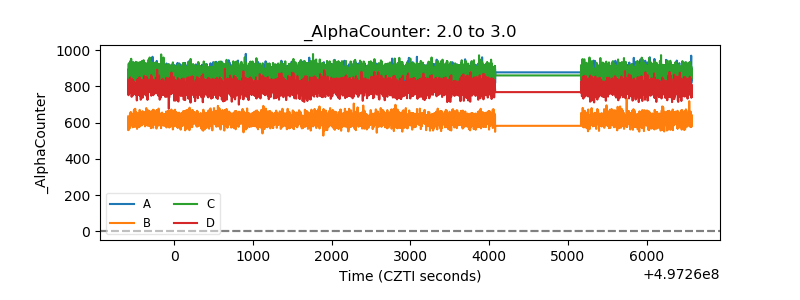 |
| _CPM_Rate | 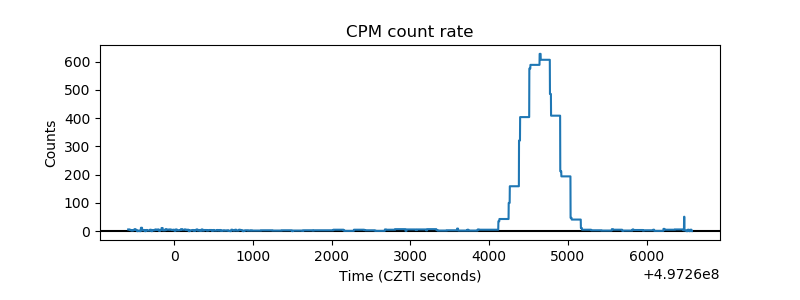 |
| CZT Counter | 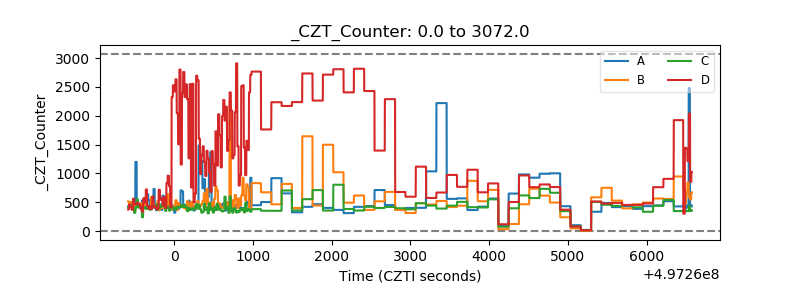 |
| +2.5 Volts monitor |  |
| +5 Volts monitor |  |
| _ROLL_ROT | 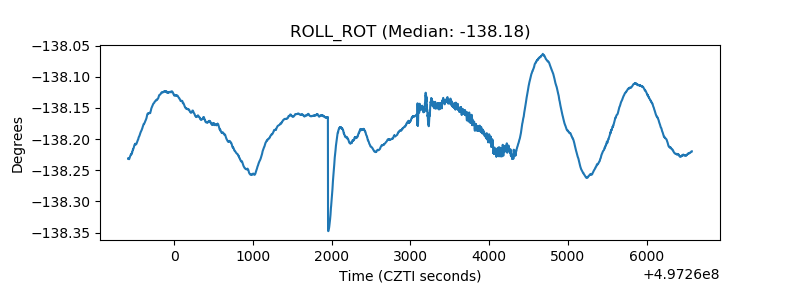 |
| _Roll_DEC | 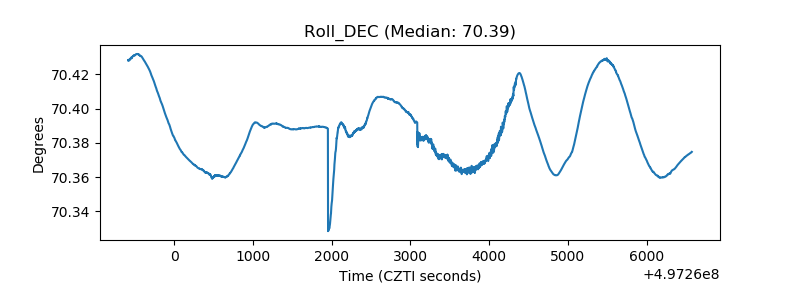 |
| _Roll_RA | 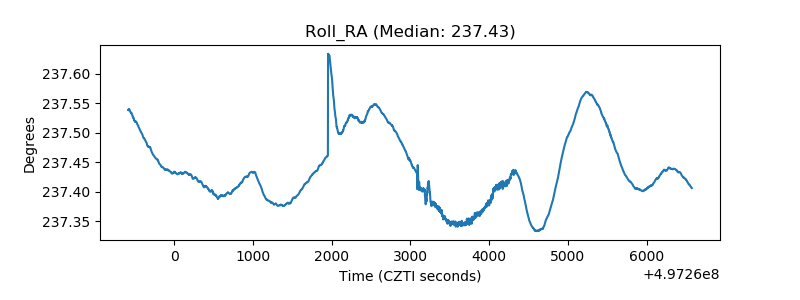 |
| Veto Counter | 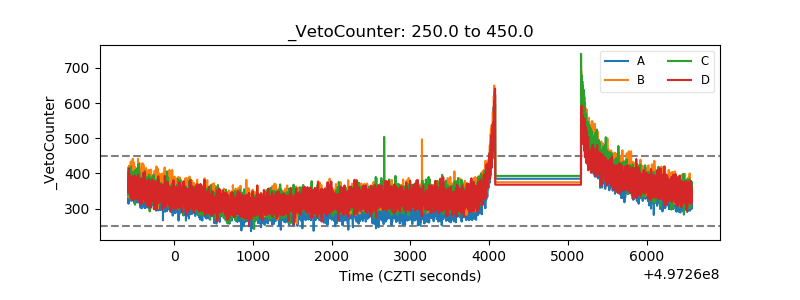 |