| Param | Original file | Final file |
|---|---|---|
| Filename | modeM0/AS1C09_004T08_9000006514_54200cztM0_level2.fits | modeM0/AS1C09_004T08_9000006514_54200cztM0_level2_quad_clean.evt |
| Size (bytes) | 590,169,600 | 93,032,640 |
| Size | 562.8 MB | 88.7 MB |
| Events in quadrant A | 3,674,089 | 652,891 |
| Events in quadrant B | 4,071,616 | 702,786 |
| Events in quadrant C | 6,359,970 | 498,936 |
| Events in quadrant D | 7,197,869 | 475,856 |
| Mode M0 | |||
|---|---|---|---|
| Quadrant | BADHDUFLAG | Total packets | Discarded packets |
| A | 0 | 16142 | 1 |
| B | 0 | 16886 | 1 |
| C | 0 | 24164 | 1 |
| D | 0 | 26474 | 8 |
| Mode M9 | |||
|---|---|---|---|
| Quadrant | BADHDUFLAG | Total packets | Discarded packets |
| A | 0 | 2 | 0 |
| B | 0 | 2 | 0 |
| C | 0 | 2 | 0 |
| D | 0 | 2 | 0 |
| Mode SS | |||
|---|---|---|---|
| Quadrant | BADHDUFLAG | Total packets | Discarded packets |
| A | 0 | 142 | 0 |
| B | 0 | 142 | 0 |
| C | 0 | 142 | 0 |
| D | 0 | 142 | 0 |
| Quadrant | Total seconds | Saturated seconds | Saturation percentage |
|---|---|---|---|
| A | 6981 | 225 | 3.223034% |
| B | 6981 | 251 | 3.595473% |
| C | 6982 | 1465 | 20.982526% |
| D | 6981 | 1512 | 21.658788% |
Noise dominated data is calculated using 1-second bins in cleaned event files. If a bin has >2000 counts, and if more than 50% of those come from <1% of pixels, then it is considered to be noise-dominated and hence unusable.
| Quadrant | # 1 sec bins | Bins with >0 counts | Bins with >2000 counts | High rate bins dominated by noise | Noise dominated (total time) | Noise dominated (detector-on time) | Marked lightcurve |
|---|---|---|---|---|---|---|---|
| A | 7181 | 6983 | 136 | 136 | 1.89% | 1.95% | 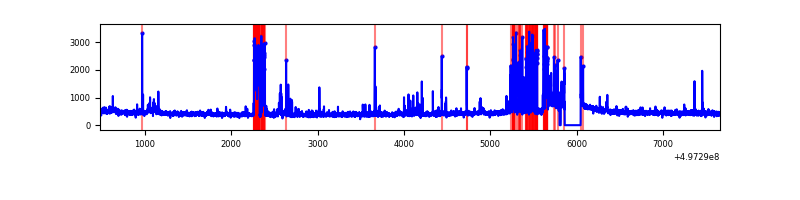 |
| B | 7181 | 6983 | 104 | 104 | 1.45% | 1.49% | 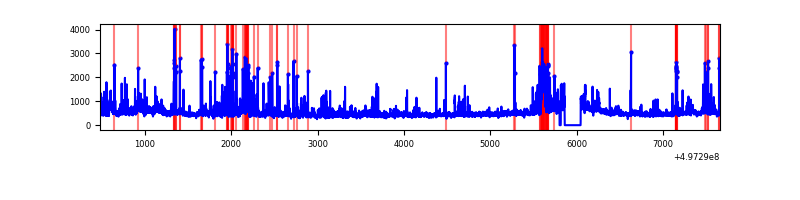 |
| C | 7182 | 6984 | 1368 | 1368 | 19.05% | 19.59% | 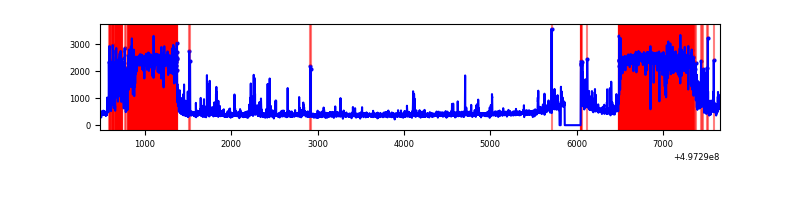 |
| D | 7180 | 6982 | 1394 | 1394 | 19.42% | 19.97% | 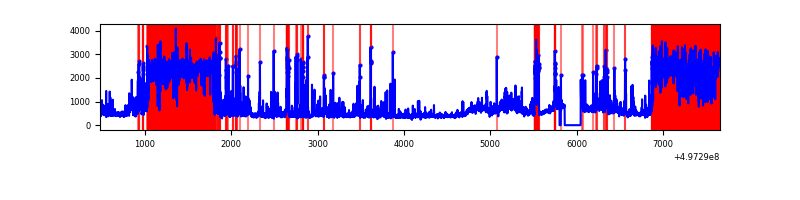 |
Top three noisy pixels from each quadrant. If the there are fewer than three noisy pixels in the level2.evt file, extra rows are filled as -1
| Pixel properties | Quadrant properties | ||||||
|---|---|---|---|---|---|---|---|
| Quadrant | DetID | PixID | Counts | Sigma | Mean | Median | Sigma |
| A | 15 | 174 | 345994 | 1913.55 | 733 | 715 | 180.4 |
| A | 5 | 241 | 300752 | 1662.81 | 733 | 715 | 180.4 |
| A | 4 | 3 | 46051 | 251.25 | 733 | 715 | 180.4 |
| B | 4 | 171 | 378833 | 2443.65 | 730 | 707 | 154.7 |
| B | 7 | 0 | 196819 | 1267.38 | 730 | 707 | 154.7 |
| B | 15 | 20 | 141727 | 911.35 | 730 | 707 | 154.7 |
| C | 15 | 215 | 2266120 | 12935.73 | 640 | 632 | 175.1 |
| C | 15 | 216 | 980851 | 5596.96 | 640 | 632 | 175.1 |
| C | 13 | 3 | 278982 | 1589.35 | 640 | 632 | 175.1 |
| D | 8 | 176 | 3538577 | 19749.87 | 636 | 606 | 179.1 |
| D | 3 | 12 | 619655 | 3455.69 | 636 | 606 | 179.1 |
| D | 2 | 172 | 128418 | 713.48 | 636 | 606 | 179.1 |
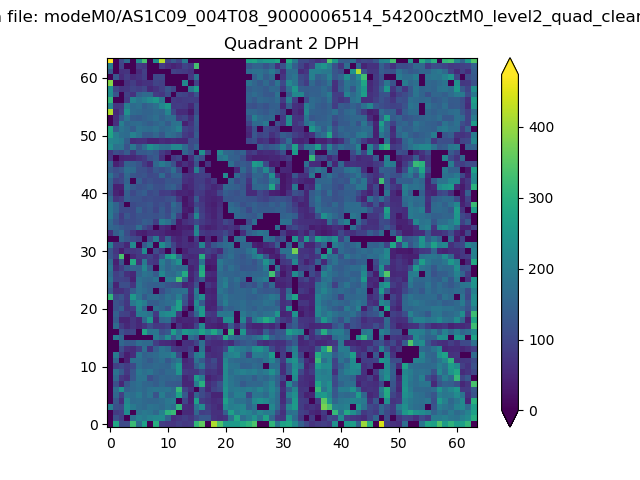
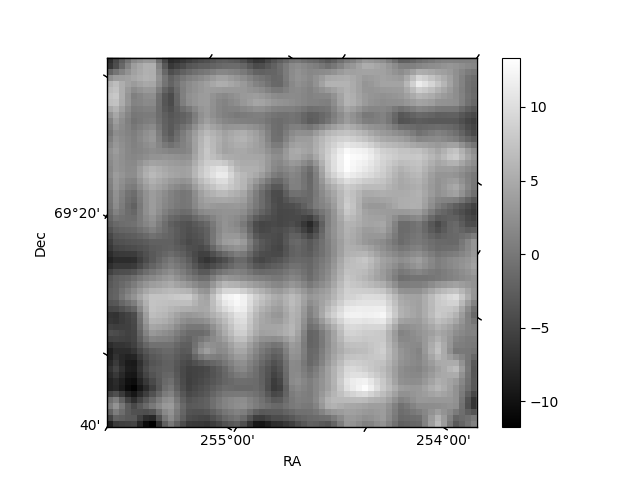
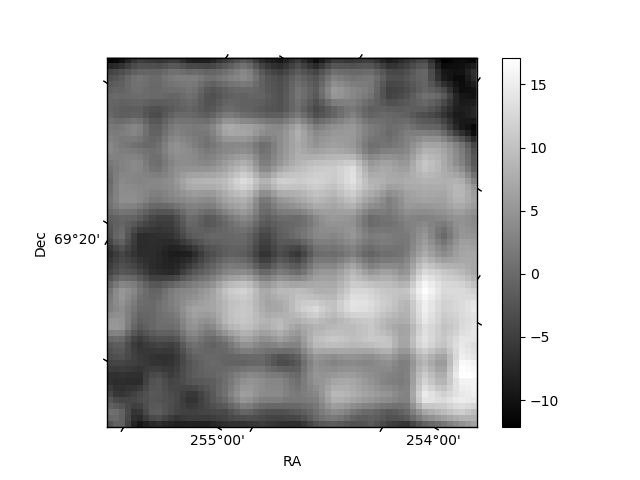
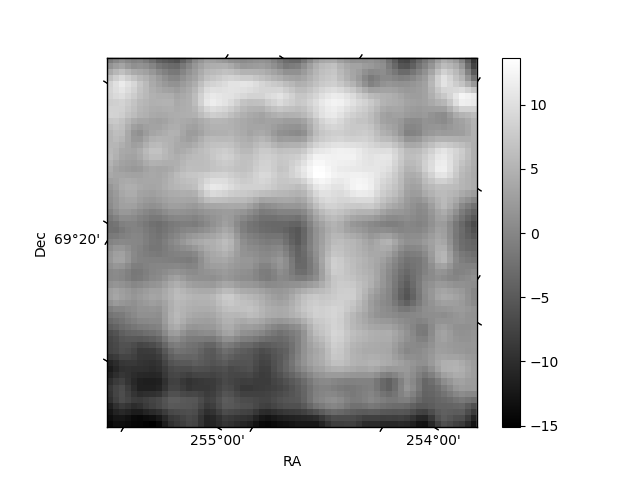
Histogram calculated using DETX and DETY for each event in the final _common_clean file
| Quadrant A |  |
 |
Quadrant B |
|---|---|---|---|
| Quadrant D | 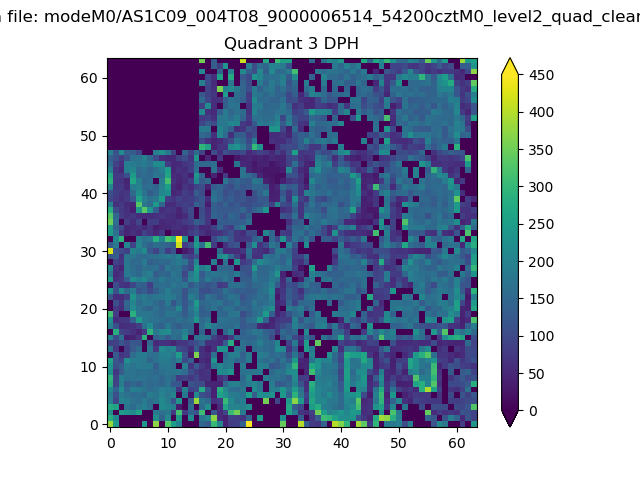 |
 |
Quadrant C |
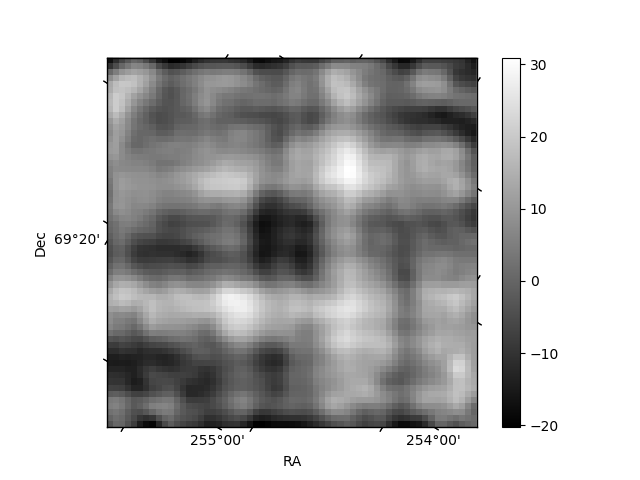
| Plot type | Count rate plots | Images |
|---|---|---|
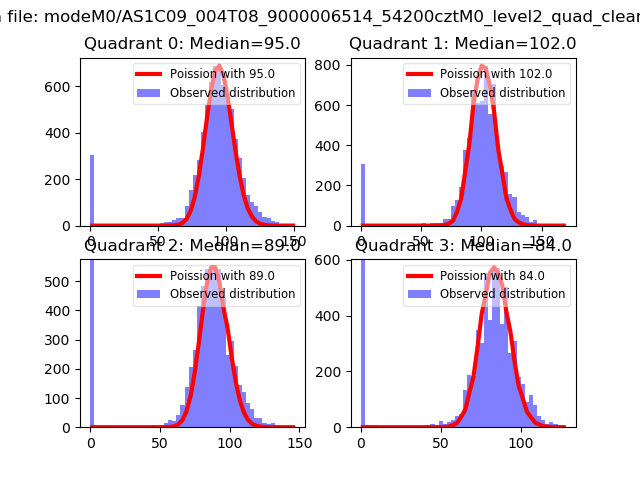
| Comparison with Poisson distribution Blue bars denote a histogram of data divided into 1 sec bins. Red curve is a Poisson curve with rate = median count rate of data. |
 |
 |
| Quadrant-wise count rates Data is divided into 100 sec bins |
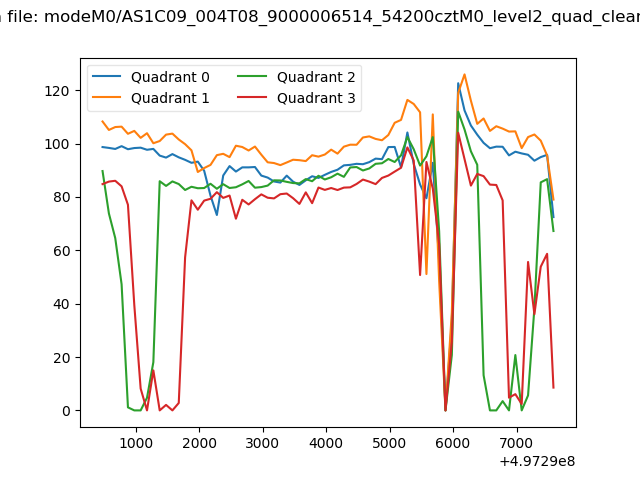 |
|
| Module-wise count rates for Quadrant A Data is divided into 100 sec bins |
 |
 |
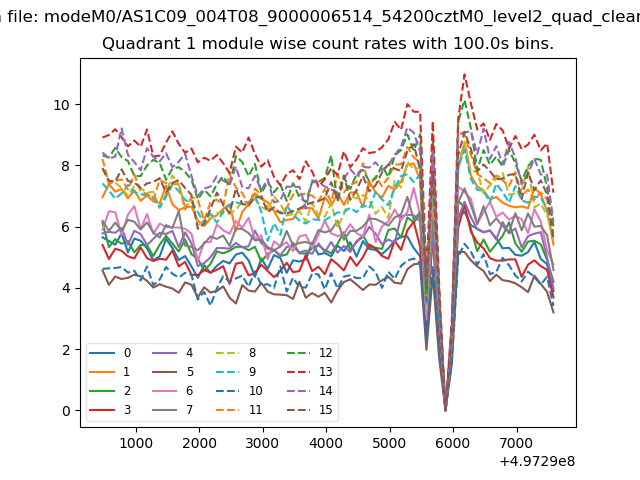
| Module-wise count rates for Quadrant B Data is divided into 100 sec bins |
 |
 |
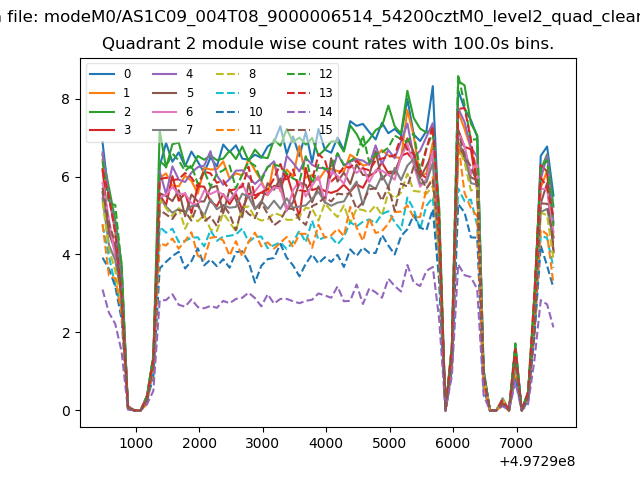
| Module-wise count rates for Quadrant C Data is divided into 100 sec bins |
 |
 |
| Module-wise count rates for Quadrant D Data is divided into 100 sec bins |
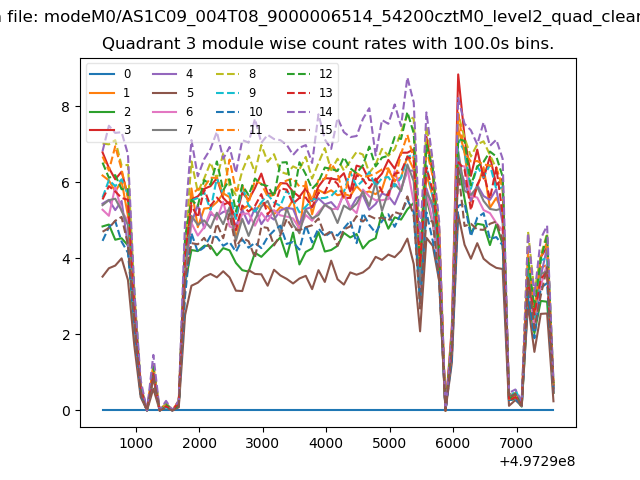 |
 |
| Parameter | Plot |
|---|---|
| CZT HV Monitor | 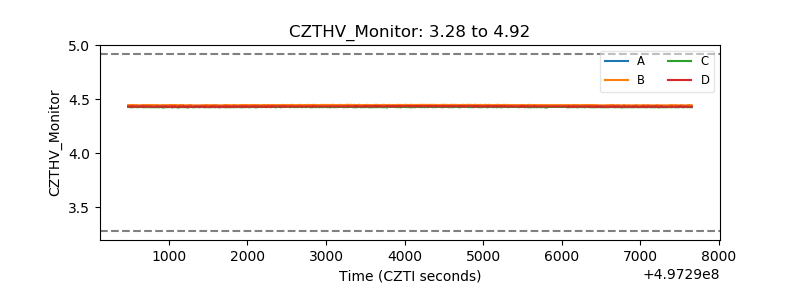 |
| D_VDD | 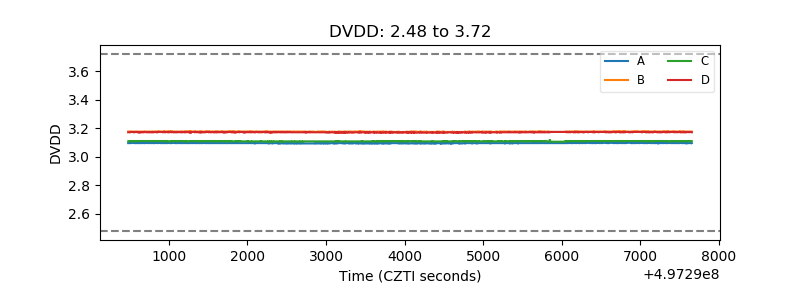 |
| Temperature 1 | 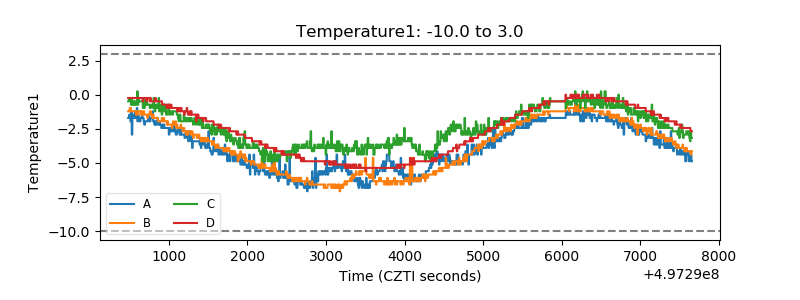 |
| Veto HV Monitor | 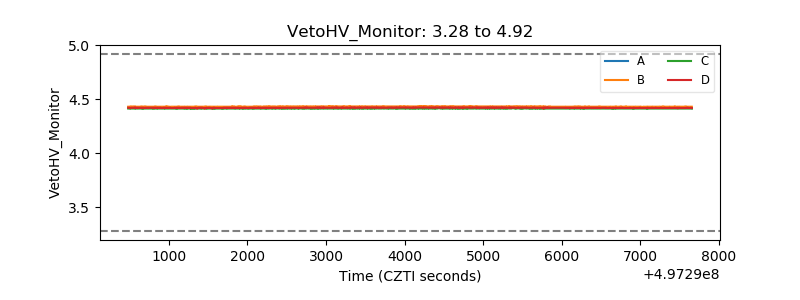 |
| Veto LLD | 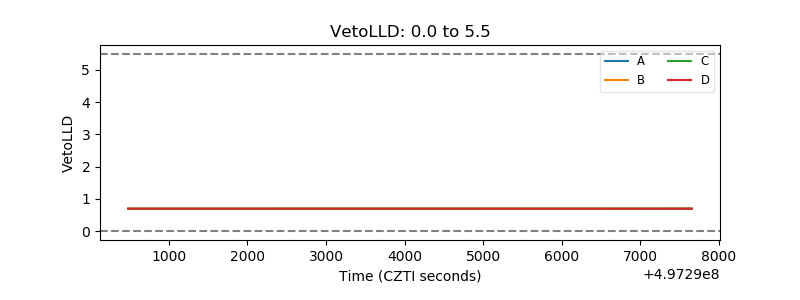 |
| Alpha Counter | 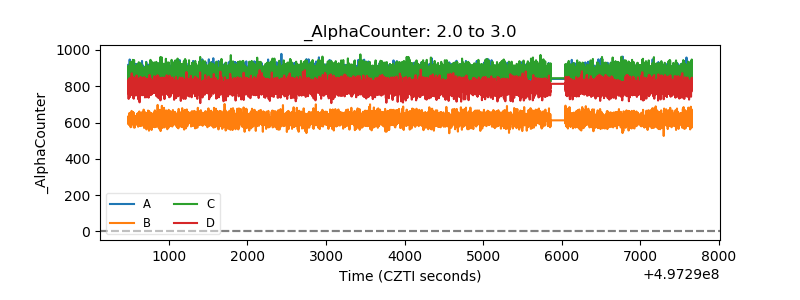 |
| _CPM_Rate | 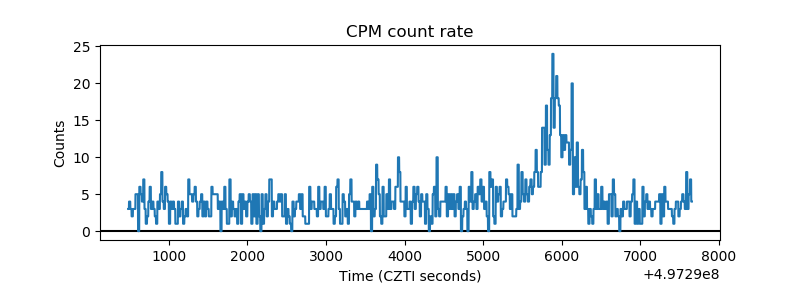 |
| CZT Counter | 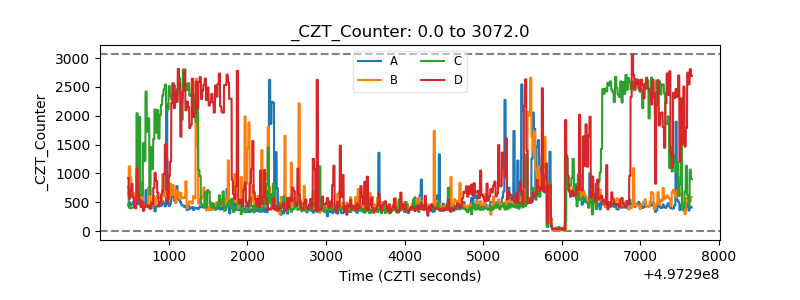 |
| +2.5 Volts monitor | 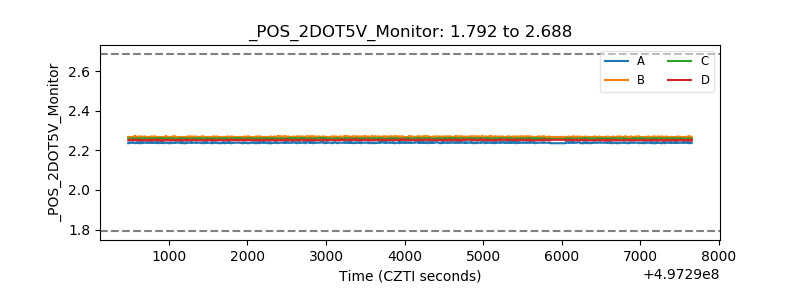 |
| +5 Volts monitor |  |
| _ROLL_ROT | 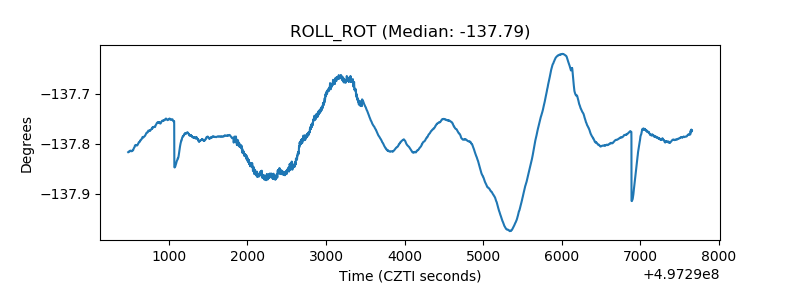 |
| _Roll_DEC | 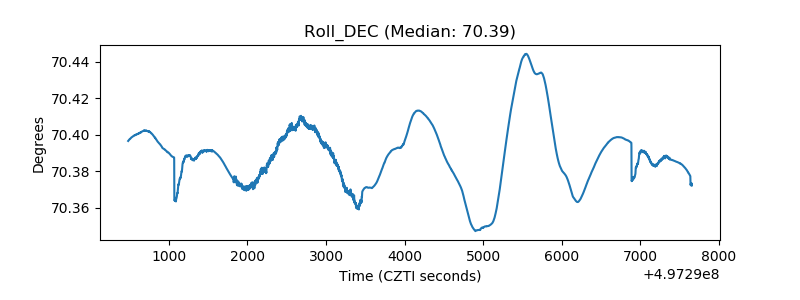 |
| _Roll_RA | 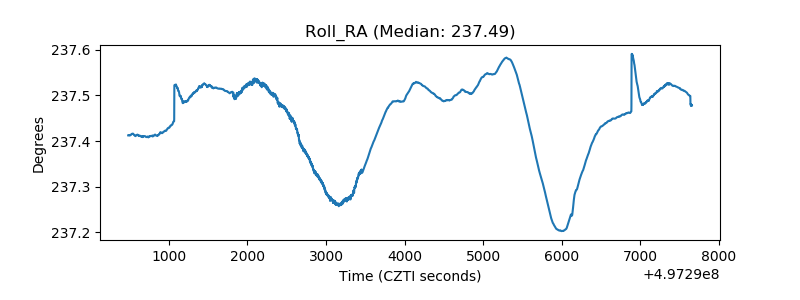 |
| Veto Counter | 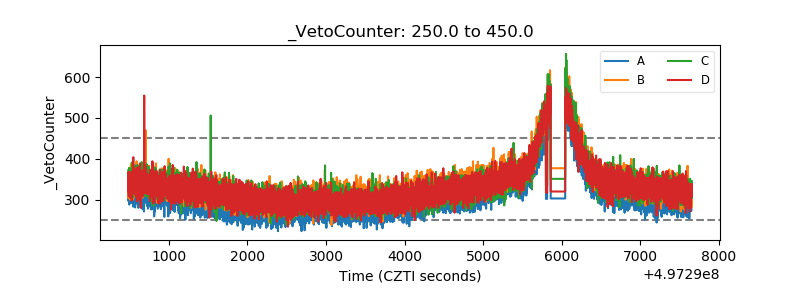 |