| Param | Original file | Final file |
|---|---|---|
| Filename | modeM0/AS1C09_004T08_9000006514_54201cztM0_level2.fits | modeM0/AS1C09_004T08_9000006514_54201cztM0_level2_quad_clean.evt |
| Size (bytes) | 611,000,640 | 104,584,320 |
| Size | 582.7 MB | 99.7 MB |
| Events in quadrant A | 3,868,189 | 718,487 |
| Events in quadrant B | 4,398,773 | 771,199 |
| Events in quadrant C | 6,213,629 | 590,514 |
| Events in quadrant D | 7,543,338 | 554,800 |
| Mode M0 | |||
|---|---|---|---|
| Quadrant | BADHDUFLAG | Total packets | Discarded packets |
| A | 0 | 17075 | 0 |
| B | 0 | 18460 | 0 |
| C | 0 | 24102 | 0 |
| D | 0 | 27772 | 0 |
| Mode SS | |||
|---|---|---|---|
| Quadrant | BADHDUFLAG | Total packets | Discarded packets |
| A | 0 | 152 | 0 |
| B | 0 | 152 | 0 |
| C | 0 | 152 | 0 |
| D | 0 | 152 | 0 |
| Quadrant | Total seconds | Saturated seconds | Saturation percentage |
|---|---|---|---|
| A | 7642 | 114 | 1.491756% |
| B | 7643 | 184 | 2.407432% |
| C | 7643 | 1036 | 13.554887% |
| D | 7643 | 1192 | 15.595970% |
Noise dominated data is calculated using 1-second bins in cleaned event files. If a bin has >2000 counts, and if more than 50% of those come from <1% of pixels, then it is considered to be noise-dominated and hence unusable.
| Quadrant | # 1 sec bins | Bins with >0 counts | Bins with >2000 counts | High rate bins dominated by noise | Noise dominated (total time) | Noise dominated (detector-on time) | Marked lightcurve |
|---|---|---|---|---|---|---|---|
| A | 7642 | 7642 | 91 | 91 | 1.19% | 1.19% | 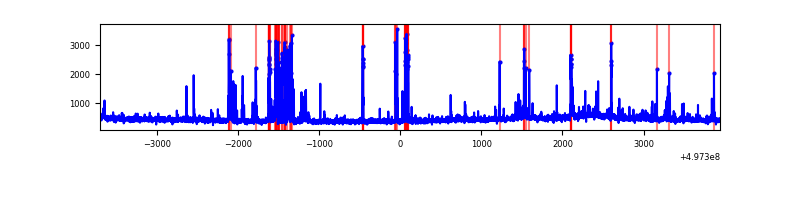 |
| B | 7643 | 7643 | 121 | 121 | 1.58% | 1.58% | 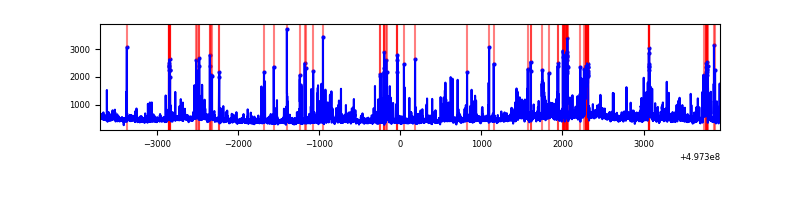 |
| C | 7643 | 7643 | 952 | 952 | 12.46% | 12.46% | 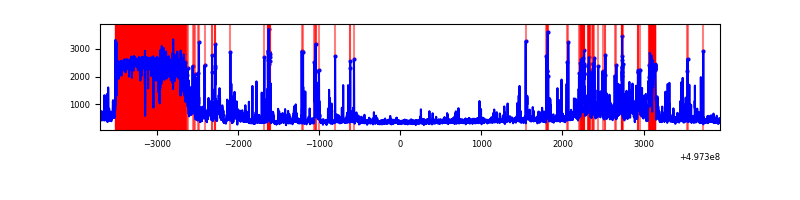 |
| D | 7643 | 7643 | 1221 | 1221 | 15.98% | 15.98% | 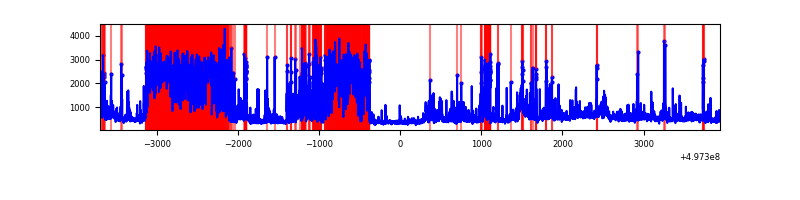 |
Top three noisy pixels from each quadrant. If the there are fewer than three noisy pixels in the level2.evt file, extra rows are filled as -1
| Pixel properties | Quadrant properties | ||||||
|---|---|---|---|---|---|---|---|
| Quadrant | DetID | PixID | Counts | Sigma | Mean | Median | Sigma |
| A | 15 | 174 | 253399 | 1268.68 | 800 | 781 | 199.1 |
| A | 0 | 8 | 192135 | 961.0 | 800 | 781 | 199.1 |
| A | 7 | 29 | 105045 | 523.63 | 800 | 781 | 199.1 |
| B | 4 | 171 | 368320 | 2189.62 | 791 | 765 | 167.9 |
| B | 15 | 20 | 169147 | 1003.1 | 791 | 765 | 167.9 |
| B | 5 | 185 | 163320 | 968.38 | 791 | 765 | 167.9 |
| C | 15 | 215 | 1491093 | 7494.4 | 721 | 713 | 198.9 |
| C | 15 | 216 | 646041 | 3245.04 | 721 | 713 | 198.9 |
| C | 12 | 252 | 385833 | 1936.58 | 721 | 713 | 198.9 |
| D | 8 | 176 | 2311825 | 11047.15 | 735 | 704 | 209.2 |
| D | 3 | 12 | 1677250 | 8013.88 | 735 | 704 | 209.2 |
| D | 2 | 172 | 189909 | 904.4 | 735 | 704 | 209.2 |
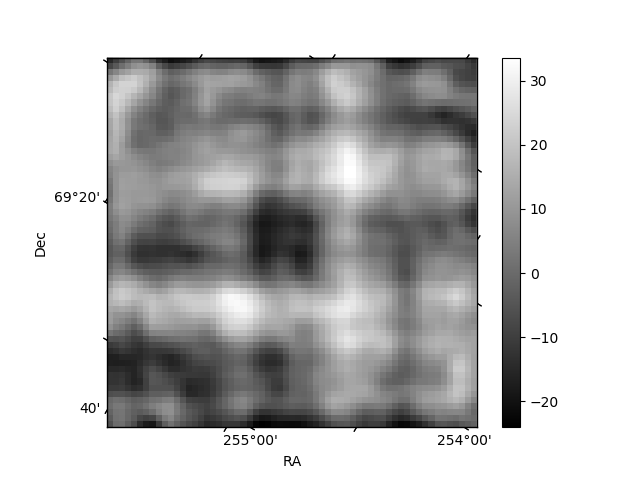
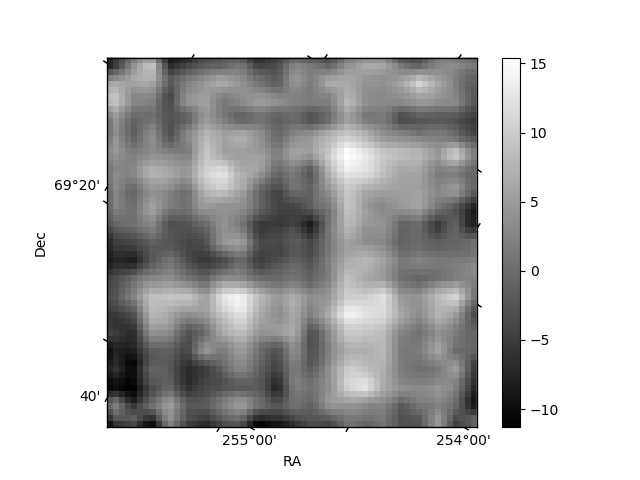
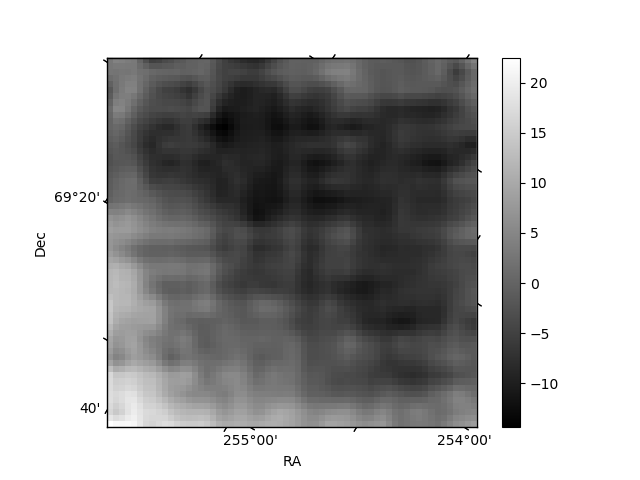
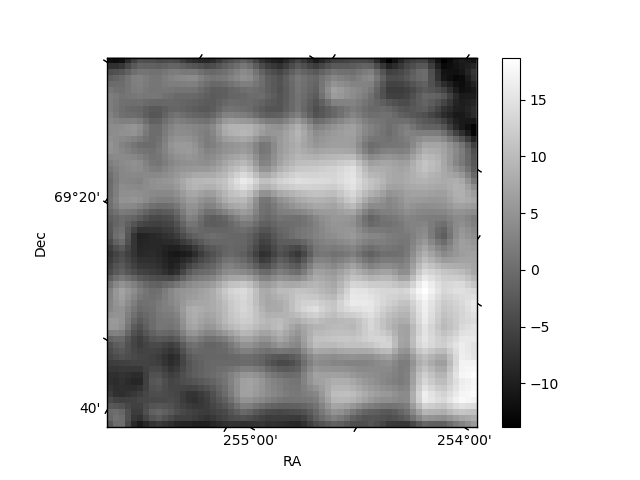
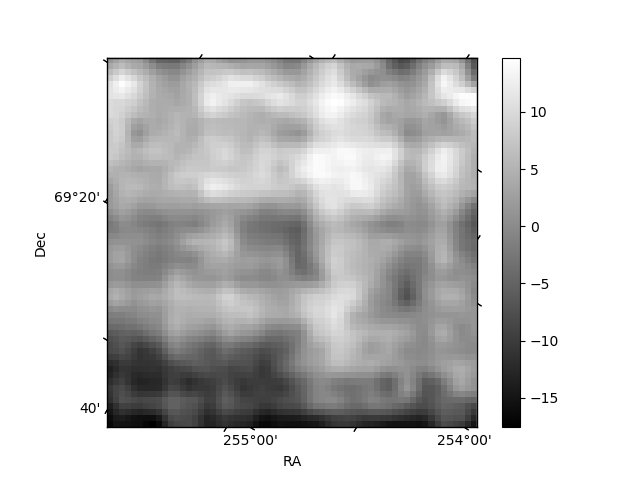
Histogram calculated using DETX and DETY for each event in the final _common_clean file
| Quadrant A | 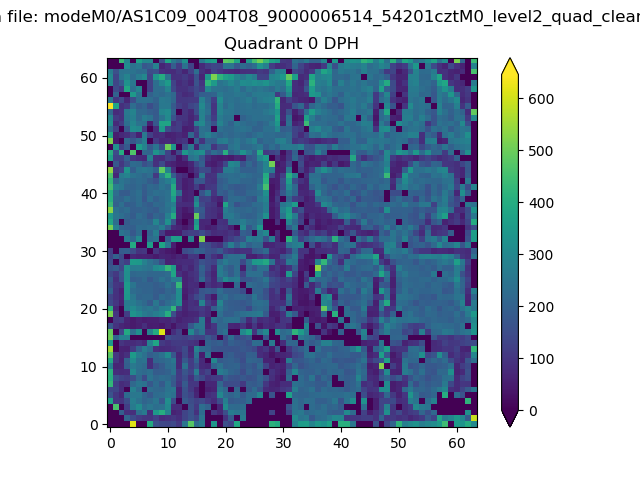 |
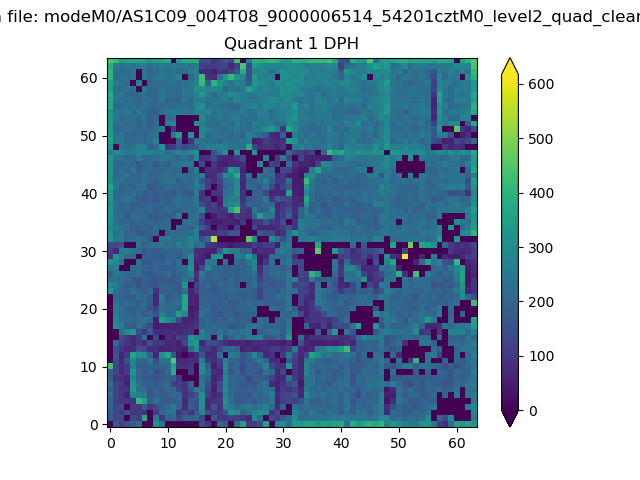 |
Quadrant B |
|---|---|---|---|
| Quadrant D | 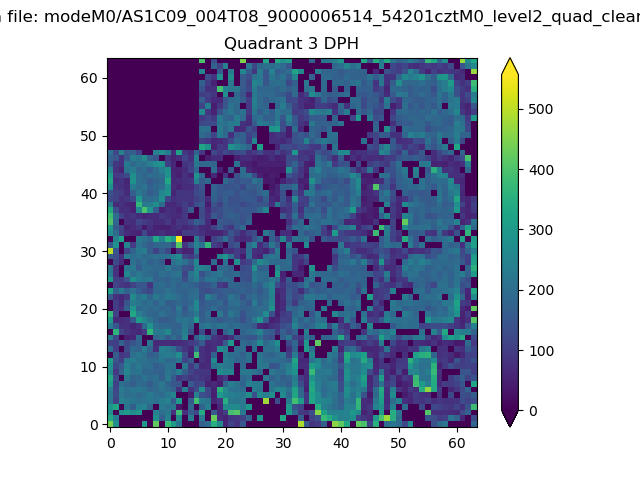 |
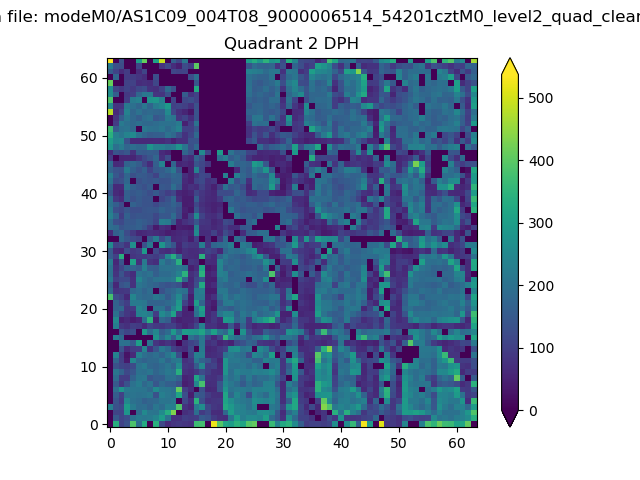 |
Quadrant C |
| Plot type | Count rate plots | Images |
|---|---|---|
| Comparison with Poisson distribution Blue bars denote a histogram of data divided into 1 sec bins. Red curve is a Poisson curve with rate = median count rate of data. |
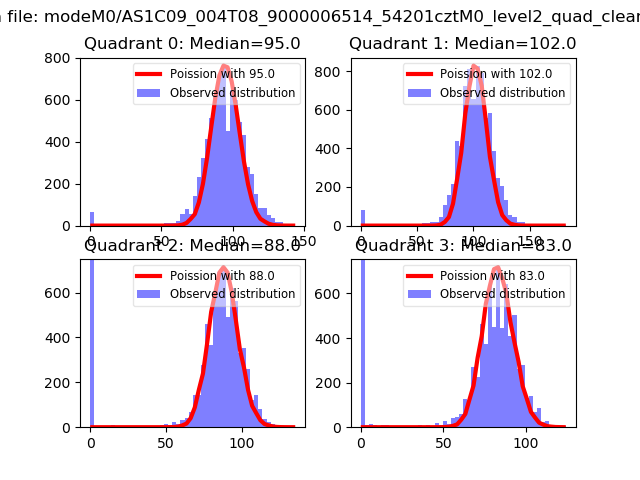 |
 |
| Quadrant-wise count rates Data is divided into 100 sec bins |
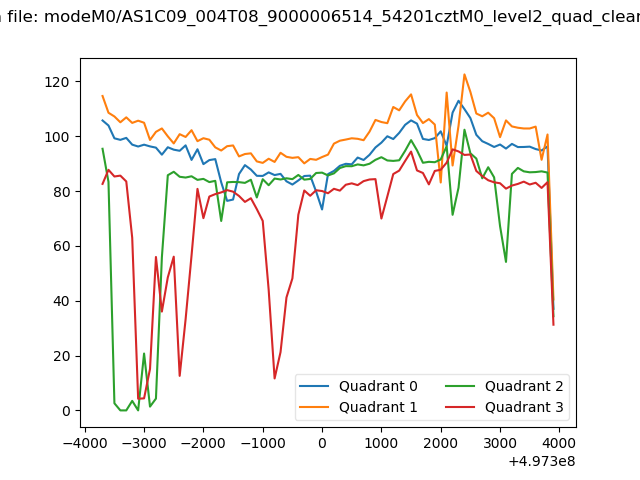 |
|
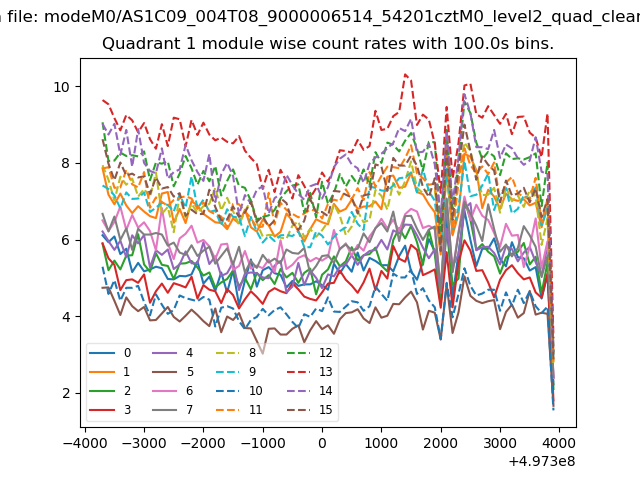
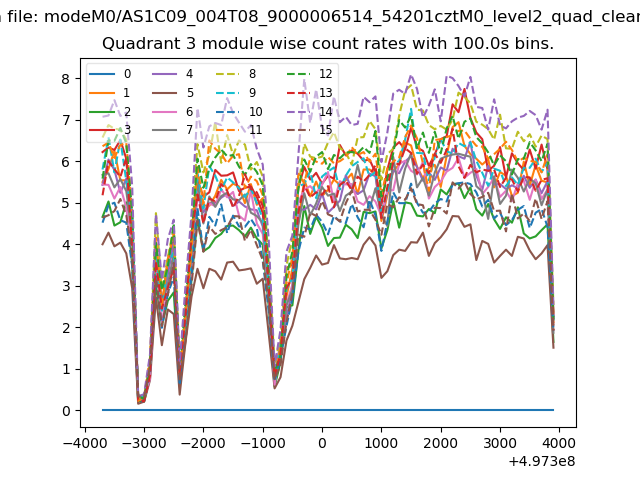
| Module-wise count rates for Quadrant A Data is divided into 100 sec bins |
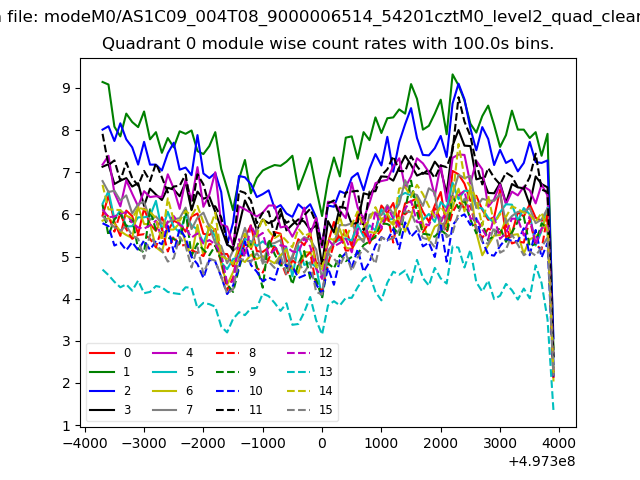 |
 |
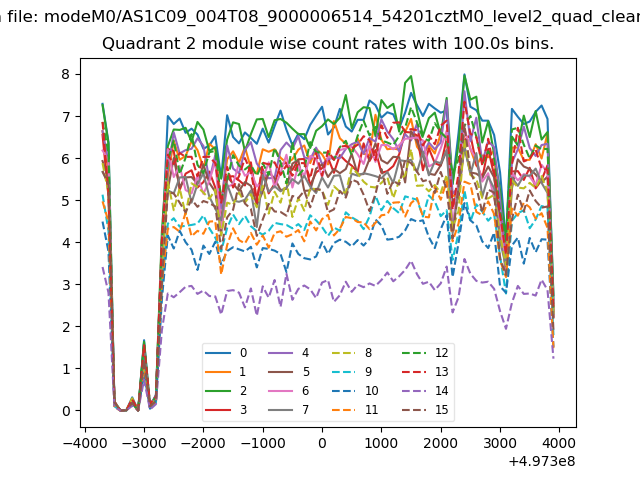
| Module-wise count rates for Quadrant B Data is divided into 100 sec bins |
 |
 |
| Module-wise count rates for Quadrant C Data is divided into 100 sec bins |
 |
 |
| Module-wise count rates for Quadrant D Data is divided into 100 sec bins |
 |
 |
| Parameter | Plot |
|---|---|
| CZT HV Monitor |  |
| D_VDD | 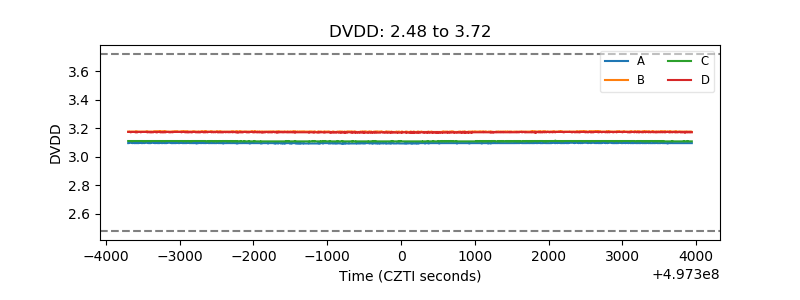 |
| Temperature 1 | 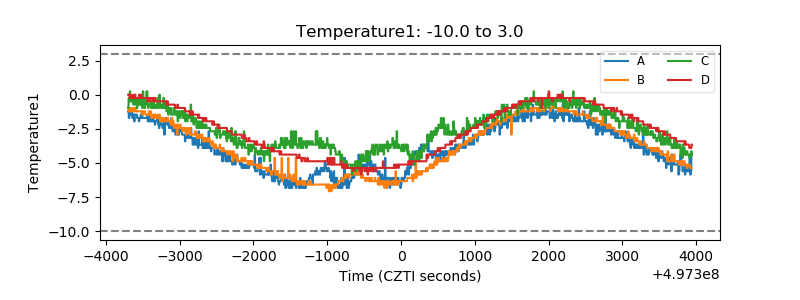 |
| Veto HV Monitor | 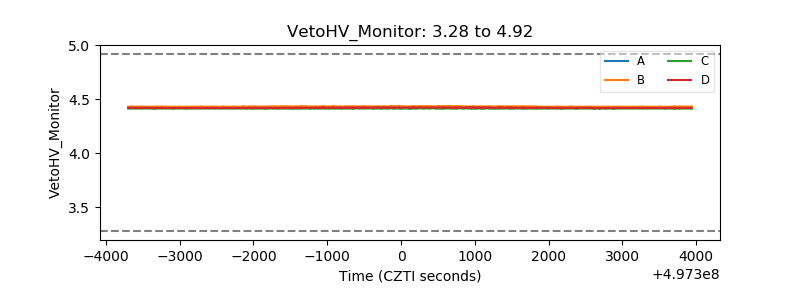 |
| Veto LLD | 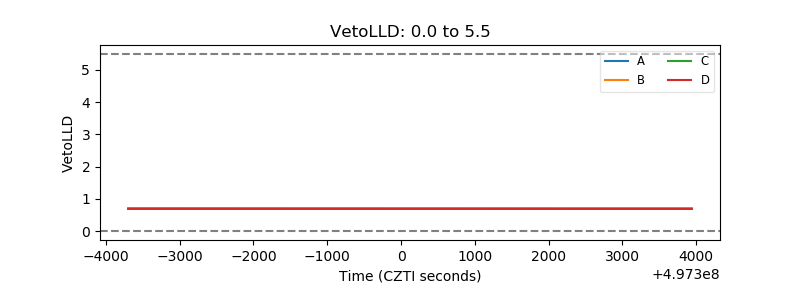 |
| Alpha Counter | 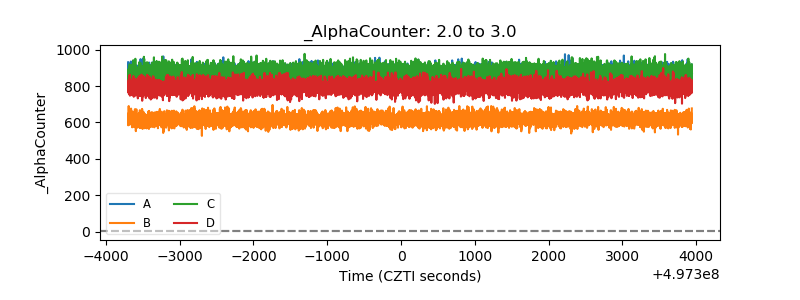 |
| _CPM_Rate | 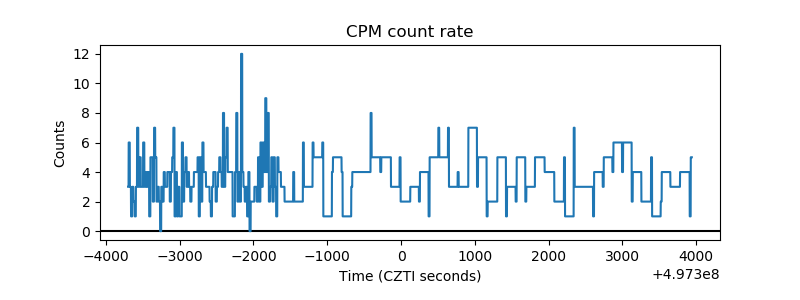 |
| CZT Counter | 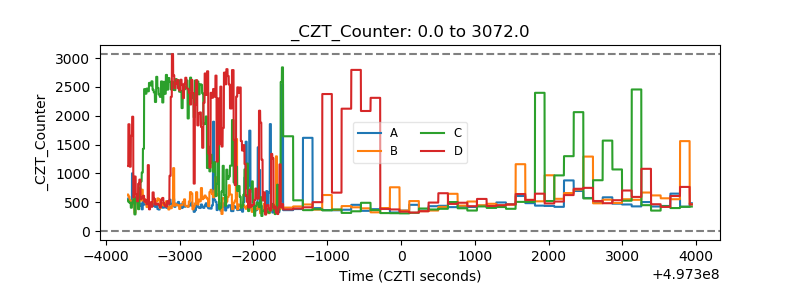 |
| +2.5 Volts monitor |  |
| +5 Volts monitor |  |
| _ROLL_ROT | 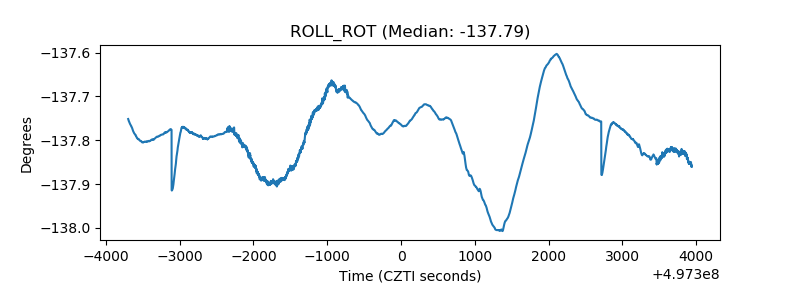 |
| _Roll_DEC |  |
| _Roll_RA | 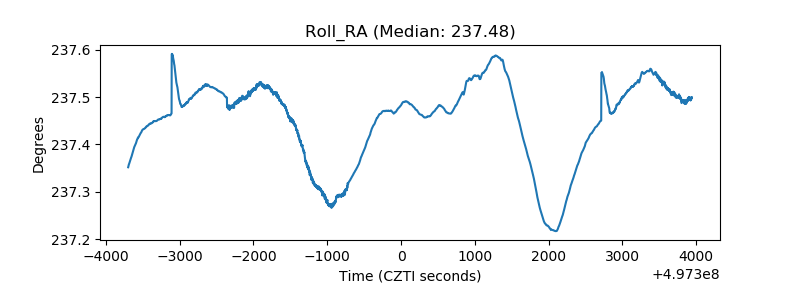 |
| Veto Counter | 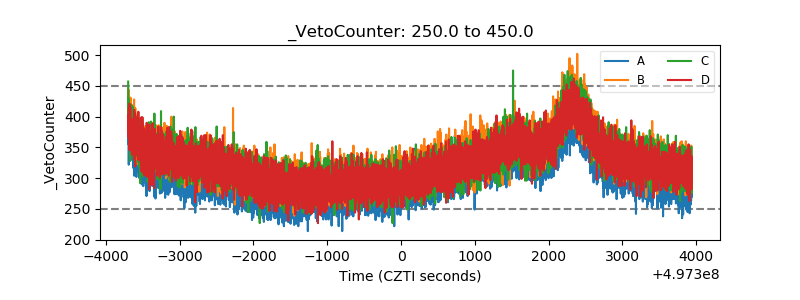 |