| Param | Original file | Final file |
|---|---|---|
| Filename | modeM0/AS1C09_004T08_9000006514_54202cztM0_level2.fits | modeM0/AS1C09_004T08_9000006514_54202cztM0_level2_quad_clean.evt |
| Size (bytes) | 551,413,440 | 120,199,680 |
| Size | 525.9 MB | 114.6 MB |
| Events in quadrant A | 4,235,443 | 795,516 |
| Events in quadrant B | 5,203,551 | 842,184 |
| Events in quadrant C | 4,934,100 | 724,593 |
| Events in quadrant D | 5,387,723 | 694,747 |
| Mode M0 | |||
|---|---|---|---|
| Quadrant | BADHDUFLAG | Total packets | Discarded packets |
| A | 0 | 18639 | 0 |
| B | 0 | 21285 | 0 |
| C | 0 | 20988 | 0 |
| D | 0 | 21913 | 0 |
| Mode SS | |||
|---|---|---|---|
| Quadrant | BADHDUFLAG | Total packets | Discarded packets |
| A | 0 | 168 | 0 |
| B | 0 | 168 | 0 |
| C | 0 | 168 | 0 |
| D | 0 | 168 | 0 |
| Quadrant | Total seconds | Saturated seconds | Saturation percentage |
|---|---|---|---|
| A | 8379 | 98 | 1.169591% |
| B | 8380 | 336 | 4.009547% |
| C | 8380 | 339 | 4.045346% |
| D | 8380 | 243 | 2.899761% |
Noise dominated data is calculated using 1-second bins in cleaned event files. If a bin has >2000 counts, and if more than 50% of those come from <1% of pixels, then it is considered to be noise-dominated and hence unusable.
| Quadrant | # 1 sec bins | Bins with >0 counts | Bins with >2000 counts | High rate bins dominated by noise | Noise dominated (total time) | Noise dominated (detector-on time) | Marked lightcurve |
|---|---|---|---|---|---|---|---|
| A | 8379 | 8379 | 84 | 84 | 1.00% | 1.00% | 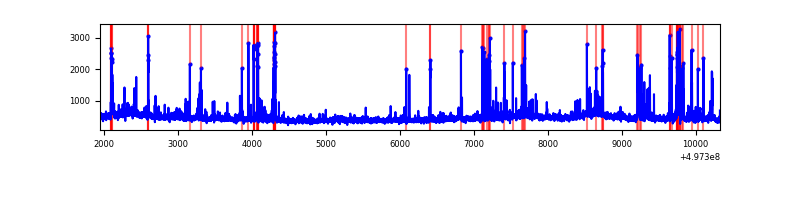 |
| B | 8380 | 8380 | 184 | 184 | 2.20% | 2.20% |  |
| C | 8380 | 8380 | 267 | 267 | 3.19% | 3.19% | 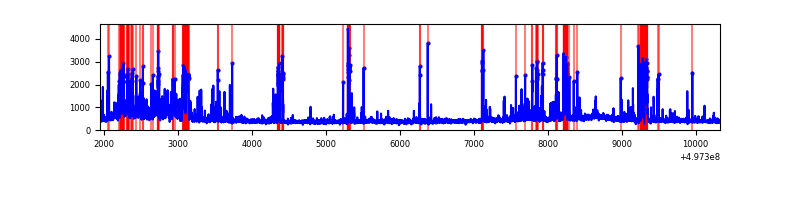 |
| D | 8380 | 8380 | 257 | 257 | 3.07% | 3.07% | 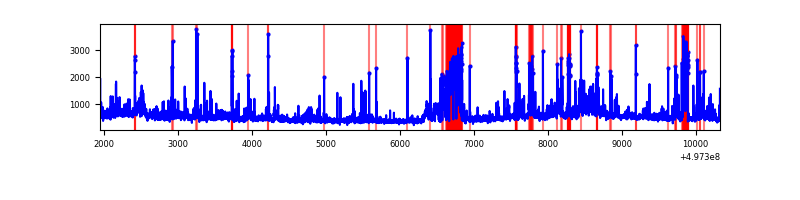 |
Top three noisy pixels from each quadrant. If the there are fewer than three noisy pixels in the level2.evt file, extra rows are filled as -1
| Pixel properties | Quadrant properties | ||||||
|---|---|---|---|---|---|---|---|
| Quadrant | DetID | PixID | Counts | Sigma | Mean | Median | Sigma |
| A | 15 | 174 | 238135 | 1071.76 | 894 | 871 | 221.4 |
| A | 3 | 130 | 145776 | 654.56 | 894 | 871 | 221.4 |
| A | 7 | 29 | 79397 | 354.71 | 894 | 871 | 221.4 |
| B | 4 | 171 | 935678 | 4976.49 | 881 | 849 | 187.8 |
| B | 15 | 20 | 186729 | 989.52 | 881 | 849 | 187.8 |
| B | 0 | 213 | 144608 | 765.29 | 881 | 849 | 187.8 |
| C | 12 | 252 | 498144 | 2090.95 | 864 | 853 | 237.8 |
| C | 15 | 215 | 322799 | 1353.68 | 864 | 853 | 237.8 |
| C | 12 | 2 | 262428 | 1099.84 | 864 | 853 | 237.8 |
| D | 2 | 207 | 585755 | 2392.07 | 867 | 830 | 244.5 |
| D | 3 | 12 | 406079 | 1657.28 | 867 | 830 | 244.5 |
| D | 2 | 172 | 226903 | 924.53 | 867 | 830 | 244.5 |
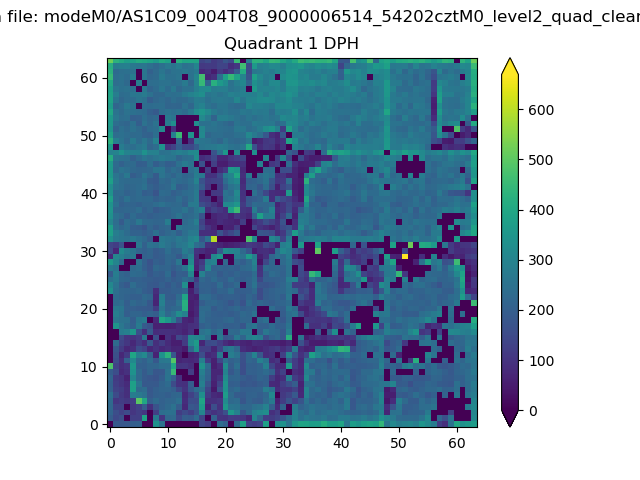
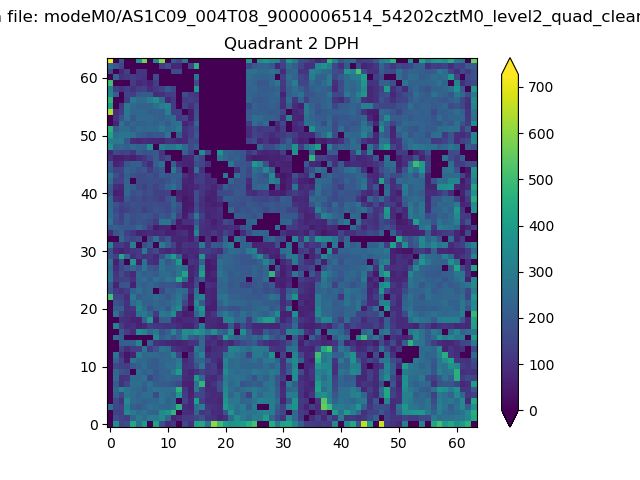
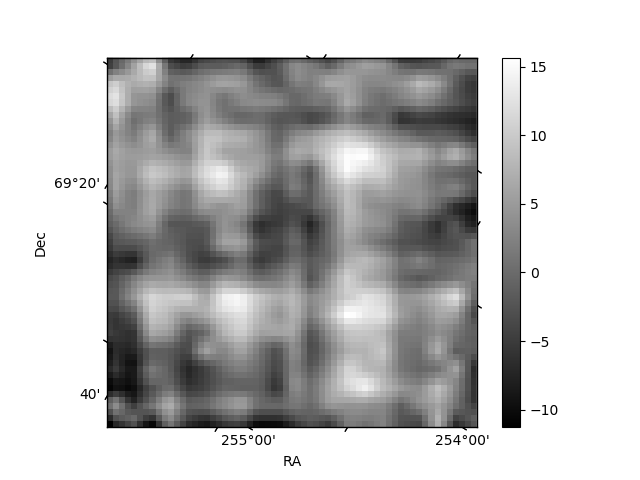
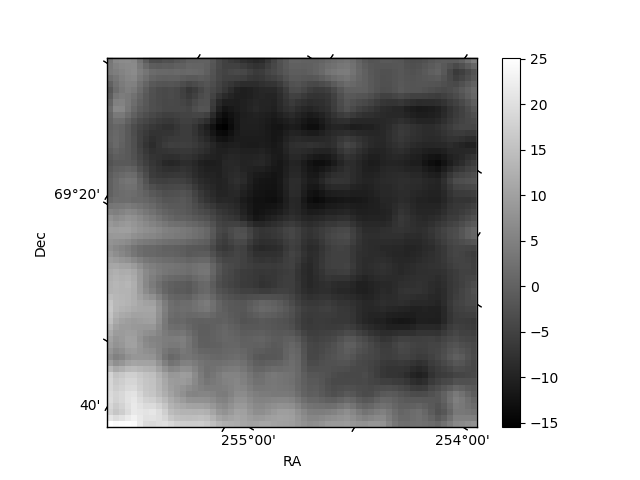
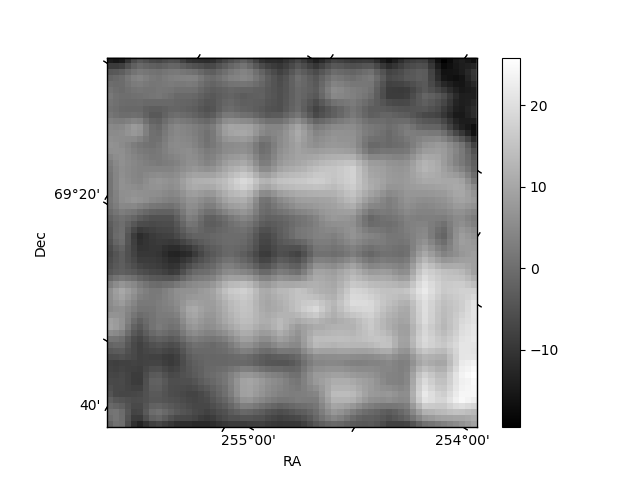
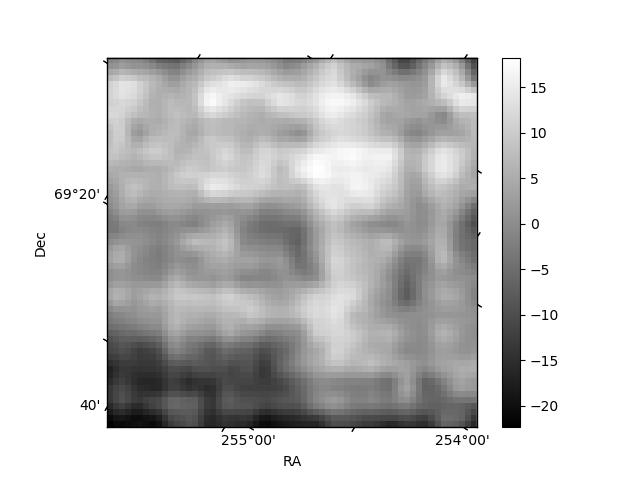
Histogram calculated using DETX and DETY for each event in the final _common_clean file
| Quadrant A | 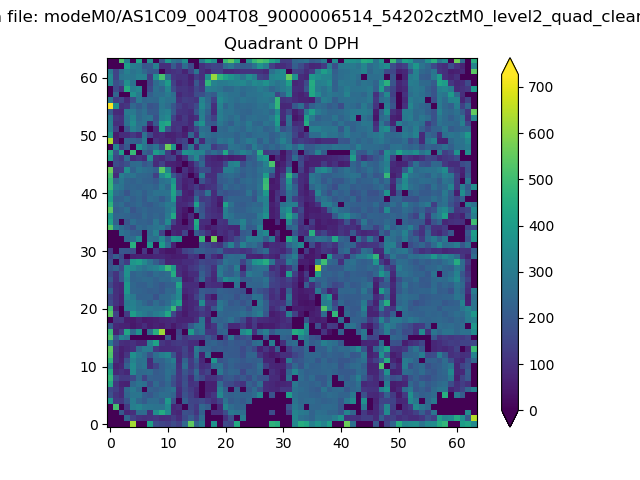 |
 |
Quadrant B |
|---|---|---|---|
| Quadrant D | 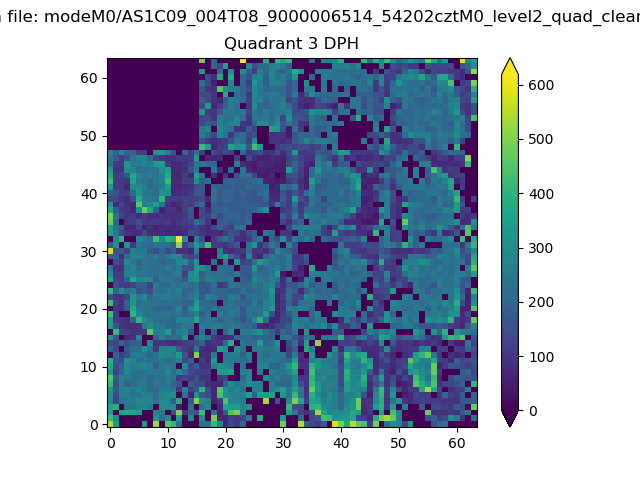 |
 |
Quadrant C |
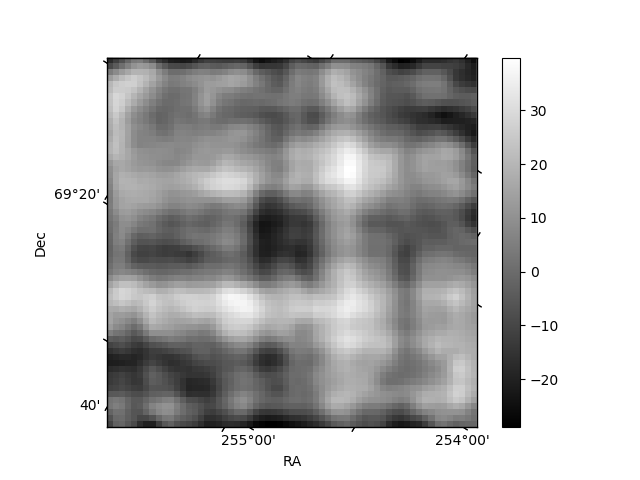
| Plot type | Count rate plots | Images |
|---|---|---|
| Comparison with Poisson distribution Blue bars denote a histogram of data divided into 1 sec bins. Red curve is a Poisson curve with rate = median count rate of data. |
 |
 |
| Quadrant-wise count rates Data is divided into 100 sec bins |
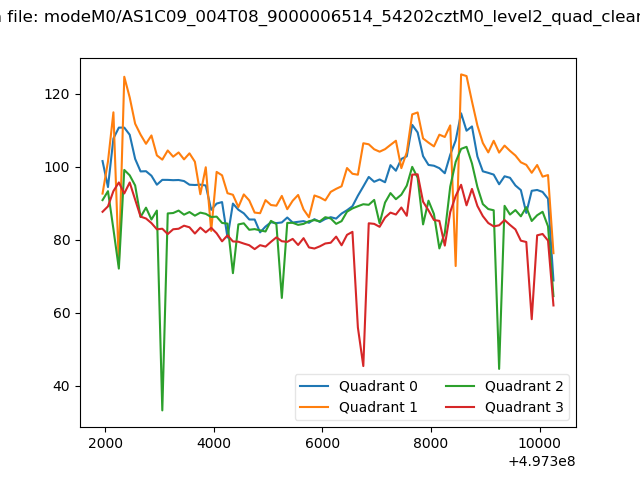 |
|
| Module-wise count rates for Quadrant A Data is divided into 100 sec bins |
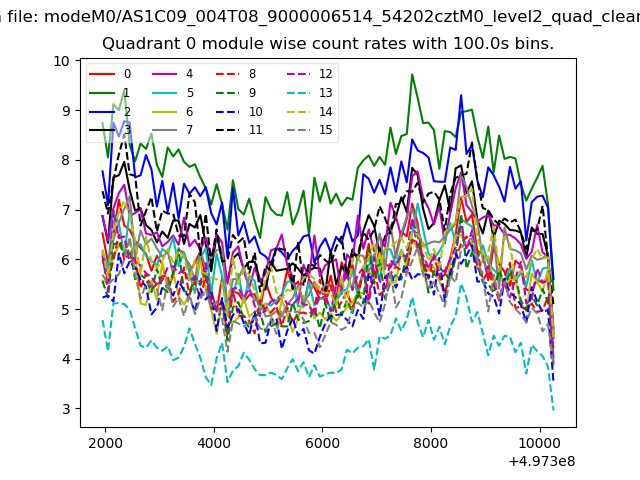 |
 |
| Module-wise count rates for Quadrant B Data is divided into 100 sec bins |
 |
 |
| Module-wise count rates for Quadrant C Data is divided into 100 sec bins |
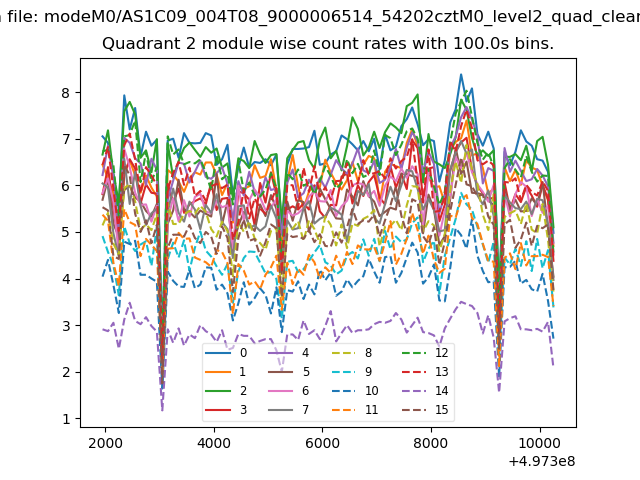 |
 |
| Module-wise count rates for Quadrant D Data is divided into 100 sec bins |
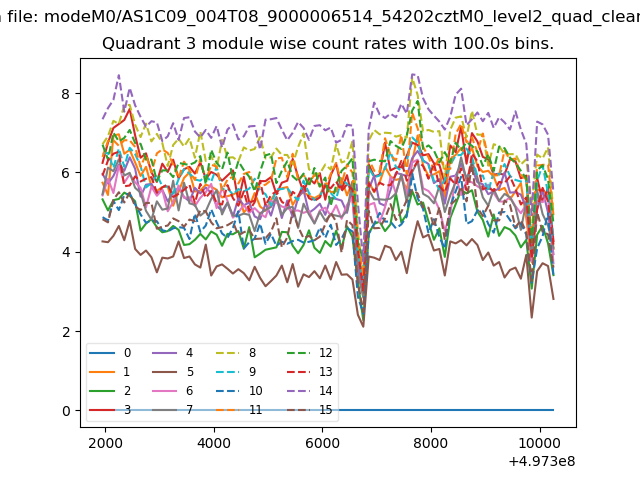 |
 |
| Parameter | Plot |
|---|---|
| CZT HV Monitor | 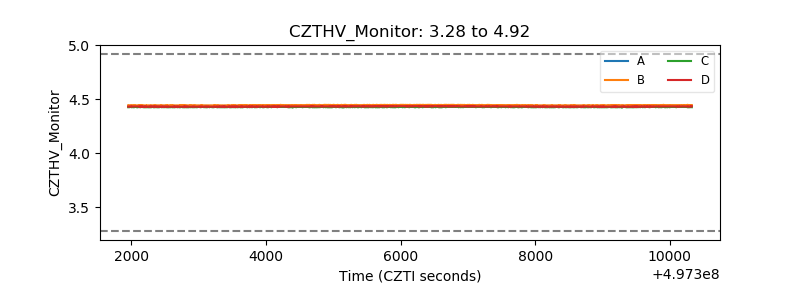 |
| D_VDD | 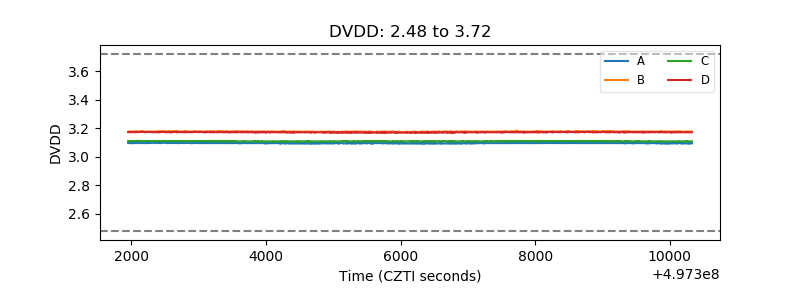 |
| Temperature 1 | 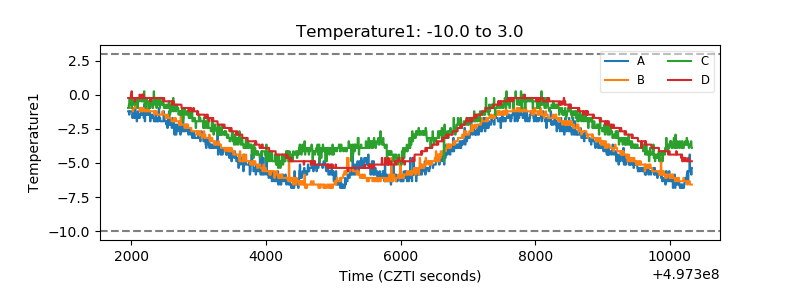 |
| Veto HV Monitor | 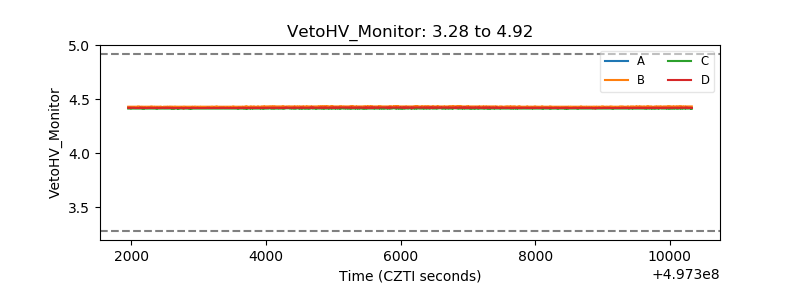 |
| Veto LLD | 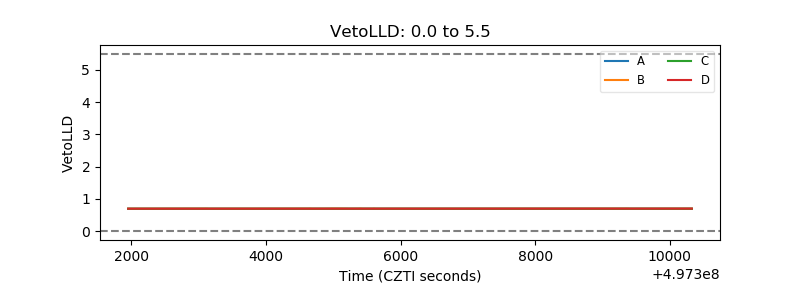 |
| Alpha Counter | 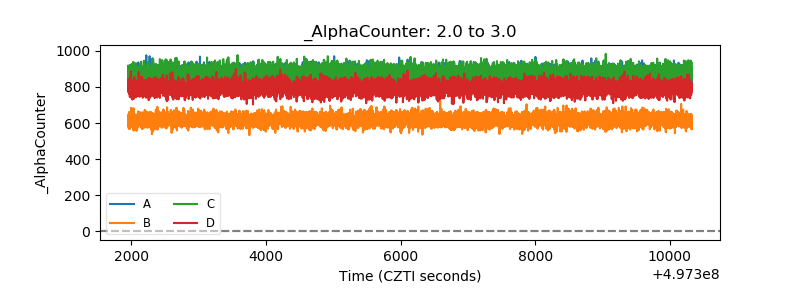 |
| _CPM_Rate |  |
| CZT Counter | 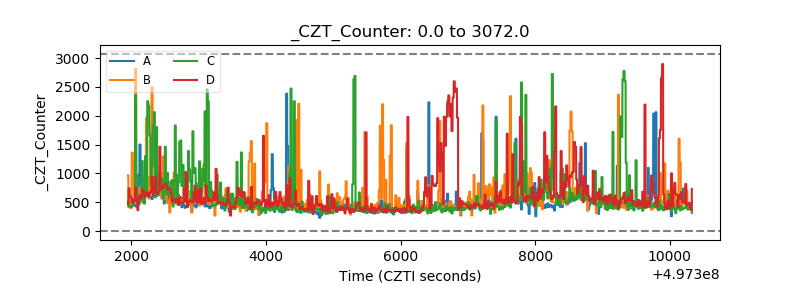 |
| +2.5 Volts monitor |  |
| +5 Volts monitor | 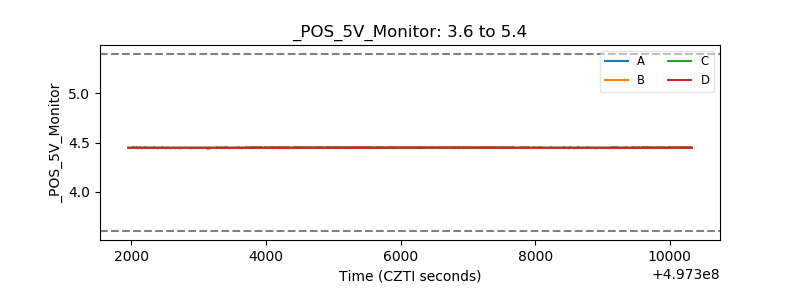 |
| _ROLL_ROT | 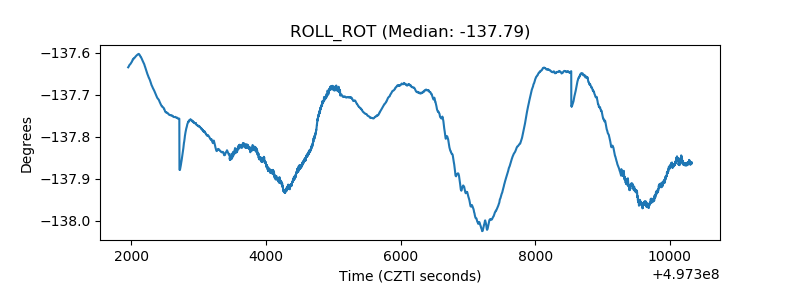 |
| _Roll_DEC | 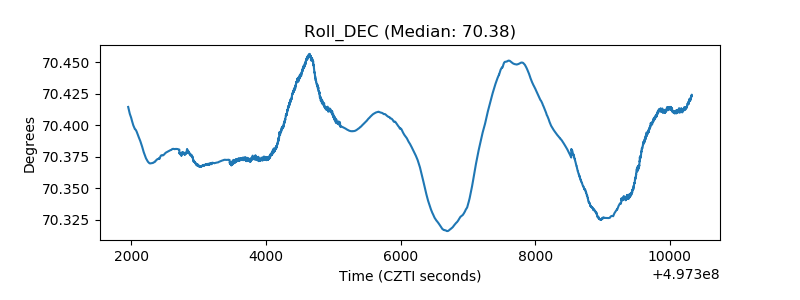 |
| _Roll_RA | 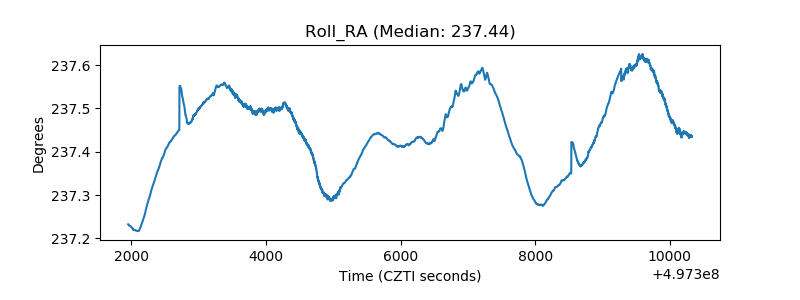 |
| Veto Counter | 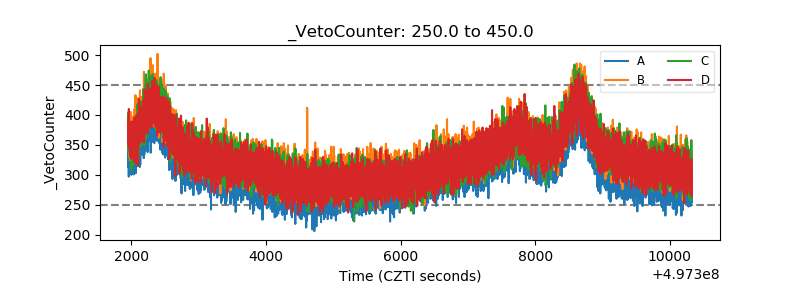 |