| Param | Original file | Final file |
|---|---|---|
| Filename | modeM0/AS1C09_004T08_9000006514_54205cztM0_level2.fits | modeM0/AS1C09_004T08_9000006514_54205cztM0_level2_quad_clean.evt |
| Size (bytes) | 1,303,755,840 | 284,143,680 |
| Size | 1.2 GB | 271.0 MB |
| Events in quadrant A | 10,229,701 | 1,869,580 |
| Events in quadrant B | 11,965,996 | 1,992,480 |
| Events in quadrant C | 10,676,284 | 1,755,615 |
| Events in quadrant D | 13,817,019 | 1,587,339 |
| Mode M0 | |||
|---|---|---|---|
| Quadrant | BADHDUFLAG | Total packets | Discarded packets |
| A | 0 | 45350 | 2 |
| B | 0 | 50287 | 3 |
| C | 0 | 47295 | 2 |
| D | 0 | 55403 | 2 |
| Mode M9 | |||
|---|---|---|---|
| Quadrant | BADHDUFLAG | Total packets | Discarded packets |
| A | 0 | 11 | 0 |
| B | 0 | 11 | 0 |
| C | 0 | 11 | 0 |
| D | 0 | 11 | 0 |
| Mode SS | |||
|---|---|---|---|
| Quadrant | BADHDUFLAG | Total packets | Discarded packets |
| A | 0 | 410 | 0 |
| B | 0 | 410 | 0 |
| C | 0 | 410 | 0 |
| D | 0 | 410 | 0 |
| Quadrant | Total seconds | Saturated seconds | Saturation percentage |
|---|---|---|---|
| A | 20299 | 386 | 1.901572% |
| B | 20298 | 777 | 3.827963% |
| C | 20299 | 577 | 2.842505% |
| D | 20299 | 988 | 4.867235% |
Noise dominated data is calculated using 1-second bins in cleaned event files. If a bin has >2000 counts, and if more than 50% of those come from <1% of pixels, then it is considered to be noise-dominated and hence unusable.
| Quadrant | # 1 sec bins | Bins with >0 counts | Bins with >2000 counts | High rate bins dominated by noise | Noise dominated (total time) | Noise dominated (detector-on time) | Marked lightcurve |
|---|---|---|---|---|---|---|---|
| A | 21320 | 20302 | 232 | 232 | 1.09% | 1.14% | 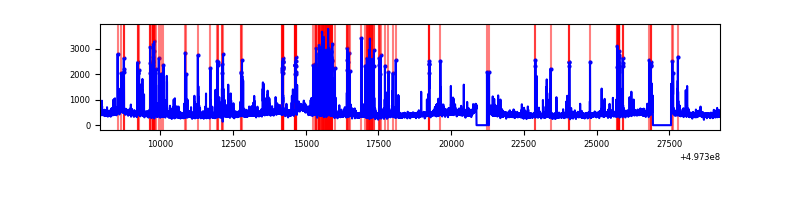 |
| B | 21319 | 20300 | 310 | 310 | 1.45% | 1.53% | 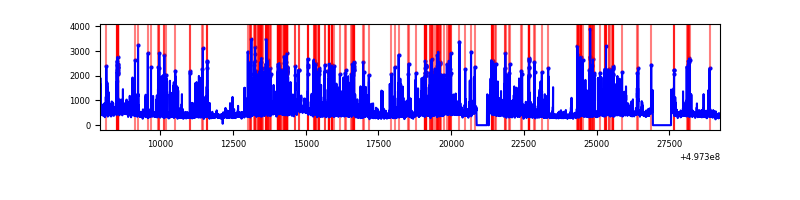 |
| C | 21320 | 20302 | 444 | 444 | 2.08% | 2.19% | 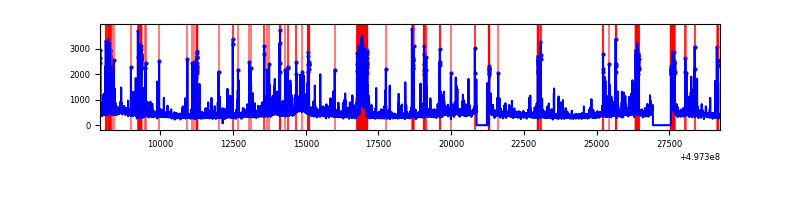 |
| D | 21320 | 20303 | 884 | 884 | 4.15% | 4.35% | 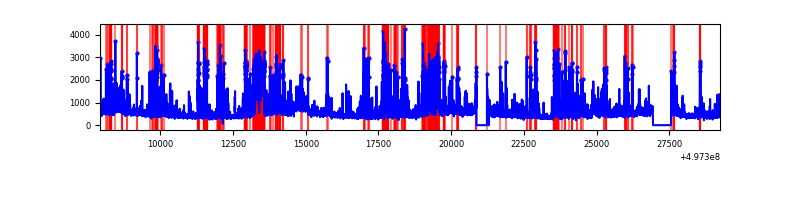 |
Top three noisy pixels from each quadrant. If the there are fewer than three noisy pixels in the level2.evt file, extra rows are filled as -1
| Pixel properties | Quadrant properties | ||||||
|---|---|---|---|---|---|---|---|
| Quadrant | DetID | PixID | Counts | Sigma | Mean | Median | Sigma |
| A | 7 | 29 | 444455 | 831.65 | 2150 | 2096 | 531.9 |
| A | 3 | 130 | 350356 | 654.74 | 2150 | 2096 | 531.9 |
| A | 0 | 8 | 334489 | 624.91 | 2150 | 2096 | 531.9 |
| B | 4 | 171 | 2003417 | 4430.49 | 2131 | 2055 | 451.7 |
| B | 5 | 185 | 392034 | 863.31 | 2131 | 2055 | 451.7 |
| B | 5 | 236 | 269906 | 592.95 | 2131 | 2055 | 451.7 |
| C | 12 | 252 | 634645 | 1111.53 | 2086 | 2065 | 569.1 |
| C | 1 | 241 | 493984 | 864.37 | 2086 | 2065 | 569.1 |
| C | 12 | 2 | 408780 | 714.65 | 2086 | 2065 | 569.1 |
| D | 8 | 176 | 3211358 | 5523.34 | 2053 | 1960 | 581.1 |
| D | 3 | 12 | 813723 | 1397.03 | 2053 | 1960 | 581.1 |
| D | 2 | 172 | 382896 | 655.59 | 2053 | 1960 | 581.1 |
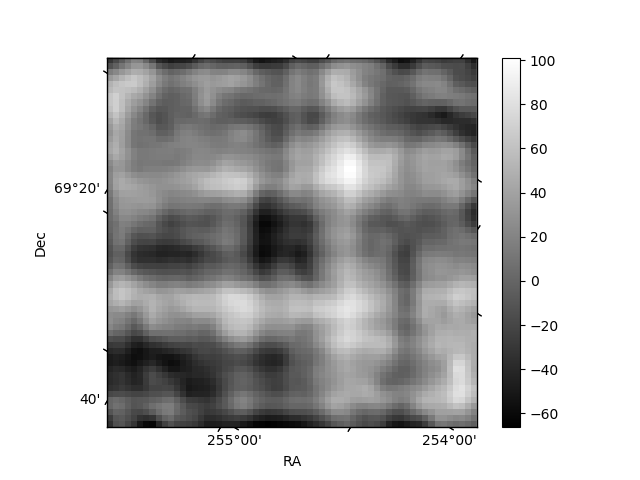
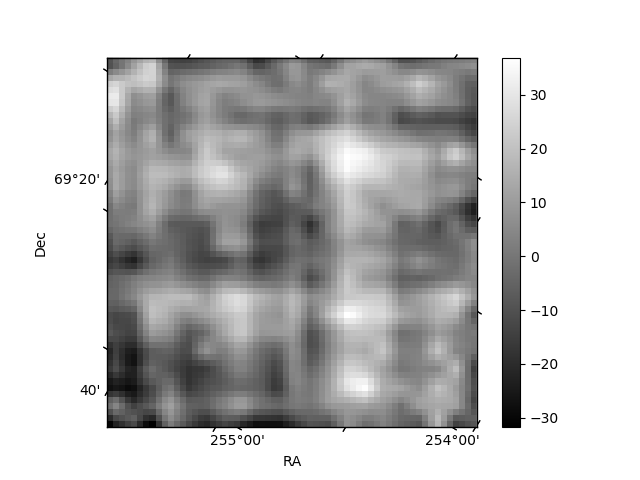
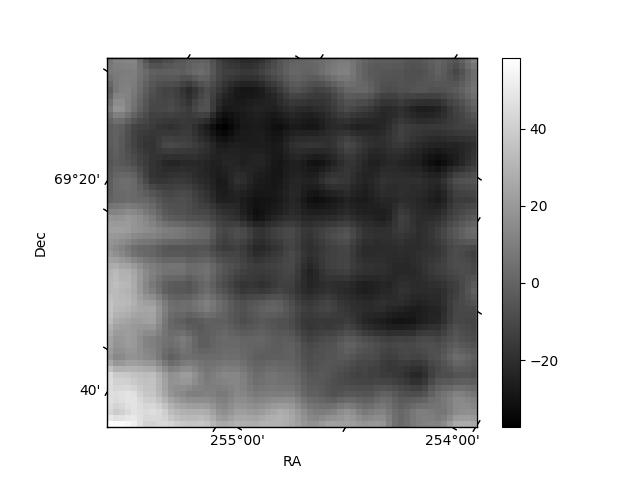
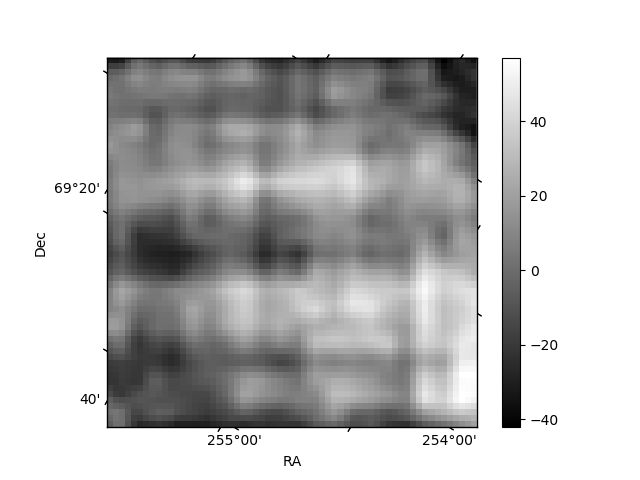
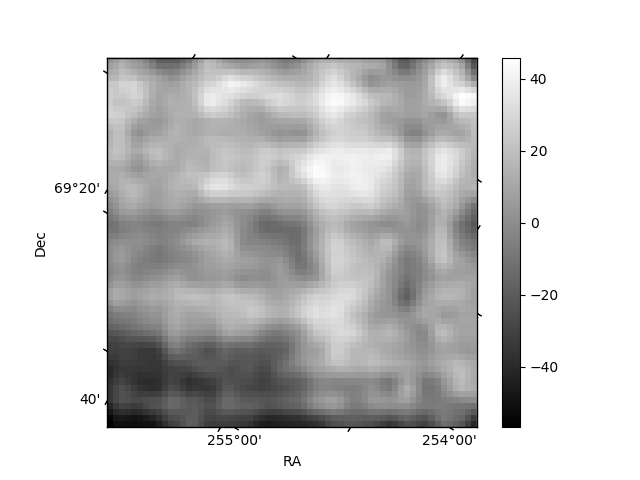
Histogram calculated using DETX and DETY for each event in the final _common_clean file
| Quadrant A | 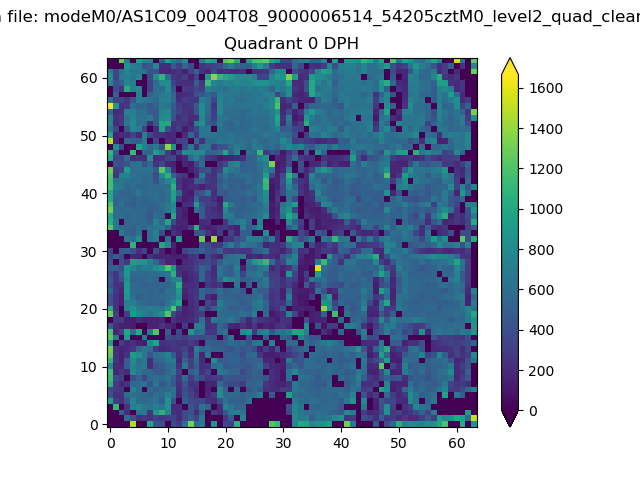 |
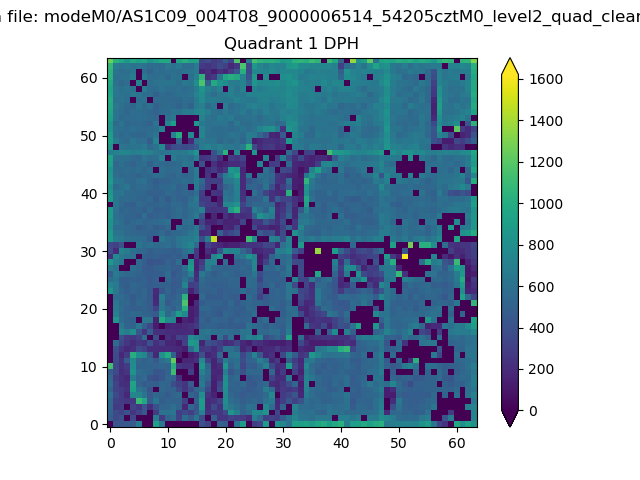 |
Quadrant B |
|---|---|---|---|
| Quadrant D | 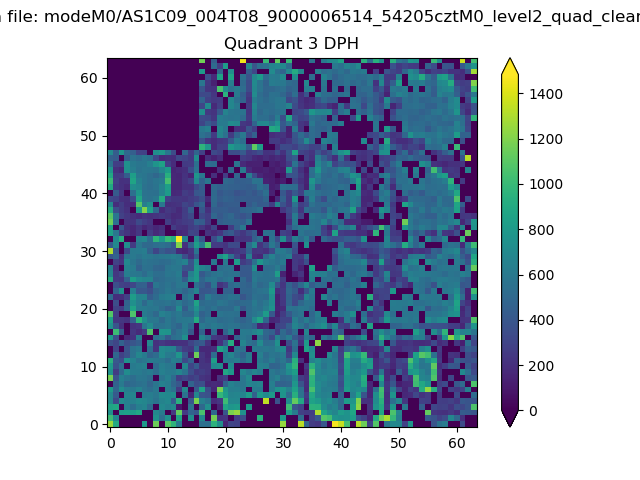 |
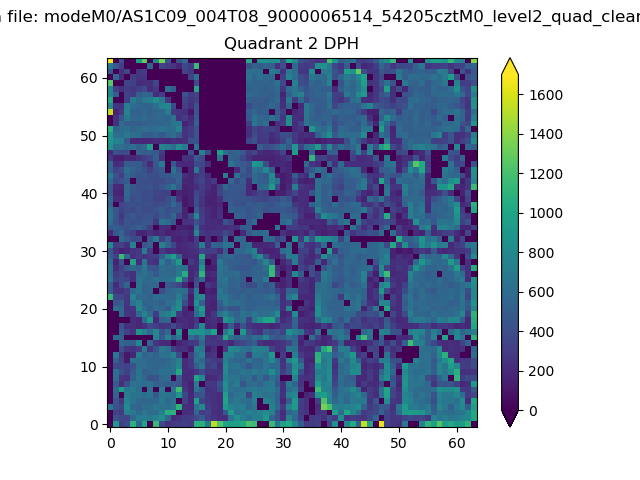 |
Quadrant C |
| Plot type | Count rate plots | Images |
|---|---|---|
| Comparison with Poisson distribution Blue bars denote a histogram of data divided into 1 sec bins. Red curve is a Poisson curve with rate = median count rate of data. |
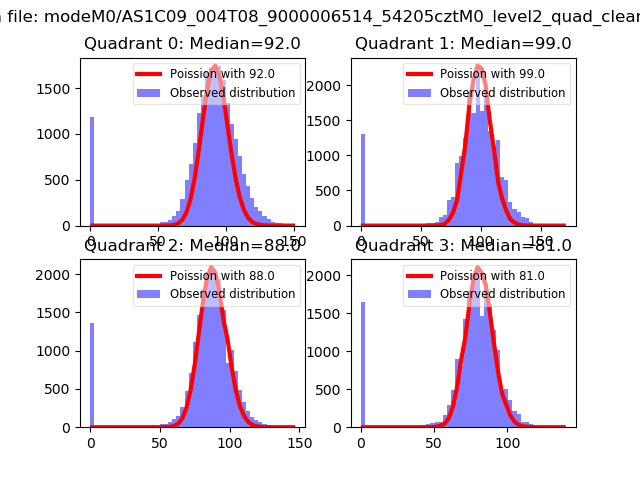 |
 |
| Quadrant-wise count rates Data is divided into 100 sec bins |
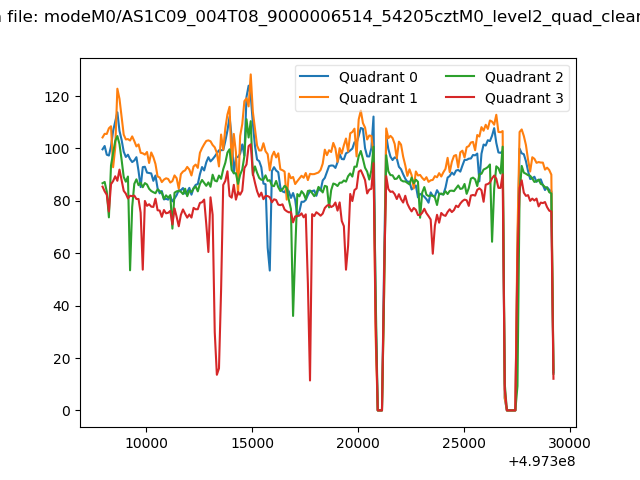 |
|
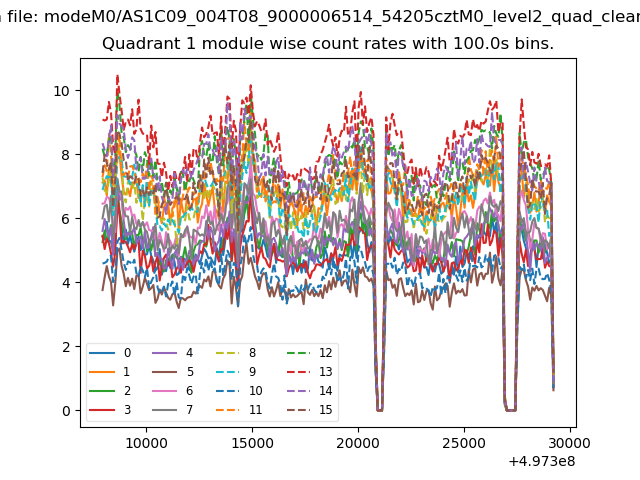
| Module-wise count rates for Quadrant A Data is divided into 100 sec bins |
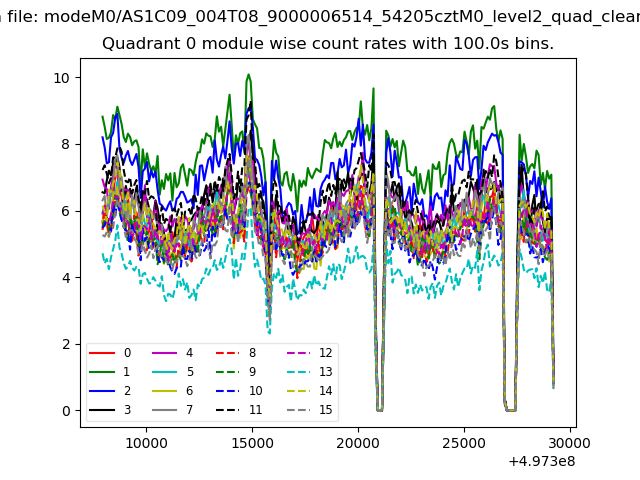 |
 |
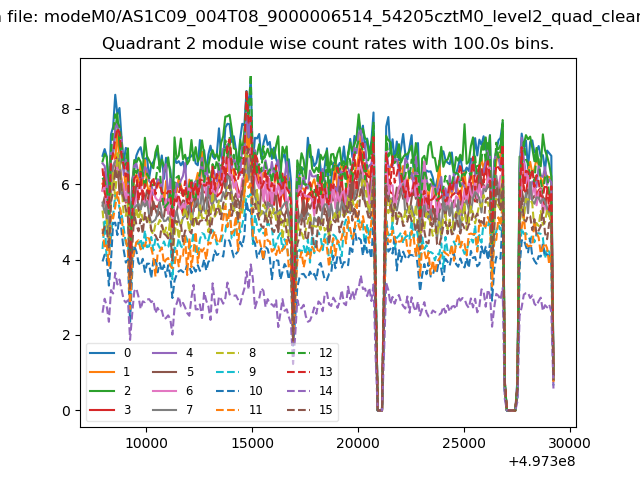
| Module-wise count rates for Quadrant B Data is divided into 100 sec bins |
 |
 |
| Module-wise count rates for Quadrant C Data is divided into 100 sec bins |
 |
 |
| Module-wise count rates for Quadrant D Data is divided into 100 sec bins |
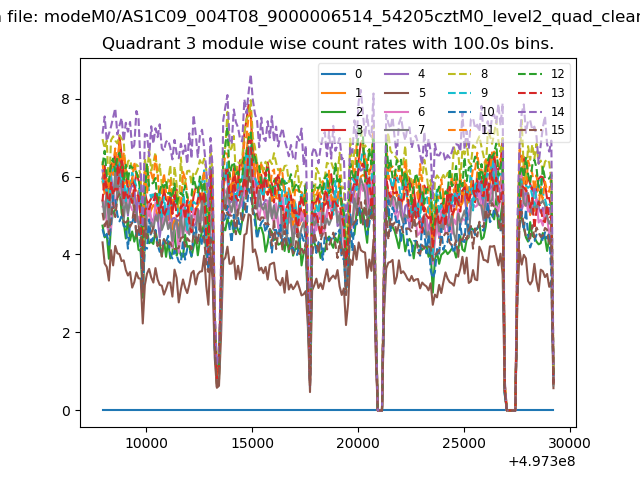 |
 |
| Parameter | Plot |
|---|---|
| CZT HV Monitor | 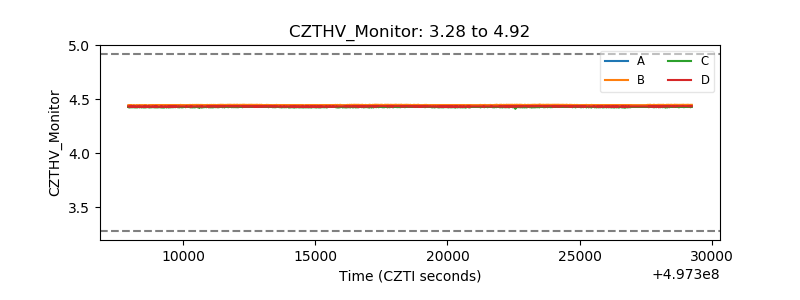 |
| D_VDD | 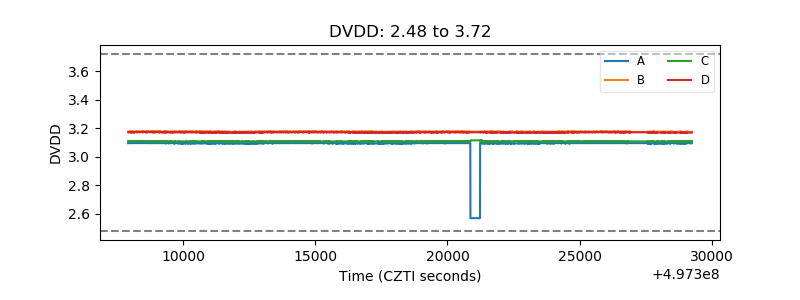 |
| Temperature 1 | 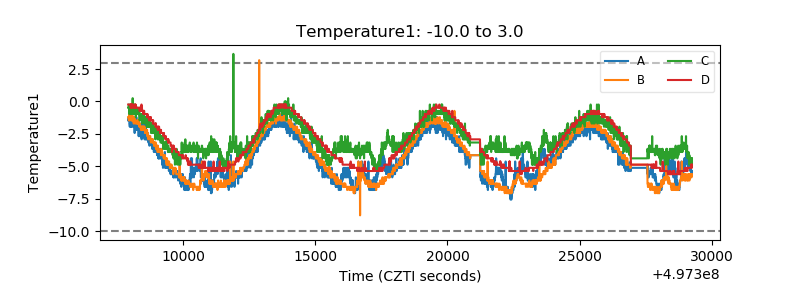 |
| Veto HV Monitor | 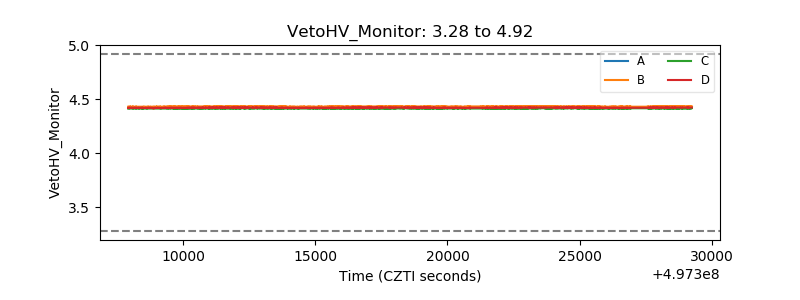 |
| Veto LLD | 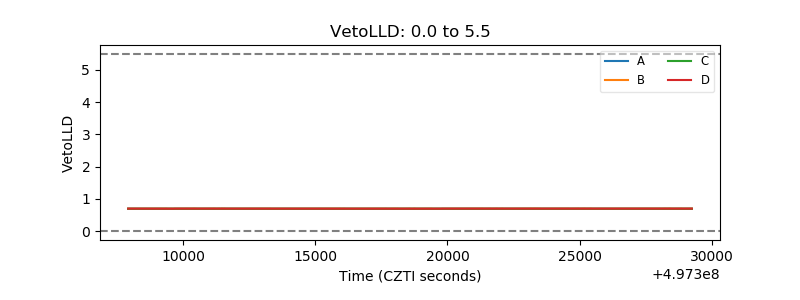 |
| Alpha Counter | 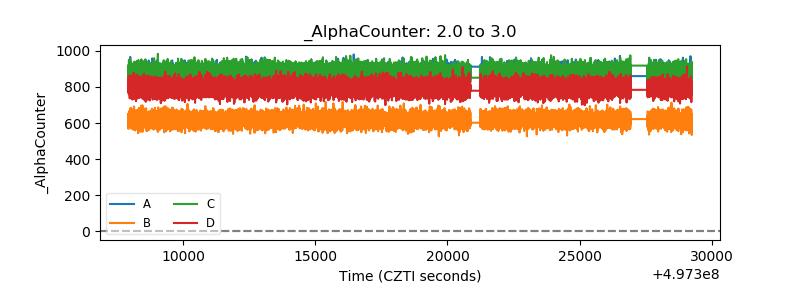 |
| _CPM_Rate | 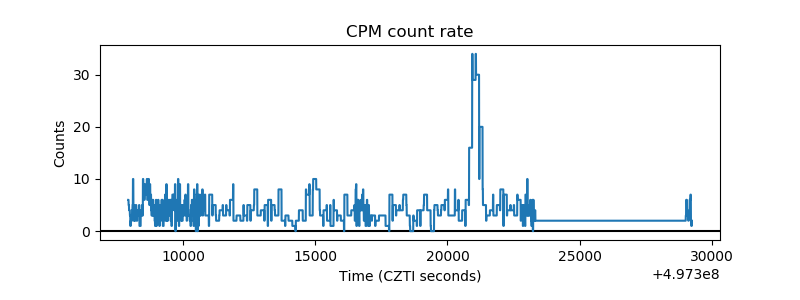 |
| CZT Counter | 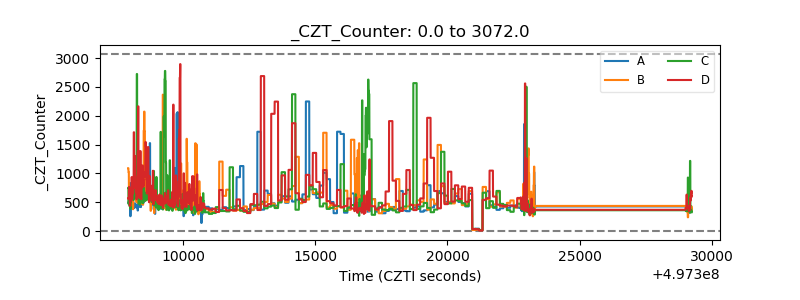 |
| +2.5 Volts monitor |  |
| +5 Volts monitor |  |
| _ROLL_ROT | 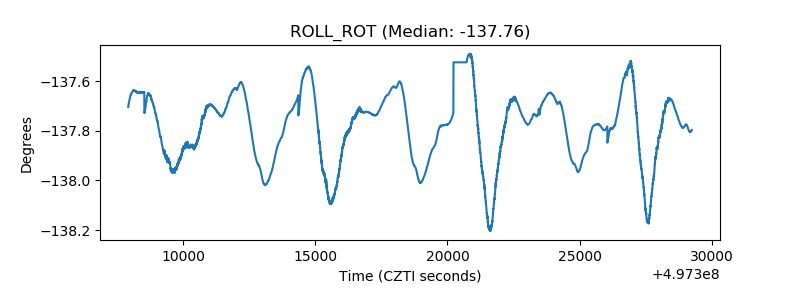 |
| _Roll_DEC | 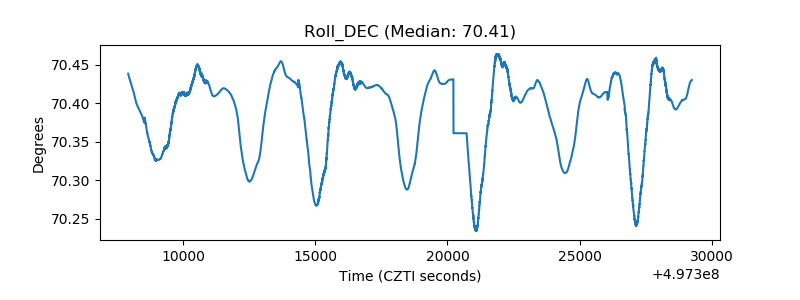 |
| _Roll_RA | 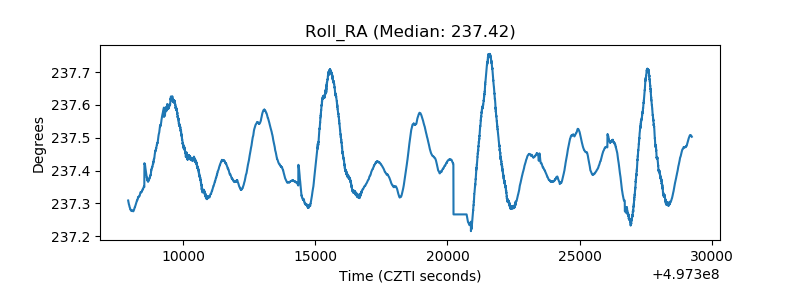 |
| Veto Counter | 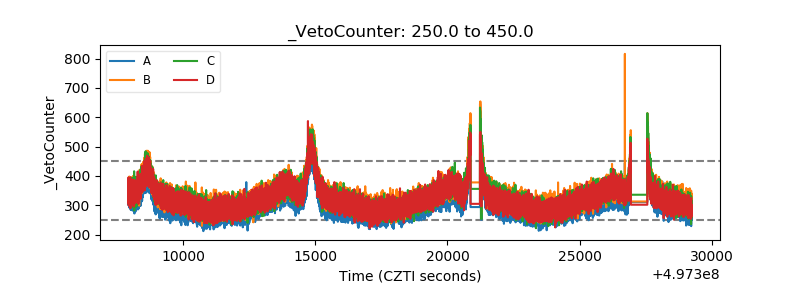 |